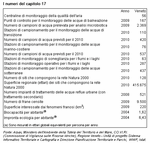
Currently in Veneto, the air quality monitoring network is made up of 56 stations with the same number of Electronic Control Units (ECUs).
In 2009 the network that monitors bathing areas (SIRAV 07 Network) had a total of 167 monitoring sites. Chemical-physical surveys, visual/olfactory inspections and water sampling for microbiological analysis were carried out in each of these sites for a total of 2,369 samples.
For the year 2010, the network that monitors transition waters (SIRAV 06 Network) is made up of 110 sampling stations and 420 samples are expected to be taken.
For the network that monitors marine-coastal waters, there are 76 sampling stations that expect to collect 537 samples. With regards to inland surface waters (lakes and rivers), there are 63 surveillance monitoring stations and 287 operational monitoring stations.
Finally, as far as groundwaters as concerned, there are 437 sampling stations spread throughout the region.
Today the Nature 2000 Network is made up of 128 sites, which cover more than one-fifth of the region, for a total of almost 414,675 hectares.
In 2008, there were 521 registered waste water treatment plants (with secondary treatment) that make up the integrated water service.
Regarding geological phenomena, up to 2009, 9,500 landslides were registered in Veneto, covering an overall area of more than 220 km2.
In 2004, the Ecological Footprint of the Veneto region was 6.43 ha per capita per year, whereas the Biocapacity was 1.62 ha per capita. This means that, since the human load (Ecological Footprint) is about 4 times greater than the level of sustainability (the Biocapacity of the planet is 1.8 ha per capita), Veneto currently has a level of unsustainability.
(Chapter 17 in figures)


