If the different components of trade are analysed, retail trade in Veneto has proved to be rather stable in the last year, not only with reference to the number of outlets, but especially to retail sales, which grew more than the national average. On 31 December 2009, there were 51,680 outlets whose main activity was retail trade, slightly above the number in 2008, i.e. +0.4%. To be more precise, there was a slight decrease in headquarters (-0.4%) accompanied by a significant increase in trade outlets (+2.1%). This confirms that nowadays more and more outlets are opened by chains.
Data show a clear propensity of Veneto trade for multiple locations. A total of 31.6% of Veneto stores are local outlets other than headquarters, while the Italian percentage is 25.7%. In other words, the distribution network of retail trade in Veneto is better developed and more deeply rooted in the region than the Italian average; what is more, the retail trade is constantly expanding
(Figure 11.3.1).
The distribution by type of business has not undergone substantial changes: sole traders are the most widespread, 50.5% of the total, followed by partnerships and corporations, which have 27.6% and 20.3% of the total respectively. Trade follows the general trend of the economy whereby the percentage of corporations is slowly, but steadily, increasing, especially at the expense of sole traders.
Decentralisation, i.e. the increase in the number of businesses which are set up in distinct locations in the form of distribution chains, is fairly evenly distributed across all types of business; the only exception is for sole traders, which underwent a decrease both in headquarters and in local stores in general.
Despite the worsening macroeconomic picture, sales in Veneto did not plummet in 2008 and at the end of the year, sales stood at over 26 million euro, a 0.6% decrease.
The expansion of large-scale distribution continued in 2008, though it was moderate (+0.9%). Small-sized businesses, on the contrary, contracted further with a yearly decrease of 2.2%. The market share of large-scale distribution stores in Veneto was stable at 50.6% of total retail sales in 2008.
If the pattern of sales of the two main types of goods is considered, sales of food products are seen to have increased (+1.4%), while those of non-food products fell by 2%. In particular, a rise in the sales of food products can be ascribed to large-scale distribution stores, which grew by 2.1% compared to a 2.2% fall in small-sized stores in 2009.
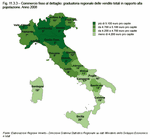
Interestingly, Valle d'Aosta, Emilia Romagna, Veneto, Umbria and Lombardia are the regions which account for the largest percentage of retail sales in Italy if sales are considered in proportion to the population of each Italian region
(Figure 11.3.2) and
(Figure 11.3.3).


