 Types of housing Types of housing
According to the Istat census of the population and housing carried out in 2001, in Veneto there were 2,016,082 homes, 14.8% of which were not inhabited. An estimate for 2007 then put real estate at 2,212,069 units (Note 1).
Most families (56%), and people in families (60%), live in villas, detached or semi-detached houses; these types of houses provide families with maximum freedom and privacy. Those who live in flats tend to live in smaller apartment buildings, with fewer than 10 apartments in them. On a national level, on the contrary, living in flats is more common, with 53% of families and 52% of people doing so. These are distributed fairly evenly between small and medium-large apartment buildings.
The average number of people per home in families living in detached or semi-detached houses is slightly higher in Veneto (2.6 and 2.7 respectively) than in Italy overall (2.5 and 2.6 respectively). The opposite is true for families who live in flats (Table 1.2.1).
Real estate available to families in Veneto is less dated than in Italy overall: 68% of houses in use were built within the last 50 years, whereas for Italy this percentage goes down to 64%. The most common houses being lived in are those built in 1990 and after: 21% of families live in this type of home; this is six percentage points higher than the national figure. From 2000 onwards, the trend moved towards living in flats as opposed to detached or semi-detached houses.
The building boom for the houses currently lived in by families happened during the 1960s and 1970s: in Veneto this meant 31,577 units were built per year on average during the 1960s and 37,713 in the 1970s (Table 1.2.2).
As for the number of years spent living in their current homes (in 2007), families in Veneto are distributed much along the same lines as in Italy overall; the average length of stay is 20 years, and 43% of families have lived in their current home for 20 years or longer (Italian figure: 45%).
An estimate of the average annual turnover index, based on mobility figures for the last two years, shows that 4.6% of families per year on average move house (4% in Italy). Moving house is mainly motivated by family reasons (46%), followed by reasons linked to living conditions and to work (Figure 1.2.1).
 Structural conditions of housing Structural conditions of housing
Living somewhere which is suitable to one's needs, which is spacious enough, comfortable and equipped with the necessary utilities contributes to improving quality of life. The home is the place where people spend most of their time on a daily basis, it is the focus point of family life and also of relationships with friends, relatives and neighbours; in a wider sense it is also essential to guaranteeing social inclusion. Having one's own home, and feeling happy in it, creates a feeling of safety, stability and even mental well-being.
Living conditions are important in terms of health as well; damp, mould, damaged buildings, small or dimly lit spaces and lack of suitable bathroom facilities can all cause problems and illnesses to the detriment of the well-being of the person living in these conditions.
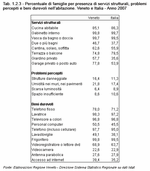
Veneto is in a good situation in terms of the structural conditions of housing. A lack of basic facilities, such as an indoor toilet, bathtub or shower, affects a ridiculously small number of families. Taking a look at facilities of a slightly higher level, i.e. those which are not strictly essential but which increase families' comfort, many people have a separate kitchen, and a fair number of families also have an extra space, such as a cellar or an attic, or have more than one bathroom. The percentage of those who have a garage or a parking space and a private garden is much higher than in Italy in general; this is undoubtedly linked to the fact that in Veneto families tend to live mainly in villas or in detached or semi-detached houses. Furthermore, 65% of families claim they have at least four out of the six higher level facilities mentioned.
There are few cases of problems regarding utilities and their suitability, safety and functioning. In 85% of cases, families can count on having a suitable electrical system, 81% on plumbing and 79% on heating; almost everyone has hot water and 58% have no problems with utilities at all.
Only a small percentage say they live in too small or dimly lit places, and this figure is lower than on a national scale too. However, more families in Veneto do complain of certain serious problems such as damp or structural damage, even though, in reality, houses are better off from a structural point of view. It is worth bearing in mind that these are people's opinions and the discrepancy between the actual situation and people's perception of it is linked to the social and cultural context in which the families find themselves and to their own expectations.
The presence in the house of durable goods can also contribute to determining a family's standard of living, allowing people to live in a certain degree of comfort. Almost all the families in Veneto and in Italy have a washing machine, fridge, television and telephone, as these are now extremely well-established basic consumer goods. Now that technology is more widespread and the average cost of certain products has fallen, DVD or video players, computers and internet access are fairly common. Furthermore, not owning these goods often is not due purely to finances, or at least the families didn't give this as their main reason, but it is more due to a personal choice as these are not seen as essential items (Table 1.2.3).
In order to facilitate a better understanding of the information given, summary indicators on the aspects looked at so far are provided. These aid in determining the quality of the housing, i.e. the availability of structural facilities, perceived problems, the adequacy of utilities, essential goods (Note 2) and the presence or otherwise of other goods. Each indicator has a value of between 0 and 100, where 0 means low quality and 100 high quality. There is also a sixth indicator, with again a value ranging from 0 to 100, which summarises the overall quality of the structural features of the housing, and which is calculated from the average of the five previous indicators. The summary indicators are useful above all in order to compare families of different types and to compare Veneto with other Italian regions.
The overall indicator for Veneto gives a score of 83 out of 100, which confirms that overall living conditions are good, as the five indicators used to give this overall indicator all generally give medium-high scores in all the subcategories. It is mainly the indicators on the ownership of essential goods, on the adequacy of utilities and on problems perceived which have the highest scores (around 90 out of 100); the indicator on ownership of extra non-essential goods is lower (74 out of 100) and the one on structural facilities is lower again (67 out of 100).
A more detailed analysis provides an insight into whether there are differences between the families according to their financial standing or their size, between those who own or rent their houses, who live in more or less urbanised areas, or in older or more recent buildings.
The situation for those families renting a house or on a low income is very different to the regional average (Note 3). Families renting give an overall indicator of 76/100 and live in houses with fewer structural facilities, with more problems (perceived) in terms of space, structural damage, damp and light and with fewer non-essential goods; the houses are well-off in terms of utilities however. Families with an annual income of less than 16,000 euro have the same problems (the overall indicator for this group stands at 78/100); on the other hand, they also tend to live mainly in rented houses. Instead for those families who live in slightly older houses, i.e. those built before 1980, and in more densely populated areas, their standard of living is in line with the regional average (Table 1.2.4).
A comparison between Italian regions shows that Veneto is in a good position, similar to its neighbouring regions, Lombardia, Friuli Venezia Giulia and Emilia Romagna, and above the national average. Only Valle d'Aosta and Trentino Alto Adige have higher figures than Veneto, and the southern regions come in at the bottom of the list (with scores of between 72 and 76 out of 100); this is above all because homes there have fewer structural facilities, non-essential goods and adequate utilities.
Although Italy has a higher figure than Veneto for the indicator on perceived quality in housing, this is down to the two areas having different needs and expectations (Figure 1.2.2).
 Overcrowding Overcrowding
A comfortable amount of space is an important aspect of quality of living conditions. It is defined as the relationship between size (metres squared or number of rooms) and number of family members and type of family. Problems can arise if families have to live in a small space, in a place which is not big enough to accomodate the number of people living there, as this can lead to a lack of privacy or of freedom.
There has been a lot of research on problems caused by lack of space, not only because it can lower living conditions, but also because of the possible negative effects it can have on people's health and physical and mental well-being. When overcrowding occurs it can be difficult to maintain standards of hygiene and it can increase the risk of spreading illnesses, above all respiratory illnesses and infections, and of domestic accidents. Excessive overcrowding can lead to stress and exacerbate tensions within the family, with possible negative effects, especially for children, on behaviour and learning.
Furthermore, in a country like Italy, where family units tend to be getting smaller, overcrowded living conditions seem to have a closer link with poverty. For this reason it is considered as an important measure of poor living conditions and, on a more general level, of a family's degree of poverty (Note 4).
An initial measure of overcrowding, used on a European level, is calculated from the relationship between the number of family members and the number of rooms in the home: a home is deemed adequate if each member of the family group has at least one room to spend time alone in order to have a certain degree of privacy; so if the average number of people per room is higher than one, the home is considered overcrowded. For EU27, the indicator equals 0.6 and homes in Eastern European countries tend to be more overcrowded, in particular in Latvia and Romania, whereas Belgium appears to be in the best position with 0.5 people per room. Compared to the European average, overcrowding is a little more common in Veneto, but still less so than in Italy overall, with an average of 0.7 people per room compared to the Italian 0.8 (Figure 1.2.3).
The relationship between the surface area of the home and the number of family members is also another way to measure overcrowding. This approach, as opposed to the first, gives importance to the comfort, in terms of space, in which the family lives, rather than the chance to have a private space within it. In Veneto this becomes 54 mē on average per person, compared to 49 mē on an Italian scale. This confirms the difference previously noted. This is one of the highest figures of all Italian regions; only Friuli Venezia Giulia, Emilia Romagna and Molise are slightly ahead. In southern regions homes tend to be smaller, especially in Basilicata and Campania, where each person has an average of 43 mē (Figure 1.2.4).
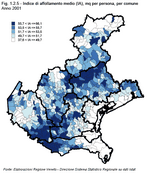
In the region, (Note 5), as can be seen from the map of municipal figures for this indicator based on the 2001 census, homes tend to be smaller in most of the small and medium municipalities: on average the buildings are newer and the municipalities themselves are comparatively new; in these municipalities the population has also increased greatly recently, precisely because they offer more favourable and more accessible living conditions, especially for young couples or bigger families.
In the capital municipalities on the other hand, the homes are bigger, either because they are more prestigious or because they were built at a time when the distribution and availability of space for housing was seen differently to how it is now. In addition, a lot of young people have left the city centres to live in the suburbs, leaving their elderly parents behind in spacious homes which are too big for them. This abandoning of the city centres and, at the same time, the increase in the numbers of "city users", people who make use of the facilities and opportunities available in the cities but who don't live there, is changing the face of urban centres with serious consequences for mobility infrastructures. In this respect, the question of housing becomes one of the main factors in terms of bringing life back to the cities.
In the provinces of Treviso and Padova, homes on average are bigger, at 54 mē and 53 mē per person respectively. Venezia is quite unique as its homes tend to be smaller and more overcrowded than in the rest of the region, with around 48 mē per person. In the other provinces, the situation does not differ greatly from the regional average (51.8 mē in 2001) (Figure 1.2.5).
Both of the above indicators are easy to grasp, however they give fairly rough measures of overcrowding as a family's need for space does not grow proportionally to the number of family members. Therefore, it is also worth looking at more refined measures which take into account family size, as well as other characteristics of the family members, such as gender and age. For example, the method Eurostat uses states, amongst other things, that each person over the age of 18 must have their own bedroom, and that two people of different genders can only share a room up to the age of 12.
Through this, thresholds are defined which identify the minimum amounts of living space, meaning that families living below this standard, i.e. who are living in overcrowded and therefore difficult conditions, can be identified.
Below we will refer to the method used by the Investigatory Commission on Poverty and Marginalisation, under the Presidency of the Council of Ministers, in a 1997 study which defines different thresholds depending on the number of family members (Note 6). Through this method, it emerges that 6% of families in Veneto (around 122,700 families) are living in overcrowded conditions, and 32% in normal conditions. Instead, 62% live in homes which are underused, meaning that they have more space than is deemed necessary for normal needs. The problem of overcrowding in Veneto is less serious than in Italy overall, where 11% of families suffer from it.
The absolute value of the data should not be taken into consideration since the thresholds given are fairly arbitrary (Note 7), but it is useful in order to see how the problem is distributed and to make comparisons between families of different types. In particular we can see that overcrowding increases as the number of family members increases, especially if there are four or more people in the family. For families with up to two people in them, homes tend to be underused (70% as opposed to 62%); this is probably a result of elderly people living alone or with a partner in large, yet often badly maintained, houses.
Overcrowding is also more common amongst low-income and families renting property, where it affects 12% of families. These are fairly predictable results in as far as families that rent tend to have a lower income compared to those who own their own property, and fewer available funds mean that available housing tends to be smaller and contain fewer facilities (Table 1.2.5).
 Accessibility and sustainability of housing Accessibility and sustainability of housing
Occupancy status
In Italy, more so than in other European countries, the cult of owning one's own home prevails: buying a home is seen as an important, almost essential, milestone. It represents a large financial commitment, but it is a step people are willing to take as it is considered a good investment and, more than anything, a guarantee, for the present and for the future. Living in your own home increases the sense of security, especially amongst elderly people. Besides this, if the home is your own and not rented, then you are more likely to take good care of it, to make improvements, to make it more attractive and more comfortable and to adapt it to your needs.
On the other hand, Italian housing policies have always pushed towards owning property and have not encouraged renting; this started after the Second World War when support for buying a home was justified with the idea of encouraging savings and moving out of poor housing. In the last few years, the state of the housing market, with its ridiculous rises in rents and prices of accommodation, together with reductions in interest rates, have pushed families more and more into buying their own homes, even if that means getting into quite serious debt for many years.
These particular conditions have brought Italy to the point where 81.5% of families live in homes that they own (Note 8); this is higher than in any other Western European country, except for Spain and Portugal. In EU15, an average of 71.5% of families own their home; in EU27 countries this figure increases to 76% as this also takes into account Eastern European countries where massive privatisation of public housing, which started in the 1990s, has resulted in high numbers of home-owners; however, in most cases the quality of this housing is very low (Figure 1.2.6).
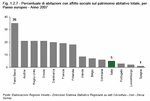
Differences between Italy and other countries in Western Europe are also due to the different policies on housing adopted in the different countries, and above all to the role that the public sector plays in giving incentives towards housing with affordable rates or other forms of social housing. For example, in the Netherlands rented council houses make up 35% of total real estate and 77% of rented houses. In the United Kingdom, Sweden, Austria, Denmark and France, percentages of council houses are lower but still stand at around 20% of real estate; in Italy, on the other hand, public social housing is limited to around 5% only (Figure 1.2.7).
The difficulty faced in getting onto the renting market, both because of the lack of offer and because of the high costs, has various negative consequences. It is mostly the weaker members of society who end up being penalised: the young, the elderly, single-income families, immigrants, workers on temporary contracts, generally those families of limited financial means who cannot take out mortgages as they do not have the guarantees and so who find themselves paying rents which are too high for their finances; at the same time, even though they have a hard time accessing the housing market, their income is not low enough as to give them a place in social housing schemes. The situation has undoubtedly got worse in the last few years, as housing prices have shot up without there having been a proportional increase in salaries.
The question of housing is also one of the main reasons that Italian youth decide to continue living with their parents for longer than their European peers, postponing the creation of their own independent lives and a family of their own.
Furthermore, the fact that so many people own their own homes does not make moving house easier and so has a negative effect on people's and worker's mobility. This has a negative consequence for the job market, which would benefit from more flexibility in this respect. University students wanting to attend a university outside of their hometown have also felt the effects as finding reasonably priced accommodation is difficult, especially in the big cities, and so it can stop students from deciding to go to university, or to the university of their choice. The risk is that this situation foments the market for undeclared rents.
Owning property is quite widespread in Veneto, as 74% of families do so compared to the Italian figure of 68% (Note 9). Another 15% rent their homes, and the remaining 11% fall into other categories: tenancy, free use or improvised dwellings.
In Veneto too, the majority of those who rent are people who live alone and those who live in densely populated areas. At times renting can provide an easier alternative to buying a house or a temporary solution, especially in some periods of life when people are starting out on their careers and need to be able to move around more easily. According to a survey on families renting property carried out on a national scale by Censis-Sunia-CGIL in 2007, however, most people who rent (66%) do not do so out of choice but out of necessity as they do not have the means to buy property. Owning a home is strictly linked to a family's financial situation, as amongst low-income families, i.e. those who earn less than 16,000 euro on average per year, the percentage of home-owners drops to 57% and renters increases to 31% (Table 1.2.6).
Sustainability of housing
For years in Italy, the question of housing was not given the correct amount of attention as it was believed to affect only a marginal share of the population, seeing as such a large number of families owned their own property. From the second half of the 1990s, the enormous rise in house prices, new demand for housing created by the influx of immigrants and by the increase in the number of families, and the increase in debt and poverty within certain sections of the population, made worse by the financial crisis, brought to light the need for intervention and new policies to deal with the problem of housing and people living in difficult situations.
Besides those people who live in extremely difficult conditions, such as the homeless or squatters finding shelter where they can, housing problems can also affect a large number of families who, even if they have a fairly stable income and living conditions, are not able to keep up with the housing market, to rent or buy a home to suit their needs at an affordable price, or to keep up with all the costs involved, and therefore to maintain an acceptable standard of living.
To this regard, financial accessibility and sustainability of housing (affordability) become an extremely important feature of standard of living.
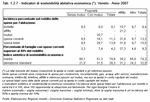
Total spending on housing makes up one of the main items of a family's household budget: on average a family in Veneto spends 400 euro a month on bills, rent or a mortgage; this equates to 15.5% of their income (Note 10).
Obviously, there are clear differences in spending depending on occupancy status. Owning your own house and not having to pay a mortgage is the ideal condition, providing the most security; for these families, spending is basically limited to paying for utilities and regular maintenance, which account for 9.5% of income (around 250 euro).
Instead, 16.5% of families have taken out a mortgage in order to buy their home; this is just over one-fifth of home-owners. Mortgage repayments stand at around 600 euro per month, and take up an average 20.7% of a family's finances. Rent accounts for 21.2%, but the average monthly payments are just over 400 euro, which shows that families who rent tend to have a lower income and so the rent takes out a larger chunk of their income.
If we add this to the amount spent on bills, the percentage of family income spent on the home goes up to 28.7% (around 880 euro) for families with a mortgage, and to 31.9% (around 580 euro) for families renting (Table 1.2.7).
Problems with housing for financial reasons affect renters more than home-owners, even those who are paying off a mortgage. In Europe the indicator used to evaluate the financial sustainability of housing is calculated from the percentage of families who spend less than 40% of their income on their home: anything above this amount is seen as excessive, too difficult to maintain over time. In Veneto, 37% of families renting homes are in difficult situations, having to spend over 40% of their disposable income on their homes. Buying a home can also put too much strain on a family's finances, as it requires quite a large investment. In 25% of cases, families paying a mortgage claimed that their spending was above the sustainability threshold; this is twelve percentage points lower than for families renting their homes. If paying back the money in the installments required by the terms of the mortgage is seen as an investment towards creating property and not as simple outgoings, i.e. consumption, this percentage drops to 7.4%.
As well as looking at spending itself, it is also important to find out if families have trouble paying their rent, mortgage or bills on a regular basis, and how they view the costs generated by their homes, i.e. whether they see them as an excessive burden, a heavy and stressful commitment. As far as being behind with payments is concerned, the situation is particularly serious, compared to the regional average, for families paying rent and also for families paying back a mortgage. Overall, 5.5% of families say that they are behind with paying their bills, but this percentage hits 16% of families renting property and 9% of families paying a mortgage. Furthermore, 11.5% of families have difficulty paying their rent regularly and 5% find it hard to make their mortgage repayments. It is also clear that families paying rent have the most problems if we take a look at the number of families who find it difficult to pay both their rent and their bills: this is a problem for around 24,600 family groups in Veneto, constituting 8.4% of families who rent property.
Even if families manage to respect the due dates for payments, many of them still regard spending on the home as a problem and difficult to keep up with, especially those families renting property (Table 1.2.8).
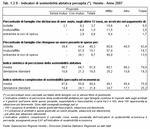
In order to make it easier to compare Veneto and Italy and to measure the differences between different types of families, the various features of sustainability of housing have been condensed into three indicators:
- the summary index of financial sustainability, an objective indicator which takes into account the extent of housing costs, how much they take out of income and whether the family is left with enough to spend on other things and to maintain a decent standard of living (Note 11);
- the summary index of perception of sustainability of housing, a subjective indicator which shows how families evaluate and judge the effort they have to make to pay housing costs (Note 12);
- the overall summary index of sustainability, given as the weighted average of the other two indicators, with financial sustainability providing a weightier share (Note 13).
All three indicators range from 0 to 100, where 100 is the most positive, i.e. indicating maximum sustainability.
Compared to the situation in Italy, there are not any major differences with overall sustainability and with its two components: financial and perceived sustainability. The average score for the overall indicator in Veneto equals 75.9 out of 100 and in Italy is 76.1. If we take this as an index of intensity of suffering, we could also say that 24.1% of families in Veneto, or 23.9% of families in Italy, are suffering enormously.
For families renting property, sustaining housing is a serious problem and here the overall indicator drops to 46.1. Of those who own property, there is a clear difference between those paying a mortgage and those who do not: for the former the overall indicator equals 55.8, for the latter there is a great improvement, up to 87.6.
Naturally, sustainability is influenced greatly by a family's financial means, for the less well-off families the average score is 58.4.
We can also see that the objective indicators on sustainability of housing differ greatly between the different types of families, the subjective indicator on the burden housing signifies less so (Table 1.2.9).
 The area lived in and access to facilities The area lived in and access to facilities
The structural and functional conditions of the building and the sustainability of its ownership certainly have an influence on a family's experience of standard of living. But the external environment also plays a considerable part. Here it has been divided into four groups of factors and their relative problems:
- ecology of local area (dirty streets, air pollution, noise, unpleasant smells, lack of green areas, etc.);
- mobility (parking problems, traffic, lack of adequate street-lighting, bad road conditions, bad link-ups with public transport);
- crime;
- access to essential facilities (shops, banks, post offices, public transport, health services, chemists, schools, sport centres, gyms, swimming pools, etc.).
As regards the question of ecology, in Veneto the problems most people perceive as "very or somewhat relevant" to the area they live in are air pollution (47% of families) and traffic (45%). Bad road conditions (43%) and problems parking (30%) are the most complained of problems in terms of mobility, as well as problems with link-ups to public transport (28%) (Table 1.2.10).
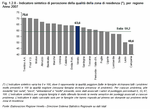
A summary indicator was created based on the statements made by families regarding ten problems covering the previously mentioned groups. This indicator ranges from 0 (extremely bad quality, all of the families state all the problems as very relevant to their area) to 100 (extremely good quality, none of the families state these problems as relevant to them), proportionally to the occurrence and to the intensity of the problems (Note 14). For Veneto the score for this is 64 out of 100 (Italy = 59). A comparison with Italy puts Veneto in a better position with regards to all of the problems except for air pollution. Compared to its neighbouring regions, Veneto is on a similar level to Emilia Romagna, in a better position than Lombardia, and worse off than the two regions with political autonomy: Friuli Venezia Giulia and Trentino Alto Adige (Figure 1.2.8).
Access to essential facilities also plays an important role in determining a family's standard of living. The share of families in Veneto who say that they are able to easily, or very easily, access the eight types of facilities under consideration ranges from the lowest share at 73% for sports centres, gyms, swimming pools (Italy = 67%) to the highest at 83% (Italy = 78%) for schools. The figures for Veneto, calculated in terms of the families who require those facilities, are higher than the national average in all instances (Table 1.2.11).
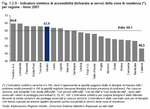
A summary indicator of level of quality has been calculated to give an overall view of the access to local facilities perceived by families. This indicator ranges from 0 (extremely bad quality, all of the families claim they have problems accessing all of the facilities) to 100 (all of the families claim they have no problems accessing any of the facilities) (Note 15). The figure for Veneto (63 out of 100) puts it in sixth place out of all the Italian regions (the Italian average is 60 points) (Figure 1.2.9).
 Satisfaction with living conditions Satisfaction with living conditions
In terms of overall perceived quality, taking into account all of the internal and external factors to housing, 86% of families in Veneto say that they are satisfied or very satisfied with their homes. Veneto stands halfway in the Italian regional rankings in this respect, somewhere between the highest figure given to Valle d'Aosta (93%) and the lowest figure for Campania (76%). The national average was very close to the figure for Veneto (84.5%) (Figure 1.2.10).
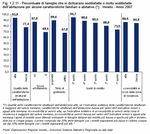
Satisfaction with standard of living is mainly influenced by objective aspects of the dwelling. Almost all of the families (94%) who live in places which are better off in terms of structure, access to facilities, with adequate utilities, with fewer problems with damp or lack of light, say that they are satisfied with their living conditions; the figure goes down to 77% for those who live in houses which are structurally worse off. Naturally having more space also provides more satisfaction.
There is also a difference in satisfaction levels between renters and home-owners, as has already been seen more than once through the individual aspects of standard of living. In 90% of cases, home-owners claim a high level of overall satisfaction, compared to 68% of renters. On the other hand, people who are able to buy their own property tend to have better financial means and can afford better housing, and they are also more likely to keep their home in good condition and, where possible, make improvements or adapt it better to their own personal needs (Figure 1.2.11).
|
| Table 1.2.1 |
 |
| Table 1.2.2 |
 |
| Figure 1.2.1 |
 |
| Table 1.2.3 |
 |
| Table 1.2.4 |
 |
| Figure 1.2.2 |
 |
| Figure 1.2.3 |
 |
| Figure 1.2.4 |
 |
| Figure 1.2.5 |
 |
| Table 1.2.5 |
 |
| Figure 1.2.6 |
 |
| Figure 1.2.7 |
 |
| Table 1.2.6 |
 |
| Table 1.2.7 |
 |
| Table 1.2.8 |
 |
| Table 1.2.9 |
 |
| Table 1.2.10 |
 |
| Figure 1.2.8 |
 |
| Table 1.2.11 |
 |
| Figure 1.2.9 |
 |
| Figure 1.2.10 |
 |
| Figure 1.2.11 |
 |
|


