Agriculture weaves a strong, dense web of relationships with its surroundings, not only in environmental terms, with inevitable repercussions on ecological sustainability.
It also plays a major role in other areas: landscape-think of Verona's rice farms, or the vineyards in Treviso's hills; culture, with its educational farms that hand down timeless knowledge of the land; economics and tourism, with its wine and typical-product roads; and safeguarding and protecting the countryside, with its reclaimed areas that have been made productive.
If we look at ecological sustainability within Veneto, we see that the Rural Development Plan (PSR) and joining of EU programmes have enabled Veneto agriculture to gear its efforts towards the introduction of measures that reduce pressure on the soil, thus protecting its chemical, physical and biological properties.
The use of fertilisers
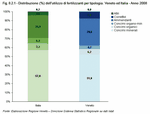
Every year, Istat carries out a survey on the use of fertilisers for farming purposes among the companies in Italy that distribute them: in 2008, 49 million tonnes of fertilisers were distributed, a fall on the previous year of 9.8% and the lowest quantity recorded since 2003
(Figure 8.2.1).
Mineral fertilisers, which are used to nourish plants, may damage the soil, pollute water resources and cause instability in water eco-systems (euthrophication and loss of biodiversity). These fertilisers are the ones most commonly used, but they are also the ones whose use has fallen the most over the previous five years (-21%), followed by organo-mineral fertilisers (-13%). There has, however, been a rise in the use of amendments (+27%) and correctors, which have a reduced content of nutrients; this means they can be used in doses that increase and maintain the organic fertility of the soil, and thus respect the environment. These figures confirm the trend towards more eco-compatible farming, a move supported by EU programmes.
It is also confirmed by analysis of the fertilisers allowed in organic farming which, over the last five years, have increased by more than 80%, with the use of compost increasing by almost 20%.
Veneto proves that it is ahead of the times as the use of mineral fertilisers has been below the Italian average since 2003; during the last year for which figures are available, mineral fertilisers accounted for 52% of the total fertilisers used in Veneto, compared to an Italian figure of 57%. Likewise the use of amendments was 30% in Veneto compared with 25% in Italy.
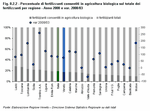
In Veneto in 2008, fertilisers allowed by organic farming made up more than one-fifth of the total fertilisers used throughout the region, an increase of more than 70% on the previous five years
(Figure 8.2.2).
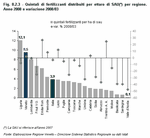
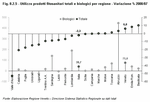
The amount of fertilisers used per hectare of Utilised Agricultural Area (UAA) shows that the regions in northern Italy, an area of traditionally intensive arable farming, recorded the highest levels, although there was a general fall over the last five years (Italian average: -3.2%)
(Figure 8.2.3).
The use of phytosanitary products
Istat carries out a survey on the use of phytosanitary products among all of the companies that distribute them in Italy.
These products include fungicides, herbicides, insecticides and organic products; they contain active substances that are designed to protect plants and their produce from harmful organisms and to prevent damage by favouring or regulating the vital processes of the plant.
They are also used to conserve by-products, kill undesired plants and slow or prevent unwanted growth.
The use of these products across a territory is directly proportional to the goodness and quality of its food and water and to the level of protection afforded to the environment, which are the reasons behind this report.
As mentioned, recent trends in farming and in EU policy have leaned towards not increasing the amounts of phytosanitary products distributed and used in crop-growing; instead priority has been given to protecting plants with integrated pest management and biological pest control and to maintaining the natural qualities of farming produce.
This trend is being followed throughout Italy where there has been a general fall in the use of phytosanitary products: between 2003 and 2008, there was a drop of more than 5% (-2.3% on 2007 alone).
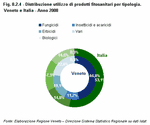
All of the most used phytosanitary products (fungicides, herbicides and insecticides) recorded a fall in the last five years; although organic phytosanitary products have experienced a net rise (+54% since 2003 and +39% on 2007), they account for a minor share of the total
(Figure 8.2.4).
Veneto, however, does not mirror the national picture on account of the type of crops it grows: the majority of Veneto UAA is devoted to corn, wheat and vines, which are the crops that most require phytosanitary products.
Looking at figures for 2007 and 2008, we can see that Veneto underwent an increase in the UAA devoted to durum and bread wheat (as did Emilia Romagna, which doubled its UAA of durum wheat and recorded a similar growth in the use of phytosanitary products); therefore Veneto's 6% rise in the use of phytosanitary products seems justifiable
(Figure 8.2.5).
In comparison to Italy, Veneto more than doubled its use of organic phytosanitary products (+75%).


