In the last year, Italian enterprises were affected by instability in international markets, which worsened the economic outlook, leading consequently to a fall in orders, production and, consequently, in turnover. There were some effects on the rate of start-up/failure of Italian firms, leading to a negative change in the total active businesses compared to the previous year, but it is still too early to measure the true impact of the crisis on the demography of the Italian production system. Therefore, after many years in which Italian firms continued to grow in number with a more or less consistent annual rate, for the first time in 2009 the growth trend in the number of active businesses came to an end and recorded a slight fall in number, -0.6% compared to the previous year. The resistance of the Italian entrepreneurial system should be underlined, however, as it was able to react to the uncertainty of the market with a business population balance equal to the previous year and a failure rate lower than that of the previous two years.
The analysis of the start-up/failure rate of firms in Italy recorded a business population balance
(Note 1) slightly below zero, i.e. -0.4%. In brief the start-up rate
(Note 2) was just under the failure rate
(Note 3); 31.2% of the failures were in the artisan sector, the one most immediately involved.
Behind Italy's negative business population balance is on the one hand an increase in the number of corporations, +2.9% compared to 2008, and on the other a crisis that seemed to increase the already growing difficulties of the smallest firms, especially sole traders, who in the last year decreased by over 50 firms, a negative change of 1.6% compared to the previous year.
By sector, in Italy, the dominance of service businesses increased; it was the only economic macro sector to grow in number in the last year. In 2009 the sectors of personal services (healthcare +4.3%, education +3.3%, other personal and social services +1.8%), business services (+1.6%) and hotel and catering services (+1.8%) continued to grow. Trade and transport were the only tertiary sectors in Italy to decline in 2009, with variations of -0.4% and -1.9% compared to the previous year respectively. The recession was felt most in both the primary sector and the industrial sector with a change in the number of active businesses of -2.4% and -0.9% respectively compared to the preceding year; in 2009 the energy sector grew by nearly 10%, but could not in absolute numbers fully compensate for the slight decline in housing (-0.2%) and, especially, the decline in Italian manufacturing, whose number of active businesses fell by 1.7% in the last year.
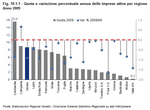
The regions which saw an increase in the number of businesses in this period were truly rare; it is enough to say that Campania was the only Italian region to record growth in the number of active businesses for the year. The regions that were affected least by the general decline, in particular, were Abruzzo, Umbria, Liguria, Toscana and Calabria. In 2008, the largest declines in active businesses concerned Friuli Venezia Giulia, Sicilia, Valle d'Aosta and Puglia: -1.6%, -1.5%, -1.4% and -1.1% respectively. The other regions had a trend that was near the national average.
(Figure 10.1.1)
In 2009, business population development in Veneto concluded with 458,352 active businesses at the end of the year, -0.9% compared to the number of the year before, -0.4% if the agricultural sector is excluded. The balance for Veneto at the end of 2009 was negative, -0.78%, because the business start-up rate was less than the failure rate. In Veneto, as was recorded on a national level, the balance remained more or less stable compared to the previous year and the failure rate decreased compared to 2008, coming to rest at 7.4% (7.8% in 2008). The global business population shows lower rates: both the start-up rate and the failure rate fell compared to the previous year, a coincidence that leads us to conclude that there was less vitality in business activity throughout the last year. Veneto's active business continued to make up 8.7% of the national total, ranking third together with Lazio in the regional rankings.
The difficulties of the downturn enhanced the decrease in the number of sole traders (-1.7% for the year), which still at the end of 2009 made up 59.9% of the entrepreneurs in Veneto; while the vitality of companies held up and during 2009 grew by 2.2% on the previous year
(Figure 10.1.2).
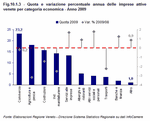
Among the sectors that felt the effects of market stagnation the most were two of the most important in Veneto's production system: manufacturing and the primary sector. The active businesses in these sectors decreased over the course of 2009 by 2.5% and 3.2% respectively. A negative variation was also recorded for the construction sector, that in one year saw a decline of 1.4% in its active businesses. The true locomotive of Veneto's economy was without a doubt the tertiary sector, whose active businesses grew by 0.5% in 2009; in particular, growth occurred in business and personal services (+1.7% for the business services, +1.4% for education, +6.2% for healthcare and +1.8% for other social and personal services), but also in financial intermediation, 1.2%, and in hotels and catering, +0.9%. Alongside a substantially stable trade sector, -0.2%, transport was one of the sectors that felt the lack of consumer confidence most and the only category of the tertiary sector to have faced greater problems in 2009 in the number of active businesses, which saw a decrease of 2.2% compared to the previous year.
In 2009 the share of businesses in services in Veneto was nearly 52% of the total: this process, already underway for several years, continued to skew Veneto's economy toward the tertiary sector, a structural transformation also seen in the continuous growth of its relative share of value added in Veneto's total economy, which surpassed 63% of total production in 2008.
(Figure 10.1.3) and
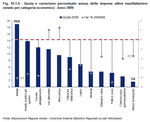
(Figure 10.1.4)
Within Veneto's manufacturing industry, there are two sectors that in 2009 experienced increases, both important in terms of their share of total manufacturing: mechanical businesses grew in the last year, as did the food industry, increasing by 1.3% and 1.4% respectively compared to the previous year.
Other important sectors of Veneto's economy experienced declines: the metal industry, -4.1%, and the fashion sector, which ended 2009 with an average annual decrease of 4.5% in hide- and leather-working businesses, and -3.8% for enterprises in textiles and clothing. The wood industry recorded a decrease of 2.7% compared to the preceding year and the sectors of furniture, jewellery and sporting equipment, optics-electronics and minerals all declined by more than three percentage points.
The slump was less severe for several less important sectors of Veneto industry, i.e. the sectors of chemicals, coke, rubber and plastics, of production of means of transport and of printing and paper.
The trend in the number of businesses at provincial level saw the provinces of Verona, Padova and Vicenza fall less than the regional average, by -0.5%, -0.6% and -0.8% respectively, reaffirming thus the vigour and stability of the central band of the region in its economic entrepreneurship. The other four provinces felt the effects of the recession more, especially the province of Venezia, which, in the last year, recorded a decline in the number of active businesses of 1.6%, attributable primarily to the primary sector and industry.
(Figure 10.1.5).
Artisan industries, after years of rather consistent growth through to 2007, in 2009 saw a clear worsening of the problems that had begun in 2008: there were 143,330 active artisan businesses last December 31st, -2.2% compared to the previous year. The underperforming trend of the sectors with the largest shares of artisans led to the negative aggregate figure of the last year: the Veneto artisan furniture sector, which accounts for more than 40% of the artisan firms in the region, decreased over the last year by 2.4%; at the same time artisan manufacturing, a sector that makes up more than 30% of the artisans in Veneto, suffered a decrease of 3.1%. Sectors like business and personal services, instead, recorded an increase last year of +1.9% and +0.5% respectively, alongside the primary sector, which grew by 2.4% over the same period. Overall the decline, which was due to the slump in activity of the sectors most exposed to the recession, mainly manufacturing, came during a negative year throughout the nation; on average manufacturing fell by 1.4% in Italy and by 2.0% in the North-East, an area in which artisan manufacturing has a strong presence.
(Table 10.1.1).
The difficulties of enterprises, which in the last year and a half have seen a decline in orders and turnover, have been aggravated both by the slowness of payments by creditors and by ever more difficult conditions in the credit market. Indeed, despite the measures of financial support provided by the central banks after the crisis began, the gap between the interest on loans paid by firms and the Euribor, the benchmark interest rate for interbank loans, seems to have increased. The Met study carried out on firms in Veneto in the summer of 2009 revealed that about one entrepreneur in three thought that the international economic crisis had a strong impact on relationships with the banks, both because of the increase in interest rates, but even more so because of the conditions for obtaining loans or, in other words, a reduction in the line of credit available.
The impact of the crisis on the turnover of Veneto firms seems limited compared to national figures: in Veneto 16.9% of firms said that in 2009 their bottom line was in the red, while in Italy it was 19.2%; furthermore 53.8% in Veneto broke even compared to the previous year, while in Italy the share dropped to 44.5%. The entrepreneurs of Veneto furthermore had more confidence in the recovery than the national average: only 16.8% of predictions collected in Veneto expected a decline in turnover at the end of 2010, while in Italy expectations of a fall in turnover rose to 20.7%.
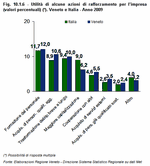
The economic difficulties facing entrepreneurs were also seen in findings on how often firms were making investments of various kinds, which decreased over the last year confirming the short-term difficulties; 36.7% of firms made tangible or intangible investments in 2009, while in the preceding three-year period the share was larger (43%). In 2009 the main financial channels used for this purpose were: first retained earning (69.7%), then short and medium-long term debt (9.4% and 11.2% respectively); principally investments were made to increase production capacity (15.8%), to improve the quality of products (14.3%) and to increase efficiency in order to reduce costs (6.7%).
The strategies adopted by firms that had market problems all went in the same direction: cost reduction. In 35% of cases, Veneto firms declared to have made cost cuts to deal with the problems caused by the economic slump. The strategies adopted are quite varied, at times going in opposite directions: 8.1% of the firms in Veneto intended or intend to undertake sales programmes to penetrate new markets, while 6.7% intend to reduce their international exposure in order to concentrate on national production. Furthermore the remedial policies held to be most useful by the entrepreneurs of Veneto concerned consolidating the firm's finances, in particular transforming short-term debt into long-term debt, as well as in training of current personnel and the hiring of additional qualified personnel.
(Figure 10.1.6).


