Over the last year, the number of active businesses in the trade sector in Veneto has been fairly stable, whereas Veneto's total number of active businesses lost one percentage point in the same period.
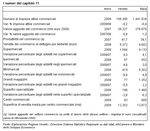
Veneto's retail trade has put up a fight in the last year: on 31 December 2009, there were 51,680 trade businesses with retail as their main activity, a slight increase on the previous year. Veneto's turnover did not show any major signs of fraying in 2008 and by the end of the year stood at more than 26 million euro. The moderate expansion of large-scale distribution continued, while small-sized stores remained in the negative; there was also a continued increase in the sales of food products, but a fall in the sales of non-food products.
Against this backdrop, large-scale distribution stores continued their positive trend, which was almost entirely due to the food sector. In 2008, Veneto had 1,228 outlets encompassing department stores, supermarkets and hypermarkets; hypermarkets showed the most lively growth rates. At the end of 2008, however, the number of department stores had fallen by almost four percentage points on the previous year, probably due to them having to compete with large specialised stores. One type of trade that experienced a sharp drop was Veneto's minimarkets. In 2009, the turnover of Veneto's Large-scale Organised Distribution (LOD) was stable on the previous year, a result that was achieved due to an increase in the Consumer Packaged Goods (CPG) sector and a fall in the non-food sector.
At the start of 2009, Veneto had 93 shopping centres, which covered a total area of more than 2.8 million m²; over the last few years, they have grown at a constant rate, both in terms of new centres opening and in the area covered.
(Chapter 11 in figures)


