The economic and financial crisis has weighed heavily on public finances, enterprises, the labour market and families, thus aggravating Europe's long-term social problems, such as the integration of an increasing migrant population and social exclusion, particularly among certain groups, against the wider backdrop of an ageing population.
 Women
Women
Analysis of labour supply by gender confirms the low level of female employment, although the growth in the employment rate in recent years has also been driven by women. The gap between male and female employment rates is still vast: in 2008 Italy's female employment rate was 47.2% compared with a male employment rate of 70.3%; furthermore, the female unemployment rate stands at 8.5%, three percentage points higher than the equivalent male rate.
The situation in Veneto is better as in 2008 it had a female employment rate of 55.5% compared to a male rate of 77%; this figure, however, is still some way off the female employment rate set at Lisbon in 2000, which envisaged 60% female employment by 2010. Veneto also performs better in terms of unemployment: with a rate of 5.2%, it lies fifth in the regional rankings for the lowest levels of female unemployment.
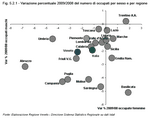
Looking at the most recent figures for 2009, however, on average female employment in Veneto fell more than male employment when compared with 2008: the number of employed men fell by 2.1%, the number of employed women fell by 2.4%. Abruzzo and Umbria are the regions with the sharpest drop in employed women, while Basilicata and Trentino Alto Adige saw their number of employed women increase by almost 2%. This figure for Basilicata is interesting as although it boasted the joint-highest increase in the number of women in the labour market, it recorded the sharpest fall in employed men in all of Italy's regions
(Figure 5.2.1).
Furthermore women make up the majority of Italian citizens living in Veneto who are put on a mobility list following an individual redundancy; over the years, however, the number of women being made redundant has fallen sharply, but the number of men being made redundant from small enterprises is increasing. In detail, 41.8% of the individual redundancies in the third quarter of 2009 in Veneto were women and 36.8% were men.
To sum up, it is true to say that the participation of women in the labour market is not only strictly correlated to their family situation, as it is often they who have to, or choose to, stay at home to take care of the children or elderly relatives, but they are also the ones who suffer most when the market finds the going tough.
 Foreign workers
There has also been a clear growth in the number of foreign workers on mobility lists. On average, in the first three quarters of 2009, foreign workers accounted for 13% of collective redundancies and almost 24% of individual ones.
According to Istat, the number of foreign job-seekers is increasing. Looking at the average for the first three quarters of 2009, in Veneto there were 28,000 foreign workers who were seeking a job, i.e. 26.7% of the total number of Veneto's unemployed and jobless, almost 65% more than the 2007 figure. Though the unemployment rate among foreign workers had fallen in previous years, it started to rise again, with the result that it was 8.9% in Veneto in 2008, 0.3 percentage points more than the previous year, compared with 2.9% among Italians.
The employment rate for foreign workers dropped from 69.6% in 2007 to 68.5% in 2008; it is the male employment rate that has fallen in particular as it fell from 88.2% in 2007 to 84.5% in 2008; however the female employment rate among foreign workers rose by more than two and a half percentage points during the same period.
 Young people
Compared to their peers in other countries, Italy's young people encounter work at a much later age and their knowledge is often of little good because they have no real contact with the labour market while they study. The difficult transition from education to work is one of the main problems in Italy. On the one hand, this transition often takes a long time, which fuels worrying levels of unemployment, on the other there is a high percentage of highly qualified workers in jobs that do not suit their skills. At a time as critical as the present, young people run an even greater risk of remaining without work for long periods; the solution is to introduce integrated and structured employment policies that cut waiting times, as well as ones that clarify and smooth the mechanisms that govern supply and demand, actions that will shorten the distance between student and business.
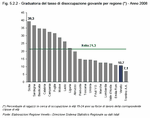
In Italy in 2008, the youth unemployment rate, which had fallen consistently in previous years, started to rise once again, recording a value of 21.3%; the situation in Veneto is better as it ranks second in Italy in terms of the lowest youth unemployment rate with fewer than 11 out of 100 people between 15 and 24 years of age in the corresponding workforce seeking employment; however, compared to the previous year, this figure rose by two percentage points.
Italy's southern regions still lag behind the others, while the best-performing region is Trentino Alto Adige (7.1%). Although youth unemployment had fallen over the years up to 2007, the few regions where this trend continued were Lombardia, Friuli Venezia Giulia and Puglia
(Figure 5.2.2).
 Ghosts: non-regular labour
The heightening of the crisis certainly does nothing to solve the age-old problem of non-regular labour; if anything it has almost served to legitimise it. Although the crisis has led to rising unemployment and difficulties finding a regular job, in this situation many people tend to prefer working cash-in-hand so that they can continue to claim social security.
The latest Istat figures for 2009 show that there are almost 3 million non-regular labour units in Italy; this means that Italy has a non-regular labour rate, i.e. non-regular workers out of the total number of workers, of 12.2%, down from 13.8% in 2001.
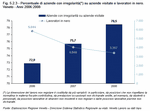
Although regional figures are not available for 2009, the year of the crisis, we will take a look at data processed by Veneto Lavoro resulting from inspections conducted by INPS, Italy's National Social Security Institute, between 2006 and 2008. Veneto has stood out for its lower-than-national-average levels of non-regular labour for a number of years, and it would seem that non-regular workers have dropped, despite an increase in the number of irregular businesses out of those inspected. In 2008, 78.5% of the businesses inspected had some form of irregularity
(Note 1) compared to 72.9% two years before; however although roughly the same number of businesses were inspected between 2006 and 2008, there was an almost 42% fall in the number of irregular workers discovered
(Figure 5.2.3).
The sector with the highest percentage of non-regular labour is trade, which accounted for more than 36% of irregular workers; trade was followed by industry (23.9%) and artisan businesses (21.8%). Furthermore, trade was also the sector that had the highest share of irregular businesses out of those inspected: more than 83% in 2008. Small enterprises make the most use of non-regular labour: 52.1% of non-regular workers discovered were foreigners, mainly non-EU citizens, while 2.6% were pensioners and 1.7% had two jobs.


