In 2009 international trade was hard hit by the economic and financial crisis which started in the third quarter of 2008. The crisis began with unprecedented turbulence which quickly turned into a serious economic recession. This in turn curbed consumption and reduced the global demand for goods.
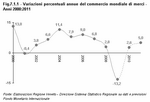
At global level, international trade fell by about 13 percentage points, a more serious contraction than in previous recessions (1990-1993 and 2001-2002) both in terms of turnover and of time to recover. The decreasing demand for goods concerned all industries. Less globalised sectors, such as traditional Italian goods, were not as adversely affected as the goods that normally drive demand. Intermediate goods were worst hit as they were also affected by the trend of commodity prices. Exports of consumer goods fell by about 10%, while sales of agricultural produce were not as adversely affected, which confirmed its countercyclical nature (Figure 7.1.1).
China overtook Germany to become the world export leader. Though its exports fell in 2009, they rose to 9% of world trade and projections for 2010 point to continuing growth. Development prospects for the other emerging economies are better overall. India's and Brazil's demand for foreign goods will considerably improve international trade. Impetus from Russia may fail as it will emerge from the crisis more sluggishly owing to the country's structural problems.
Italian exports will not recover straight away and only in 2011 will the country's trend patterns revert to levels close to 2007 and increase 5% in real terms. Italian exports will grow at a slower pace than global demand. Therefore, Italian export growth, which fluctuated in the 2000s, will further weaken, decreasing from 3.6% to 3.5%.
 The Italian situation The Italian situation
It should be emphasised that trade figures for 2009 are provisional and that definitive ones are published by Istat about a year after they are first released. Revision of data over the years suggests that differences between provisional and definitive data are well underestimated, especially with reference to Veneto's exports.
As the final figures for 2009 are not yet available, the figures for foreign trade published by Istat are accompanied by the year-on-year percentage variation, which is calculated by comparing the two sets of provisional data, in order to provide a more accurate forecast of the pattern of regional trade. From here on, quarterly and yearly cycle analysis will be carried out on the provisional data.
In 2009 the Italian trade balance was minus 4.1 billion euro, much lower than the approximate 13 billion euro trade deficit in 2008. After the 8.5 billion surplus of 2008, the trade balance with EU countries deteriorated again, to minus 1.8 billion euro. The trade balance with non-EU countries- a deficit of 2.3 billion euro-deteriorated too, but definitely improved compared to 2008, when the deficit was 21.5 billion euro.
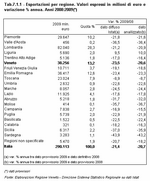
Italian exports declined on a yearly basis by 20.7%, in line with the trend of Italy's main trade partners (Germany -19.4%, France -22.2%) due to a reduction in exports both to EU and non-EU countries, down 18.1% and 22.5% respectively. With reference to individual export markets, there were significant declines in sales to Spain (-31%), Germany (-21.6%), United Kingdom (-22.6%), United States (-25.5%) and France (-18%). In the sectors contributing most to Italian exports, there were significant declines in foreign sales of machinery (-22-3%), fashion (-18.9%), vehicles (-2.6%), metal products (-28.6%) and chemicals (-19.3%). Exports were basically stable in the agricultural and food sectors (-3.5%), while they increased in the pharmaceutical sector (+2.4%).
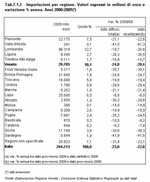
In the last year, Italian imports declined by 22% and there was a substantial decline in all the main sectors of economic activity, except for medical and dental supplies (+2.7%). Sharp declines concerned metal products (-44.3%), energy products (-34.7%), machinery (-29.4), electrical appliances (-17.8%), furniture (-15.2%), goldsmith products (-26.7%) and vehicles (-18.6%). There were milder than 10% declines in the agricultural and food product sector (-6.3%). In the sectors of greater importance for imports, the most significant declines in the EU were imports from Germany (-18.7%), France (-19.8%), United Kingdom (-18.7%), Netherlands (-18.2%) and Austria (-20.7%). As to non-EU countries (-26.9% as a whole), there were marked declines in imports from China (-18.3%), Turkey, Russia, Brazil and India (Table 7.1.1) and (Table 7.1.2).
In Italy there were declines in exports in all areas. Declines in the Italian islands (-38.6%), due to the significant reduction in foreign sales of refined oil products, and in Southern Italy (-22.9%) were over the national average. On the contrary, there were declines around the national average in the North-West (-20.1%) and North-East (-21.3%). In central Italy the decline in exports was 15.1%.
Based on quarterly data, trends in the business cycle exhibited positive variations in exports in all areas except for the Italian islands (-5.8%). The most significant increases were found in North-West Italy (+7.5%), in Central Italy (+6.9%) and in Southern Italy (+6.3%). Exports in North-East Italy are also recovering (+4%).
 In Veneto In Veneto
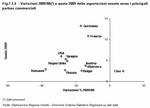
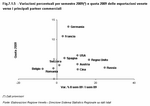
In 2009, Veneto was still the second Italian region for overall exports (38.3 million euro) equal to 13.2% of the national total. The cycle pattern in the last few quarters exhibited a significant contraction of regional exports in the first quarter, followed by moderate growth (+1.7%) in the second quarter compared to the first following a recovery in world trade; there was stability in the third quarter and 9.3% growth in the fourth. As to the cycle pattern in manufacturing sectors, the last few quarters in 2009 exhibited a growth in food (+15.5% between the first and second half-year 2009), metals (+8.7%), electrical appliances (+16.1%), electronics (+7.9%), chemical products (17.3%), vehicles (+4.3%) and stability in fashion and machinery. As to markets, in the second half-year 2009 there was a recovery in trade with the Russian market and the main European partners. Exports to the United States also increased. In the last quarter sales of Veneto products in the US market grew by 14.3% (+10.6% between the first and second half-year 2009) (Figure 7.1.2) and (Figure 7.1.3).
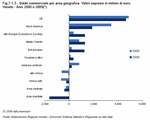
As the Veneto economy has closer ties with foreign markets, it is more susceptible to trends in world trade. This accounts for the major slowdown of exports in the last year. In 2009 Veneto suffered a 20.6% loss compared to the previous year, in line with national trends and patterns in other major Italian regions (Lombardy -20.9%, Emilia Romagna -23.3%, Piedmont -21.6%). The Veneto trade balance is still positive-over 8.5 billion euro in the last year-and shows highly positive values in the sectors of mechanical goods (+5.4 billion), other manufacturing products-furniture, jewellery, sportswear and medical supplies (+3.9 billion)-fashion (+2.1 billion) and electrical appliances (+1.9 billion), while the vehicles sector is deeply in the red (-3.9 billion). The trade balance by geographical area showed positive results both as to the EU (+4.6 billion) and non-EU countries (+3.9 billion). The deficit of trade with East Asia is still heavy (-1.6 billion) (Figure 7.1.4) and (Figure 7.1.5).
The geographic pattern of Veneto exports has slightly changed in favour of the EU27 area. This runs counter to trends in the previous years and accounts for 60% of exports, compared to 59.6% in the previous year. There was also an increase in exports to East Asia (from 6.1% in 2008 to 7% in 2009) and North Africa (from 2.5% to 3%).
The decline in Veneto exports originates from similar patterns in the main export areas. Direct flows to EU countries (-20%) declined significantly especially with reference to sales to the United Kingdom (-24.9%), Spain (-26%), Romania (-26.2%) and Poland (-28%). As to flows to non-EU countries (-21.5%), there were significant declines in exports, particularly to Russia (-37.7%), the United States (-28.5%) and Turkey (-27.1%). On the contrary, direct flows of exports to China rose considerably (+7.8%).
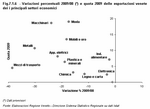
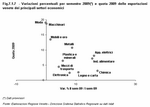
The general decline of exports to all markets is a consequence of the collapse of flows in the first quarter of 2009, which was only partly made up for in the following quarters. The strongest recovery in the second half-year concerned exports to Russia, China and the United Kingdom (Figure 7.1.6) and (Figure 7.1.7).
An analysis of the pattern of exports by economic sector shows that the decline in regional sales concerned most of the main industries with reductions over 20% in metal products (10.7% of regional exports), mechanical goods (18.6% of regional exports), electrical appliances (8.1% of regional exports) and vehicles. The sectors which suffered least as a consequence of the economic crisis are the food industry (-2.2%, or 7.1% of the regional total by sector) and the electronics sector (-3.1%). Fashion, the leading sector in Veneto exports (19% of regional exports), had a reduction in foreign sales of about 17%.
In the second half-year, the two main sectors of regional exports exhibited a stable trend: fashion, down 0.1% compared to the first half-year 2009, and mechanical goods up 0.1%. On the contrary, foreign sales of the other main sectors are recovering with peaks in chemical products (+17.3% compared to the first half-year 2009), electrical appliances (+16.1%) and the food industry (+15.5%).
In 2009, Veneto imported goods for about 30 billion euro (approximately 10% of national imports) with a 20.4% decrease compared to 2008. The most popular imports were vehicles (18.9% of regional import), fashion (17.4% of regional imports), metals (10.2% of regional imports) and food products (9.1% of regional imports). The slump concerned the main sectors of regional imports and was particularly marked in metal products (-41.6% compared to 2008), mechanical goods (-29.3%) and vehicles (-22.2%).
The EU is the main market for imports to Veneto, amounting to about 62% of the total. Second is East Asia with 14.4%. Significant market shares are held by Eastern European countries (4.1%) and North Africa (4.6%). Veneto imports declined in value for most of the geo-economic areas analysed: -20% from the EU, with peaks over 25% from Belgium, the United Kingdom and the Czech Republic; -32.4% from Latin America, which in 2009 amounted to 2.7% of regional imports; -32.7% from North America; and -31.3% from Eastern Europe.
 The situation in Veneto's provinces The situation in Veneto's provinces
The situation of exports in Veneto provinces is rather varied. In the provinces of Belluno (-17,1%), Verona (-17,7%) and Treviso (-19%), the fall in the value of exports was slightly less than the average regional level. Vicenza and Padova reflected the regional pattern with negative values close to 21%, while Rovigo and Venezia had decreases in exports over 25%.
As to imports, Verona, Padova, Treviso and Venezia reflect regional patterns, while in Belluno there was a decline in imports of about 10%. Vicenza was the province with the sharpest decrease in imports (-26.7% in value compared to 2008) (Table 7.1.3).
In 2009, companies in the province of Belluno exported goods for a total of 2,058 million euro, amounting to 5.4% of regional exports. New markets were opened mainly thanks to the sales of optical instruments, amounting to over 65% of the province's exports. This marked an approximate 14% slump. Hardly positive signs came from the sector of mechanical goods (-19.6%), the second provincial sector with a value close to 15% of Belluno's foreign sales.
The overall value of goods exported by Padova's companies was 5,750 million euro. The share of Padova out of the total Veneto exports amount to about 15%. This confirms that Padova is fourth in the region in absolute export terms. The negative results for its exports are a consequence of other sector patterns. The mechanical goods sector, amounting to 29% of the province's exports, fell by 27%, while fashion, almost 16% of its exports, was more or less stable (-3.1% compared to 2008).
The province of Rovigo, with foreign sales amounting to 875 million euro, accounts for 2.3% of regional exports. In 2009, the value of the province's exports fell considerably as a consequence of significant reductions in exports to EU countries (-49,9%). The reduction in value was particularly sharp for the province's exports to the Middle East (-57%), Eastern Europe (-49%) and Africa (-120 million on 2008).
Exports from the province of Treviso total over 8,500 million euro. Foreign sales to the European Union account for 65%. The overall figures relating to the province of Treviso are affected by the slump in foreign sales of all the main manufacturing sectors in the area: fashion (-24.8%), which accounts for almost 25% of Treviso's foreign sales, mechanical goods (-22.3%), furniture (-16%) and electrical appliances (-21.1%). Difficulty in all main traditional markets was countered by positive results in the Chinese market. Treviso's exports to China rose from 200 million euro in 2008 to 270 million in 2009 (+35%).
In the province of Venezia, exports declined owing to the significant slump in the shipbuilding industry, which fell from 302 million euro in 2008 to 14 million in 2009, and in the aircraft and aerospace vehicle industry (-35.4%), which lost about 115 million euro. As for the main outlets for goods from Venezia, exports to Austria were stable (-7.4%), whereas in other markets reductions in foreign sales were over 20%. Conversely, exports to Slovenia (+17.3%), Croatia (+36.8%) and Singapore (+60 million euro compared to 2008) rose.
In 2009, the province of Verona exported goods for 6,826 million euro. If the most important products in terms of exports are considered, we can see a fall in sales of mechanical goods, the leading sector for Verona exports (-24,8%), as well as a decline in exports of metals (-34%) and rubber and plastic products (-22.7%). Less affected by the international crisis were two relevant sectors of Verona exports: food products (-1.1%), amounting to about 18% of the province's foreign sales, and fashion goods (-5.5%).
The province of Vicenza continues to play a significant role in regional trade. Exports amounting to 10,965 million euro account for almost 29% of the region's exports. The fall in exports from the province of Vicenza was due to a decrease both in direct flows to non-EU countries, which declined by 21.3%, and to EU countries, down by 20.7%. In the EU area, significant decreases were found in exports to Spain, Germany, the United Kingdom and France. On the contrary, exports to the Chinese market grew slightly (+2%). The most important economic sector at regional level, fashion, with 23% of total exports, saw a reduction in sales amounting to over 18%. The goldsmithing sector in Vicenza was also affected by the international crisis and its foreign sales fell by about 26%.
|
| Figure 7.1.1 |
 |
| Table 7.1.1 |
 |
| Table 7.1.2 |
 |
| Figure 7.1.2 |
 |
| Figure 7.1.3 |
 |
| Figure 7.1.4 |
 |
| Figure 7.1.5 |
 |
| Figure 7.1.6 |
 |
| Figure 7.1.7 |
 |
| Table 7.1.3 |
 |
|


