Oliver Williamson won the Nobel Prize for Economics in 2009 for his work on reducing transaction costs and thus on the need for companies to be networked and to have stable, productive relations with suppliers and clients.
It is a common belief that only a recovery of confidence, and therefore relationships, will bring about an end to this unprecedented economic crisis, which has been tightening its grip on the whole Western world for more than a year.
The supply chain of Veneto's food industry has had a strong network for some time, and this may be one reason that has enabled the industry to withstand the brunt of the crisis, as we will see. Veneto's four food-sector production districts and two food-sector production metadistricts are proof of this network
(Note 1); established by Regional Law
(Note 2), they were introduced to integrate, promote and link the various sections of the food production supply chain.
Setting up a network is by no means easy and at times the results are not immediate. Hereunder are some examples we feel exemplify Veneto's food industry.
Farm business networks
(Note 3) The tool used to identify these networks was the Integrated Supply Chain Projects (PIF)
(Note 4), envisaged by the Rural Development Plan (PSR) 2007-2013.
The cereal sector is characterised by the high number, yet small average size, of its businesses: The most common form of network is Veneto's cooperatives, which number about twenty; these also include agricultural consortiums, which manage to pool high quantities of products, even though these products are not always sold together. Four PIFs were presented and funding provided for a total amount of just under 11 million euro.
The setting up of networks in the fruit and vegetable sector is facilitated by the low number of businesses involved and by the EU Common Market Organisation that regulates the sector through its Producer Organisations (POs), whose criteria are governed by EU regulations.
At the end of 2009, Veneto had about 100 cooperatives, many of which belonged to one of the 17 official POs, which encompass almost 5,000 producers. However when compared to the regional total, these figures are still lower than the average of other European Member States. Indeed, the total surface area of the POs (just over 13,000 hectares) is only 23% of the surface area Veneto devotes to growing fruit and vegetables, and the commercial value of production is just below 30% of the region's total value, although it does reach the considerable sum of 256 million euro. It should also be pointed out that this sector's ability to create networks led in 2008 to the first Association of Producer Organisations, Veneto Ortofrutta, which comprises 7 POs; Veneto Ortofrutta, plus 4 other POs, received funding from the PSR 2007-2013 for Integrated Supply Chain Projects in the fruit and vegetable sector for a total of almost 18 million euro.
There are very few networks in the flower and nursery section, despite the small number of businesses (just over 1,700 authorised businesses); Veneto has 2 producers associations that provide services to about 350 members, while there are about 20 mainly small cooperatives. The most organised and long-standing organisation in this sector is Fioritalia, which benefited from a PIF amounting to about 1.5 million euro.
One example of companies that have formed a network is Siquria, a recently formed group of Veneto wine-growing businesses that pooled their resources in response to specific legislation.
With the introduction of the new Common Market Organisation (CMO) for wine, the European Union implemented a new system of controls on the production of Protected Designation of Origin (DOP) and Protected Geographical Indication (IGP) wine production, which bring wine in line with other quality-certified products. DOP is used for ex DOCG and DOC products, and IGP for ex IGT ones. From 1 August 2009, wine controls may no longer be carried out by protection consortiums. Instead they have been entrusted to third-party bodies that operate independently, impartially and transparently; their task is to trace the production supply chain from the grapes to the bottling of the wine.
The need to introduce this new regime of certification and control, without suffering it passively, led wine-growing companies and protection consortiums to set up associations. Ce.Vi.Ve. (Centro Vini Veneti) was set up to unite the following designations of origin: Arcole, Bardolino, Breganze, Colli Berici, Gambellara, Lessini Durello, Merlara, Soave, Valpolicella and Vicenza. Ce.Vi.Ve, together with certifying body CSI-Certificazione e Testing, set up "Siquria srl", which carries out controls in the above-mentioned wine-growing areas. Veneto's other designations are monitored by "Valore Italia", a company set up by the partnership between wine confederation Federdoc and certifying body CSQA.
An animal husbandry metadistrict was set up in Veneto in 2007 with the aim of creating a network between the region's meat supply chains. The member bodies, companies and organisations comprise the main animal-husbandry farms in Veneto, and they work alongside processing companies (abattoirs and meat processors), as well as public institutions such as the provinces, local councils, universities, producers associations and professional farming organisations. The metadistrict combines about 70 bodies and institutions, as well as more than 479 producers and processors, encompassing more than 7,000 employees. At industrial level, Veneto is Italy's leading region for the slaughter of meat cattle (24% of the national total) and of poultry (40%).
This animal husbandry metadistrict was set up in Veneto in order to represent a production sector that involves hundreds of operators, both in the primary, secondary and tertiary sectors, with extremely high levels of employment. The metadistrict aims to design a multi-disciplinary approach geared towards innovation and towards recovering the competitiveness of Veneto's animal-husbandry industry, with special focus on safeguarding health, animal wellbeing and the environment.
Veneto not only leads the national rankings in animal husbandry; it is Italy's main producer of soya, radicchio and wine, among its leading producers of corn, bread wheat and tobacco, and its third leading milk-producer. It is, however, with its excellent record in wine-growing in mind, that we mention the Prosecco di Conegliano-Valdobbiadene district.
A successful network: the Prosecco di Conegliano Valdobbiadene district
As mentioned above, by law Regions are allowed to recognise quality rural or food districts, which may also be interprovincial or interregional
(Note 5). Local production systems qualify as quality food districts only if they meet specific criteria. This may mean the area is a major producer of a regional product that is certified, safeguarded, traditional and typical; has a solid network of farm and food businesses; has a high level of farm- and food-business innovation, both technological and organisational; combines food production with culture and tourism; can provide first-class business and technical training; and demonstrates an active, integrated policy within local institutions that also involves working with farm and food businesses.
A food district must therefore be based on a typical local product that is a sign of excellence and inextricably linked to the local area.
These qualities lie at the heart of the Prosecco di Conegliano-Valdobbiadene district, which comprises 15 municipalities in the foothills of the province of Treviso. The district has its roots in this history of the area. Although the production of one of Italy's most internationally renowned wines only started at the beginning of the 19th century, viticulture in the area is historically documented; in the 6th century, San Venanzio Fortunato, Bishop of Poitiers, famous poet and son of Valdobbiadene, wrote these words about his homeland: "quo vineta vernantur"
(Note 6).
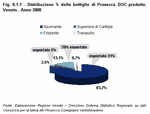
The results we present here are taken from a 2009 report by the district study centre; they provide a snapshot of the situation in 2008, the last year of Prosecco DOC, rounding off nicely the 40-year career of this designation, which originated in 1969. Prosecco is now looking to the future with its new DOCG designation
(Figure 8.1.1).
Of the 57-million-plus bottles produced in 2008, more than 80% were Spumante, the most popular among consumers, for a total value of about 370 million euro.
About 5,000 hectares of vineyards are devoted to Spumante, and the Prosecco district employs more than 5,000 people, a trend that is rising. There are about 166 Spumante producers in the area.
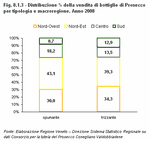
If we look at market trends in 2003, we see that Prosecco DOC is in constant growth. The almost 40 million bottles produced in 2003 reached more than 57 million in 2008, an increase of more than 45%. The lion's share of this is, once again, Spumante, which, on average over these years, accounts for at least 80% of the total production each year; on average its production increased by more than 2 million bottles
(Figure 8.1.2).
Spumante also follows a similar trend in terms of export: in 2003, Spumante accounted for 56% of the Prosecco DOC exported, but in 2008, this figure rose to almost 88%, with peaks in annual growth that exceeded 22%.
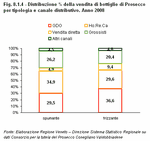
About 70% of the bottles of Spumante and sparkling Prosecco produced are consumed in Italy, more than 20% in Veneto alone. The main distribution channel for Spumante is Ho.Re.Ca.
(Note 7), although over the last five years it has lost some of its market to wholesalers and Large-scale Organised Distribution (LOD)
(Note 8) (Figure 8.1.3) and
(Figure 8.1.4).
The opposite can be said for sparkling Prosecco, which sees LOD as its main distribution channel; Ho.Re.Ca fell (-38% between 2003 and 2008), wholesalers increased, and direct sale fell slightly, although it still maintains almost double the share of the Italian market that Spumante has.
The majority of the 30% of the Prosecco that is exported goes to continental Europe, which accounts for three-quarters of the Spumante bottled and almost all of the sparkling (94%). The leading importer is Germany, which accounts for 37.5% of the Spumante exported in Europe, 60% of the sparkling and 27.5% of the Superiore di Cartizze.
Outside of Europe, major market shares are occupied by North America, which in 2008 accounted for15.8% of the Spumante sold, with there being a sharp increase on previous years. The small share of sparkling that is exported outside of Europe fell to North America, however in the last year there was a sound increase in exports to South America.
Other examples of food-industry networks: supply
(Note 9) Farmers markets are a major activity in the short supply-chain and one noted for its ability to link groups into networks; Veneto is a leader in quality and a major promoter of the "Km zero" project, which aims to boost the purchase and consumption of local products.
The protagonists of these weekly, twice-weekly or monthly markets are the producers, who have the opportunity to sell their produce directly to the end consumer with any intermediaries. This is not only an opportunity for the customer to save money (prices can be as much as 30% lower than the prices on SMS consumatori
(Note 10)), but also promotes local products and is an alternative source of income.
Veneto, which recently surveyed municipalities on farmers markets, discovered that almost 600 places are available in a total of 44 farmers markets
(Figure 8.1.5).
The province with the highest density of markets was Venezia, which accounted for more than one third; then came Treviso and then Verona.
In 2009 Veneto Agricoltura
(Note 11) set up a survey which involved giving out 203 "producers" questionnaires and 265 "consumers" questionnaire at summer farmers markets in Veneto.
Initial results show that the main producers are those of fruit and vegetables, which account for around half of farmers; then come wine producers (12%), milk and dairy producers, as well as vegetable processors, who made juices, jams and conserves, both of which were sold by about 11% of producers. Meat and by-products were sold by 10% of farmers present; a smattering of producers sold other products, including honey (7.5%), flowers (5%), and oil (4%). One surprise was that only 40% of the producers made and sold certified products.
Less than 40% of producers set up a stand at one market only; however more than 60% of the producers interviewed said that they sold directly at farmers markets more than one day a week. This was also one reason why 61% of them made a journey of less than 20 km from their farm to reach the market. This figure is also affected by economic aspects and the restrictions imposed by local councils on the origin of the producers allowed to sell at the markets; 68% of farmers need to come from within the province.
All of the producers interviewed also made direct sales of their products; the farm itself was the main source of produce sold (44%), followed by farmers market (33%). As farmers markets are a relatively new channel for farms, about 47% of producers make less than 10% of their turnover from these markets; however 7% of interviewees declared that farmers markets were their main sales channel, accounting for more than 50% of their turnover.
Overall, 94% of producers approved of farmers markets and 82% thought that they enabled them to increase their business income.
Other examples of food-industry networks: demand
It is not always simple to follow changes in the purchasing patterns of Italians, but it appears that in recent years networks have rapidly become much more popular with larger sections of the population. Indeed, the trend of setting up networks is not only more popular with food-supply chains, but also with consumers; an increasing number of citizens are creating purchase groups in order to obtain favourable prices and to guarantee quality.
I gruppi di acquisto solidale (GAS) [Farm Direct Marketing Groups] are groups of people who buy common and daily products wholesale and then distribute them amongst the group; this way they create a network of solidarity between the group and producers, who are normally chosen in accordance with criteria that involve respecting the environment, ethics and equity.
This trend is spreading quickly and it fascinates everyone who wishes to purchase sufficient quantities that will optimise transport costs and provide access to more favourably priced distribution channels: from wholesalers to farmers market, and even in businesses that sell direct.
There are various ways to make purchases, and they range from the home delivery of crates of products to the group 'adoption' of individual animals, as well as a growing number of businesses that allow people to pick their own vegetables at the farm.
There is also a range of agreements that GAS have with farms and they include weekly delivery of produce, making specific orders by phone or internet, and a subscription to products delivered on set dates on advance payment. The main methods are the distribution of crates of fruit and vegetables on set dates and the sale of packs of meat.
Normally participants draw up a list of products they want and then establish a basic price for all. An order form is then filled out and sent to the producer, who is paid on delivery. Groups often get together to visit the producer and take this opportunity to find out more about products and farming techniques.
Not all groups, however, have a structure as such and so it is not easy to pinpoint their presence in an area and to have an idea as to when they were set up and their coverage. According to a recent survey by Coldiretti and Agri2000, Italy has about 600 GAS, a number that rose by 30% on 2008. Lombardia is the leading region with 160 structured GAS, Veneto lies just out of the medals position with more than 50.


