When we move in from the outskirts to the city centre, the types and times required for mobility change. In the city, webs of relationships are denser, there are many more opportunities and the dominating lifestyle is one which juggles work, family and freetime; therefore it requires flexible and time-effective transport solutions. Mobility demand in the urban centres is high and scattered, trips are mainly short and repetitive, or often one-offs. Within this context, the competition faced by the public transport network from private means of transport-especially cars and motorbikes-is extremely intense. The private means of transport appears to be more suitable to individual mobility needs, including those of the so-called city users (commuters, workers and students who live outside the city, tourists etc.) who do not live in the city but who use its facilities, increasing pressure on the services therein. The introduction of traffic restriction measures (pedestrian zones, restricted traffic areas (ZTLs), etc.), and problems finding or the cost of parking can discourage the use of the private means of transport in favour of local public transport.
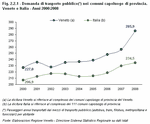
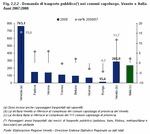
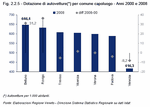
In 2008 public transport in the capital municipalities in Veneto carried 286 passengers per inhabitant, this was an almost 12% increase on the previous year and a 26% increase compared to 2000. The biggest increases compared to 2007 were in the main urban centres (Venezia, Verona and Padova); this confirms the strong link between size of municipality and demand for public transport
(Figure 2.2.1) and
(Figure 2.2.2).
In terms of services provided, in 2008 the bus network (measured by length of routes (km) per 100 km² of municipal surface area) in the capital municipalities in Veneto had increased by 4.4% compared to 2000. Verona (+9.6%), Vicenza (+9.4%) and Venezia (+4.7%) stand out in particular. In the last year on the other hand, the only municipality to have increased its network was Verona (+4.7% compared to 2007). Transport networks in the other capital municipalities have remained more or less the same.
The availability of buses has not changed either: 10.5 vehicles per 10,000 inhabitants, which ranges from a low of 5.5 in Treviso to a high of 17 in Venezia.
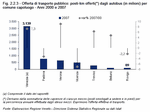
Verona, Venezia, Treviso and Belluno have also increased their seats/km figures. This is calculated from the sum of the capacity of each vehicle (seats and standing places) by annual distance travelled by each vehicle and gives an indication of real transport offer
(Figure 2.2.3).
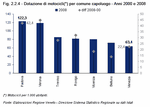
In terms of urban mobility, there has been a general increase in the use of motorcycles, in particular in the main capital municipalities such as Verona and Padova. In these cities there has also been, in compensation, a slight decrease or an evening out of the number of cars per 1,000 inhabitants. In Padova in 2008 there were 122 motorcycles per 1,000 inhabitants on the roads, 42 more than in 2000; in Verona there were 118, 45 more than in 2000.
There is a much higher increase in the number of cars on the roads in the smaller capital municipalities. As a matter of fact, Belluno had the greatest number of cars per inhabitant in 2008 (646 cars per 1,000 inhabitants, this is 31 more than in 2000), followed by Rovigo with 632 (36 more than in 2000).
Therefore in the main urban centres, private means are clearly much used in order to get to a destination as quickly as possible, but people do seem to prefer to use motorcycles rather than cars
(Figure 2.2.4) and
(Figure 2.2.5).
There are various reasons for this increase in the use of local public transport on the one hand and the move towards "two-wheeled" transport on the other: lack of availability of parking places, growing traffic congestion, and an increase in the number of restricted or prohibited traffic areas. This is all further proof of the fact that, if the traveller's destination is restricted by measures discouraging the use of the personal car, then the mobile population has to find an alternative means.
One of the initiatives undertaken in order to encourage the development of public transport and intermodality is Padova's tram service. This should be cited as an example of "good practice" as it guarantees fast link-ups with the city centre, the suburbs and the outlying municipalities in the first belt. The tram route is slightly over 10 km long, connecting the north and the south of the city and travelling through a densely populated area.
The aim is to create a fast transport network which can join up the city's key areas. The tram can provide for the needs of different categories of users such as workers, students, residents and even tourists seeing as the tram goes past the main sights of the city (Scrovegni Chapel, Palazzo della Ragione, Pedrocchi Cafč, Prato della Valle, S. Giustina Basilica, S. Antonio Basilica).
For those who come in from outlying municipalities the park-and-ride is an easy and convenient option; there are carparks at the end of the tram line in Guizza and in Pontevigodarzere and the tram passes to take people into town every 8 minutes or so on weekdays.


