14. Veneto, its competitors and European regions
|
The last chapter of this edition takes a look at Veneto in international terms, something that has become a regular feature of the statistical report. Its results are compared to those of other European regions and, in particular, to those whose economic, demographic and social conditions are most similar to Veneto's.
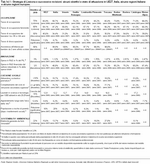
The most direct comparison is that based on the targets established by the European Council in Lisbon in March of 2000, which aimed to transform the European Union into the most competitive and dynamic economy in the world by 2010, one based on knowledge and capable of ensuring sustainable economic growth, increasing and improving the number of jobs, and creating greater social cohesion and respect for the environment. Later, in 2005, the strategy was relaunched and centred primarily on the realisation of more stable and long-lasting growth and the creation of new and better jobs, within the wider long-term objective of improving the quality of life of all citizens and ensuring greater prosperity and social justice. To achieve these objectives, providing incentives and opportunities for education and training is of increasing importance. Greater lifelong investment in human capital and individual creativity is undoubtedly the key to creating new and better jobs, a fundamental premise for economic recovery. It is a means to combat inequality and poverty and a tool that will undoubtedly not only reduce youth unemployment, but also help all disadvantaged groups to find jobs, as well as reduce social marginalisation. The year 2010 is around the corner, but the path to achieving these objectives will take longer than planned, since the results obtained so far are geographically uneven and below expectations, due in part to the current world economic crisis. Today policy makers also have a new objective: finding a way to recreate the jobs that have been lost. Below is a summary of the current progress made toward the Lisbon Agenda's objectives in Veneto, in Italy, in the European Union, and in the Italian and European regions that are Veneto's competitors. The Italian regions compared are all above the Italian average in regard to employment. In 2008 Veneto recorded an employment figure for the population between 15 and 64 years of age of 66.4%, which made it fifth among the Italian regions. Emilia Romagna is the only region in Italy that has slightly surpassed the European objective with an employment rate of 70.2%, nearly four percentage points greater than the figure for Veneto. The employment situation in most of the foreign regions looked at is generally quite positive: in the German regions and Cataluņa, the European target has been surpassed, in some cases it has been for several years. Rhône-Alpes, however, has had employment levels rather similar to those in Veneto. In the German and Spanish regions, the objective for female employment has been surpassed, as has that for workers between 55 and 64 years of age, while for Italy and Veneto the target is still far off. It should be noted that employment levels may be influenced by the different rules on retirement age in force in single European countries. Although participation in the labour market is generally greater in the European regions, they have, on average, registered higher unemployment rates compared to the rates in the Italian regions: 7% was the average European figure in 2008, a little higher than the Italian figure and double that of Veneto (3.5%). Better levels and quality of employment are impossible without greater research, education and innovation. And in these areas there is still much room for improvement. Only by investing in people throughout their entire lives and promoting high-quality education can the success of Europe be assured. Human capital is the strategic resource for European development and, therefore, it is necessary to constantly improve the quality and effectiveness of its education and training systems, as well as to facilitate access to education systems for everyone. To promote social equity and cohesion, the Lisbon Agenda also calls for the reduction of poverty. In Europe 16 people out of 100 are at risk of poverty, while in Italy it is 20%. The figure for Veneto is decidedly lower and similar to the other competing regions in Italy: about 1 person in 10 lives in difficult circumstances that could compromise their standard of living. (Tabella 14.1) In the second part of the chapter, there are a series of charts related to the indices of various sectors (Note 1). In each one Veneto is compared to the regions considered its competitors: Lombardia, Piemonte, Emilia Romagna, Toscana, Baden-Württemberg, Bayern, Cataluņa and Rhône-Alpes, as well as with Italy and the European Union. Warnings
For the processing of the index charts, analysis is based mainly on Eurostat data. It has not always been possible to use the same years for every topic, so the most recent data available has been used. For Veneto, recent data is available for almost all the topics, but to make comparisons, figures using the same timeframe for all the regions analysed have been used. Indeed, there are some differences to note between the data presented in the first part of this report and that used hereunder: this is due to the need to make the figures compatible with each other and with some Eurostat definitions that do not always correspond exactly to the ones used officially at a national level. |
|
|
|
|
|
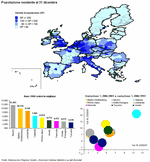
Resident population on 31 December
The demographic changes in a geographical area is representative of several significant social features: increased longevity due to better health and better economic well-being, and population growth due mainly to migration, which compensates for the general decrease in births.In all of the European regions considered demographic growth was observed. The area that recorded the greatest growth was Cataluņa: population has increased by 16.6% over the last fifteen years and by 11.7% since 2001, reaching a little more than seven million residents at the end of 2006. For the Italian regions in 2006, the population of Veneto was 4,773,554, an increase of 5.4% compared to 2001 and of 9% compared to 1991. Emilia Romagna and Lombardia are quite near Veneto's figures; the growth of population, however, was more limited in Piemonte (+1.3% since 1991 and +3.3% since 2001) and in Toscana (+3.2% since 1991 and +4% since 2001). Given that these regions, of those considered, are the ones with the highest old-age index and the lowest birth rate, growth can probably be attributed predominantly to the immigration of foreigners. |
|
|
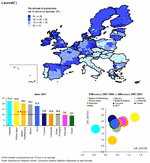
University graduates
The European Union recognises the fundamental role its education and training system has to play in the new knowledge-based society, highlighting it in the Lisbon Agenda.Over the last few years there has been a continuous rise in the education level, so that in Europe 17.9% of the population who are at least 15-years old have a university degree. All of the foreign regions have high levels of university graduates and about one fifth of the population has a university degree. It should be remembered that in Italy the results of the recent reform have just begun to be seen, while in other countries reforms were made years ago so young people leave university much earlier than in Italy. In Italy the percentage of graduates is only 10.2% and all the Italian regions have results comparable to the national average; Veneto ranks last with 9.2% of graduates out of the population aged 15-years old and over. Despite the low levels of the Italian regions compared to the foreign ones, the reform of the university has had positive effects. Indeed, in all the Italian regions considered, the share of graduates has increased by about two points compared to 2003 and there has been a slight increase since 2006. The foreign regions have also recorded an increase in the percentage of graduates both in the short and long term, with Cataluņa being the only exception with a slight decrease compared to 2006. |
|
|
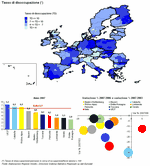
Unemployment rate
The data available for the European regions ends in 2007 and so a regional comparison on the impact of the current economic crisis on the labour force cannot be performed.In 2007 Italy's unemployment rate was 6.1%, a figure below the European average (7.2%) and much lower than in 2003 (-29%). Among the regions considered, Veneto had a low unemployment rate (3.3%) and was second only to Emilia Romagna (2.9%). In general, all of the Italian regions examined here have performed better than the other European regions, especially when compared to Cataluņa and Rhône-Alpes, which both had 6.5%. Compared to 2006 only Piemonte experienced an increase in the unemployment rate, which rose by 5% . The regions with the biggest drops are the German regions and Veneto. One of the targets the Lisbon Agenda set was a significant reduction in the unemployment rate, and certainly progress has been made. In fact, over the last five-year period all of the regions examined experienced a significant decrease in unemployment, especially Cataluņa, Baden-Württemberg, Bayern and Piemonte. |
|
|
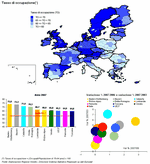
Employment rate
In 2007, the employment rate of the Italian regions considered here was notably higher than the national average (58.7%), but only Emilia Romagna was able to surpass the threshold of 70% set for 2010 by the Lisbon objectives. Specifically, Veneto reached an employment rate of 65.8%, ranking, among the Italian regions considered, behind Emilia Romagna (70.3%) and Lombardia (66.7%) and ahead of Piemonte (64.9%) and Toscana (64.8%)For the foreign regions examined, the circumstances of employment were quite satisfactory: the German regions surpassed 73% and Cataluņa achieved 71%. Only Rhône-Alpes had figures similar to the Italian regions and recorded the smallest variation in the employment rate, both in the short and the long term. While the Italian regions recorded an increase in the employment rate, they did not experience large variations compared to 2006, with the exception of Emilia Romagna, which increased its employment rate by 1.3%. The greatest increases in the employment rate of the working-age population were in Baden-Württemberg and Bayern, with 2.8% and 1.7% respectively. In respect to 2003, all of the regions compared recorded an increase in the employment rate, especially Cataluņa, which experienced an increase of over 7%. It should be underlined that employment levels can be influenced by the different rules on retirement ages in individual European countries. |
|
|
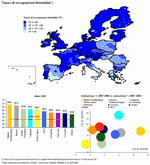
Female employment rate
The progressive demographic ageing and the subsequent decrease in the active-age population make it necessary to attract and keep the largest possible number of people in the labour market. Thus it is important to encourage an increase in the rate of female employment.The Lisbon objectives call for reaching a female employment rate of at least 60% by 2010. Despite greater female participation in the labour market in recent years, in 2007 the percentage of employed women in Italy was only 46.6%, quite far from the established objective, while the European average was equal to 58.3%. The Italian regions considered here recorded low levels of female employment, except for Emilia Romagna, which reached 62%. Veneto is last in the ranking, with 54% of women aged 15-64 in gainful employment. In 2007, the other European regions used for comparison had all surpassed the 60% threshold: in particular in Baden-Württemberg, where the female employment rate had reached 68.1%, and in Bayern, which achieved 67.1%. Compared to 2006, only Rhône-Alpes recorded a slight decline in the female employment rate, while in all the other regions an increase was recorded, especially in the German ones. Over the last five-year period, all of the regions experienced growth in the percentage of employed women: the greatest occurred in Cataluņa (+13.3%). |
|
|
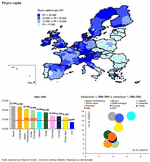
GDP per capita
In the European context, Veneto has kept its high ranking for Gross Domestic Product (GDP) per capita in terms of Purchasing Power Standards (PPS). In fact in 2006, the most recent year for which data for comparison with the other European regions is available, GDP per capita in Veneto was equal to 28,700 euro, more than 17%, i.e. 4,200 euro, above the national average.Only Bayern, Lombardia and Baden-Württenberg surpassed the threshold of 30,000 euro of GDP per capita. When looking at the variation in GDP, the Italian regions seem fundamentally to grow more slowly than the other European regions considered: more generally the European regions clearly increased their GDP more than the Italian ones, both in the short term (2006/2005) and the medium term (2006/2002). There is a clear difference in GDP growth between the Italian average and the European average; the latter increased by more than one percentage point over the last year and by more than eight over the five-year period 2006/2002. This was thanks mostly to the contributions of the new EU Member States, which had very high growth rates. Among the European regions, Cataluņa merits special mention as it has experienced the greatest growth both over the last year (+6.6%) and over the last five years (+16.0%). Of the Italian regions, Veneto had the highest growth rate in the long term (2006/2002), while Emilia Romagna had the highest growth rate between 2005 and 2006. |
|
|
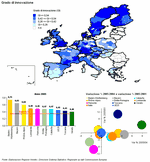
Innovation performance
(Note 2) Since 2000 the European Commission has used a range of tools to monitor the progress made by various geographical areas with the objective of increasing competitiveness through innovation. One of these is the European Innovation Scoreboard, which gives an overall indication of innovation performance at a national level. Another scoreboard is for innovation performance at a regional level, which measures the innovative features of a region compared to the EU average and to the country of which it is part.The European Innovation Scoreboard 2005 confirmed the EU's weakness in innovation when compared to its principal global competitors, i.e. the United States and Japan, but it did highlight its rapid improvement. When it comes to the individual Member States, the world leaders are the small economies of Northern Europe, i.e. Sweden, Finland, Denmark, and Switzerland. Among the largest economies, the United Kingdom is the most innovative. The index for Italy, equal to 0.34, demonstrates the general lag when compared to the European average of 0.45, and the lack of improvement over the period 2001:2005 (-0.9%). In this context, looking at the overall index for regional innovation, it can be seen that Veneto is in circumstances similar to those of Italy. Among European regions, Veneto ranked 122nd out of the 203 regions considered, with an index in 2005 of 0.40, which is near the average value of 0.43. Compared to 2001, Veneto improved by 4.6 percentage points. |
|
|
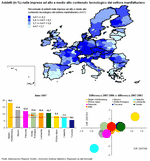
Employees in high- and medium-high technology content businesses
Market-oriented technology innovation is indispensable if we are to attain higher value added in services and high-tech sectors. The development of a knowledge-based economy therefore also implies the promotion of products with greater technology content. Despite Veneto beginning from a relatively disadvantaged position in terms of the overall innovation indicator analysed above, it is a geographical area which already possesses the bases for improvement. According to the OECD classification (Note 3) regarding technology, in 2008, Veneto had the third largest share of manufacturing firms with a high-technology content, comprising 9.3% of Italy's total, behind only Lombardia and Lazio. The percentage of employees in firms with high- and medium-high technology content was also rather significant in Veneto, 10.7% in 2007, which was higher than the Italian average of 7.6%. The German regions, led by Stuttgart, are centres of global excellence in the technology sectors and can be considered standard setters, but Veneto itself is in an excellent position in the ranking, which is based on the number of employees in firms with high- and medium-high technology content. Veneto ranks 20th among European regions. Furthermore, it has experienced the largest increase in the indicator in recent years, second only to Rhône-Alpes. |
|
|
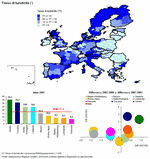
Tourist-density index (*)
The tourist-density index, which is calculated as the ratio between the number of nights spent and the resident population, indicates the average number of tourists who are present in the region every day. Veneto had a tourist-density index equal to 35.1 nights spent per 1000 residents and is the region with the highest rate, more than double the national average (17.4). This figure illustrates Veneto's high density of tourists in comparison with its demographic size. The other regions with high tourist-density indices are Toscana (31.2 nights spent), Emilia Romagna (24.6) and Cataluņa (24.3). Bringing up the rear with the lowest levels are Piemonte (6.5) and Lombardia (8.2).Veneto and Toscana are also the two regions that have experienced the largest increases both in the short and the long term, confirming both the importance of tourism and its economic significance in these regions. The other regions have not experienced significant variations over the last five years. Compared to 2006, however, all the foreign regions considered here, and Piemonte, have recorded a slight decline in the average number of nights spent by tourists per 1000 residents. |
|
|
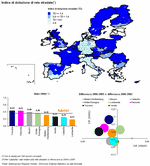
Road Quality Indicator
Although many countries have declared they aim to move toward a more balanced mix of transport, and this includes objectives at European level, roads are currently the most exploited option, both for the transport of people and for freight.One index that is useful for measuring the degree of congestion on the road network is given by the kilometres of road available per 100 vehicles in circulation. If the south coast of Spain is left out, the map of Europe seems to reveal a central axis that begins in Denmark in the North, passes through Germany and ends in the South with Italy, where the situation is the most critical. In 2006 Lombardia and Veneto were the most congested Italian regions, with figures equal to 0.23 and 0.33 km of roads per 100 vehicles in circulation. Both the figures are below the Italian average, which was 0.44. In the other European regions only Cataluņa recorded a lower figure than Veneto with 0.29. Finally, it should be noted that the situation remained basically the same in the short and medium term. |
|
|
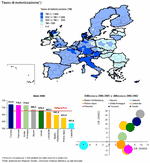
Motorisation rate
The number of motor vehicles available to the resident population is another indicator of the density of motor cars that weighs upon a geographic area, and therefore, upon road congestion.In 2006, the number of vehicles in circulation per 1000 residents was high in all Italian regions, especially in Toscana (722), Piemonte (716) and Emilia Romagna (714). Of the European regions, only Bayern has similar levels to those of the Italian regions. Veneto, with 678 vehicles available per 1000 residents, is in line with the Italian average, and it experienced an increase of 6.6 vehicles compared to 2005 and 13 over the last five years. Compared to 2005 only Cataluņa experienced a decline, equal to 8 vehicles. Over the last five-year period, on the other hand, the value of the index declined in the European regions of Rhône-Alpes and Cataluņa, and in the Italian regions of Piemonte and Lombardia. Bayern, however, recorded an increase of 25 vehicles, Toscana 18, and Baden-Württemberg 14. |
Data processed by the Statistics Office of Regione Veneto are collective property; reproduction of this material is authorised for non-commercial purposes only, provided the source "Regione Veneto - Regional Statistics System Management" is acknowledged.
English translation by the University of Padova Language Centre.


