4. The figures tell the story
|
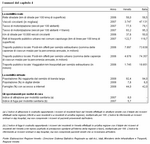
There were 10,666 km of main roads (motorways, ex-state roads, regional and provincial roads) in Veneto in 2006. This is equal to 58 km per 100 kmq of surface area and to just about 38 km per 10,000 vehicles in circulation.
For every 100 kmq of surface area in Veneto's capital municipalities in 2007, there are 123 km of bus, tram and trolley bus routes (Italian figure: 120); Padova has the most with 213 km and Belluno the least with 57 km. Vicenza has the most available buses with 11.4 for every 10,000 inhabitants, Treviso has the least with 5.5. Venezia is counted separately; if we include water-buses, it has 17 buses per 10,000 inhabitants. In the last ten years the number of vehicles entering the motorway has increased by 29%, passenger vehicles by 27.5% and goods traffic by 34.5%. In Veneto in 2007 there were more than 3,700,000 vehicles in circulation, 76% of which were cars and 10% freight lorries and trailers. Compared to ten years ago, the number of vehicles per 100 residents has increased by 9, to 78 (Italian figure: 79). The car plays a leading role in daily journeys: 77% of people leaving their homes (Italian figure: 79.5%) for reasons of work, study, family or leisure use a motorised means of transport; 79% of the time this is their car (Italian figure: 72.6%). The "commuters for work" group accounts for 24% of people who leave their home on a daily basis: they move around mostly for work or study (94% of movements) and almost always on the same route. A high concentration of journeys is undertaken in the morning. In Veneto in 2008, 92.4% of the population had broadband coverage and the number of people without access to new technologies had halved on the previous year. Veneto is undoubtedly an area that attracts people and goods, and thus generates mobility for different reasons. Veneto's hospitals can also be considered to generate mobility: hospitals not only attract patients needing care, but also their relatives, who come to assist them, looking for a place to stay and moving around the area. In 2007, almost 864,000 hospitalisations were carried out in Veneto hospitals; in 91% of cases, these patients were resident in Veneto, 8% came from other Italian regions, and the remainder from abroad. (Chapter 4 in figures) |
|
Data processed by the Statistics Office of Regione Veneto are collective property; reproduction of this material is authorised for non-commercial purposes only, provided the source "Regione Veneto - Regional Statistics System Management" is acknowledged.
English translation by the University of Padova Language Centre.


