11.1 The evolution of Veneto agriculture
|
Agriculture is inextricably tied to the soil and to the cycle of the seasons; it is part of an unchanging, repeated rhythm that is destined to last because it fulfils the fundamental role of nourishing humans and animals and drawing energy from the earth.
It is also true, however, that to carry out its functions to the full it needs to obey the mechanisms of the market which are applied to a multi-faced context in continual movement, just as people are. Agriculture is therefore bound by its need to adapt to new trends and market requirements and to bow to the unchangeable needs of nature; this involves handing down centuries of experience generation to generation and innovating and exploiting skills and features of individuals with ideas that add value to the unique hallmarks of each area.
Before analysing the structural evolution of Veneto's agriculture, we will have a look at agriculture's performance in the last year in Italy, with a particular focus on Veneto.
Figures for 2008 show that agriculture in Italy is expected to grow: the real increase forecast is expected to exceed 2007 by more than 2%, in line with prices and production in current values. ISTAT estimates for value added suggest that "agriculture-silviculture and fisheries" is the only group showing consistent growth nationwide, despite the effects of the international crisis that hit all sectors of the economy and finance from mid-2008 on. This result was fostered by a good agricultural year in terms of climate and production, a favourable market in the first semester of 2008, attributable to the major increase in the prices of agriculture's main commodities, and by a containment in farmers' operating costs which involved replacing or reducing the means of production that experienced the highest increases. The situation in Veneto, however, remains fairly stable, with its gross production standing once again at around 4,700 million euro. In real terms however, there was a slight drop which can be put down mainly to a fall in the production of corn, Veneto's main crop, and to the adverse weather conditions for the final production of some wood. (Table 11.1.1) A detailed look at Veneto's production reveals that the climate created unfavourable conditions for most of its cereals (corn, wheat and barley) except for rice. The sharp decline in corn is mainly due to a 10% reduction in the area devoted to its farming. It was replaced mostly by two types of wheat (durum and bread); there was also a fall in the area devoted to farming the other aforementioned cereals which, combined with unfavourable weather, led to a decline in horticultural crops, producing a 4%-plus drop in both current and constant prices. Sugar beet lost 22% of its farming area, despite providing a good yield, a factor that influenced results for industrial crops, which also fell heavily. Production was also down for oil crops, mainly because of a 15% fall in soya crops due to poor plant health. A good trend in the sale of vegetables produced a 2% increase in real terms, mainly thanks to the main vegetable crops. The farming area of potatoes remained stable while that for radicchio fell, although this was compensated by an excellent yield. The constant prices of wood fell by an average of 3%, but current prices rose by an average of 1%; the weather for this agricultural year was, however, favourable for some crops such as pears and apricots, but extremely unfavourable for others such as nectarines, peaches and cherries. Animal husbandry experienced a rise in production, in terms of both current and constant prices. Although the consumption of beef and pork remained fairly stable, there was a 15% increase in the share of pork, which led to an increase in turnover. Poultry production continued the recovery that had got underway in 2007 for both battery and poultry chicken, with good increases overall.
Over the last three decades, Veneto's agriculture has changed at an ever increasing pace; in the last 25 years, the number of farm businesses (Note 1) has fallen by one third (-33%) and by 93,000 hectares (-10%) of farmland that have been turned to other uses. Revolutionary changes have occurred, ones that have affected the entire country to varying extents. (Figure 11.1.1) and (Figure 11.1.2)
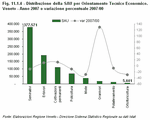
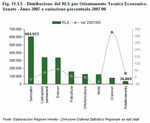
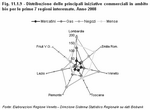
The clearest changes regard the farming area and the number of farming businesses. Although the latter have fallen in number, also leading to a drop in employees, the average size of farm businesses has actually risen: from 4.2 hectares in 1982 to 5.7 in 2007. The decrease in surface area and the number of farm businesses has mainly effected those with less than 5 hectares of Utilised Agricultural Area (UAA); however the trend has slowed in recent years and was fairly stable in 2007, the year for which the most recent figures are available. In Veneto, farms are most commonly family-run; figures show that this trend has remained stable since 2000 and today more than 82% of farms fall into this category. Changes however have been seen in who runs the farm. In Veneto today, about 30% of farms are run by women: up 21 percentage points on 2000. This figure confirms that cultural, social and economic changes underway throughout Europe are becoming stronger, leading men further from the primary sector and making more room for women. There are major statistical differences between farms run by men and those run by women. Firstly, the average age for women is much higher, 58 years for women against 55 for men; the average UAA for women is 4 hectares, considerably lower than that for men, who own 5.8 hectares: almost 50% more. Women show a net preference for farms specialising in seed crops; 65% of women have a farm of this type against 42% of men, who prefer to run farms specialising in permanent crops or rearing herbivores. There are no major differences between genders as regards information technology as no more than 13% of farms have at least one computer, although the vast majority of these (more than 83% of those run by men and by women) have an internet connection. Almost 60% of farms with an internet connection run by men have a website against 45% of farms run by women. A closer look and analysis by type of farming (Note 2) reveals that between 2000 and 2007, farms that dealt with a number of farming types, mainly polyculture and mixed livestock, were the ones that reported the largest drops; these types of farms also fell within the lowest standard gross income bracket (Note 3). Once again, farms that specialised in arable crops led the way as they accounted for almost half of UAA and of the number of farm businesses producing arable; along with breeding herbivores, this type of farm had the highest Standard Gross Margin. (Figure 11.1.3) Growth in UAA was mainly reserved for farm businesses specialising in permanent crops and animal husbandry; growth in farms specialising in breeding grain-eating animals (Note 4), more than doubled, although they continue to account only for a marginal amount of farming area. Arable crops experienced the largest fall, down 15% in Standard Gross Margin, which is measured in European Size Units (ESU) (Note 5); the situation improved for permanent crops and animal husbandry. These latter two specialisations gained the biggest advantage from the rise in average Utilised Agricultural Area, which exceeded 14 hectares for corn-eating animals. Signs of difficulty come from specialisations in horticulture and floriculture, which experienced a drop in UAA of almost one third and a 3% drop in Standard Gross Margin, leaving their average farming area at just over 2 hectares. Farm businesses are proving that multi-functionality is the way forward and that their efforts are coming to fruition. Although the percentage of multi-functional farms is around 6% of total farms, the growth rates are comforting; between 2003 and 2007 the number of farm businesses that decided to branch into at least one activity linked to agriculture doubled, with the result that their SGMs were almost triple those of farm businesses who did not. (Figure 11.1.4) and (Figure 11.1.5) Besides these tangible aspects, there have also been changes that have revolutionised how soil is approached and used. Over the years, we have witnessed a revolution that has changed the direction of both Italy and Veneto's agriculture. Consequently we should not only talk about how much change has taken place, but also what its effects are. Farm businesses are leading the way in these changes as they are turning towards a "multi-functional system" for many reasons, including financial ones. Activities within this system range from protecting the soil and environment, as well as safeguarding the land and its traditional cultural values, to a host of proposals that go beyond the farm's production activities.
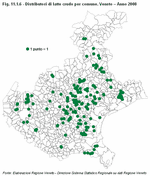
Farm businesses, however, are not the only protagonists, as citizens and consumers, institutions and administrations also play a key role in raising awareness and drawing attention to the values of local and environmental quality, food and respect for tradition. This has led to the development of Gruppi di Acquisto Solidale (GAS) (Farm Direct Marketing Groups), which bring together consumers who not only buy food and household products wholesale, but also add criteria on how to choose products, thus favouring small producers, respect for the environment and solidarity. This need to "shorten the supply chain", with the benefits it brings to both producers and consumers, has led to farmers' markets, where in a building or a public place authorised by the municipal authorities, farmers and producers can meet and sell a variety of fresh fruit and vegetables, as well as other products, directly to the consumer (Note 6). This same need for more direct producer-consumer relations has also led to the introduction of unpasteurised milk dispensers, which have become very popular throughout Italy. In Veneto, the idea has also spread quickly as there were 168 in the region by the end of 2008. (Figure 11.1.6) Veneto has also promoted the first Regional Law (L.R. no. 7 of 25/07/08) in support of "zero-kilometres food", which sanctions the preference for local products in canteens, restaurants and large-scale distribution. This initiative meets the need of a growing number of consumers who want to lead their lives respecting the environment and safeguarding the planet, even when they sit down to eat. According to some estimates, before an average meal arrives at the table, it has travelled over 1900 km; consequently it would be more economical and more reasonable to purchase local food, because we often use more energy bringing the meal to the table than we actually get from the food itself. One aim of the law is to ensure that 50% of the meals served in primary schools, high schools, universities, hospitals and barracks are sourced from the region's culinary heritage. This percentage does not discriminate against other Italian or foreign products, but promotes traditional local food, thus enabling consumers to make a range of informed choices that are sustainable in terms of price and environmental impact. Along the same line of thought are the urban allotments, which the municipalities or Padova and Treviso are spearheading. These small patches of municipal-owned land are being allocated for recreational gardening and food-growing and are granted as a free loan and not-for-profit to local citizens who apply for them. This initiative promotes socialising and the spread of horticultural knowledge and techniques, as well as constructive use of freetime, especially for the potentially weak such as the elderly or disabled. Organic farming
Organic food is grown with farming techniques that do not use chemical fertilisers and pesticides. The soil is fertilised only with organic compost and natural minerals in order to protect the environment.This type of agriculture is practiced extensively and it regenerates the land with crop rotation. It is thus a production system that is compatible with nature's processes as it respects water, earth, plants and animals. Organic food is also free of Genetically Modified Organisms (GMO). Organic agriculture and animal farms are therefore synonymous with quality, nature and guarantees as they are inspected and certified by bodies authorised by the Ministry of Agriculture and Forestry Policies and since 1 January 2009 by EU Council Regulation 834/07. Organic farmers and producers are required to use the EU organic trademark, which indicates that:
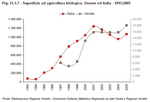
Organic farming is no longer a novelty or a fad here as Italy has once again retained its primacy in Europe in terms of surface area utilised, with over a million hectares and more than 50,000 farm businesses, ranging from production to processing; this trend is also confirmed by a continuous growth in the consumption of organic food, which saw an increase of 4.5% between 2007 and 2008 (Note 7). Nor has Veneto stood still: the surface area involved (both being converted and already dedicated to organic farming) recorded an increase of 37% between 2000 and 2005, and the number of farm businesses grew by 24% between 2000 and 2007. (Figure 11.1.7) and (Figure 11.1.8) This sector has proved itself to be highly motivated not only regarding the share of organic businesses, but also regarding the number of business initiatives, e.g. organic markets in squares, setting up direct farm marketing, supplying food to canteens, and specialised shops. Veneto is also one of the most active regions in this sector, as it ranks among the top four Italian regions for these indicators and it has experienced exponential increases in the last two years. (Figure 11.1.9) Quality products
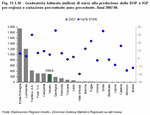
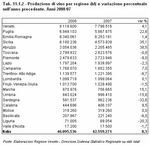
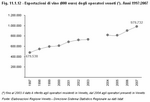
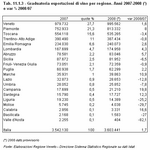
The "Made in Italy" label conjures up a series of factors such as production quality, tradition, identity, culture and quality of life. Set against this backdrop is Italy's gastronomic heritage, which is rich in flair and flavour. The uniformity promoted by globalisation, however, risks erasing some of Italy's most precious culinary delights. A major contribution to prevent this has been made by EU Regulation 2081/92, which was ratified to protect and safeguard the products that afford unique flavours thanks to their unrepeatable blend of human skill, climate and land; in recognition of this need, the EU has developed its quality marks.The Protected Designation of Origin and Protected Geographical Indication quality marks (in Italian DOP and IGP respectively) are awarded to agricultural products and food that are innate to a region or to a specific place. A product bearing the IGP mark has a characteristic or reputation that associates it with a certain place and guarantees that at least one phase in the production process was carried out in that place. A product bearing the DOP mark has characteristics which are proven to come only from the soil in that area and the skills of local producers. All the production phases for DOP products must be carried out within a certain area. The Traditional Speciality Guaranteed (STG in Italian) mark is used for products with special characteristics that are made with traditional ingredients or methods. The protection afforded by these quality marks gives unquestionable advantages, both for consumers and producers, as they provide guarantees of origin and production methods. They also send effective commercial messages about products with high value added and support farm businesses that make quality products, protecting their goods from sly imitations. Promoting typical food is therefore a way of safeguarding the cultural identity of an area and a people, preserving biodiversity as an environmental and social tool. Italy's extensive presence of typical products is also linked to the particular nature of the country and its history, which have enabled the creation and long-life of a huge variety of farming, culinary and cultural traditions; within the EU these traditions have been given first place in terms of quality certification, as it has 177 (Note 8) DOP and IGP products; France and Spain come in second and third respectively. Veneto has also made its own contribution with 26 products bearing the EU quality mark, a number that has recently risen thanks to the recognition of Casatella Trevigiana cheese (June 2008) and two types of radicchio, one from Chioggia and the other from Verona (October 2008 and February 2009 respectively). The number of certifications is not the only thing on the rise, as sales, production and turnover are also going up. According to Osservatorio Ismea, the main sectors experiencing major increase include the production of DOP and IGP fruit and vegetables (+35%), with apples spearheading this rise; meat-based products are a little more limited (+2%), and the production of cheese has fallen slightly (-1.5%). Analysis of turnover reveals a growth in 2007 of almost 8% in terms of production estimates, which has exceeded 5 billion euro in Italy; whereas national sales (i.e. excluding exports) recorded an increase of 4%, to reach a volume of 7.2 billion euro. Veneto ranks sixth among Italy's regions with 300 million euro and its turnover has grown by almost 5% on 2006. (Figure 11.1.10) Despite the economic crisis at the end of 2008, the sales of quality products have remained stable. We have already witnessed an increase in spending on organic products, but in 2008 family purchases of Italy's DOC wine are also estimated to have increased by 7% on 2007 (Note 9). The harvest of 2008 also produced higher yield than 2007, which enabled Italy to produce more than 46 million hectolitres (Note 10) of wine, an increase of about 8%. This production recovery is being driven mainly by Italy's southern regions, which suffered greatly during the previous agricultural year; Veneto however is still the undisputed leader of Italy's wine producers with 8 million hectolitres, up 4% on the previous year's harvest. (Table 11.1.2) Veneto's achievements do not stop simply at the amount of wine produced as it is also Italy's leading regional producer of DOC and IGT wine (2.3 and 4.8 million hectolitres respectively). The good news continued as Italy's National Committee for the Protection of Controlled Designation of Origin wines awarded the DOC designation to Prosecco and the Controlled and Guaranteed Designation of Origin (DOCG in Italian) to the area of Conegliano Valdobbiadene and Colli Asolani (Asolo hills). The DOCG will protect an area with a long tradition in wine-making and the DOC will safeguard all the other areas of Prosecco production. (Figure 11.1.11) Veneto also holds the Italian record for wine exports. Final figures for 2007 reveal that wine exports have increased every year for the last 10 years and are 8% higher than in 2006. Veneto exported wine for a total value of 979 million euro, making it Italy's top exporter with more than one quarter of total national exports. (Figure 11.1.12) and (Table 11.1.3) Veneto's achievements in wine exports are mainly due to sales in Germany, the United States and the United Kingdom. These top three purchasers account for more than half of the value exported and have further increased their demand. However, the top fifteen markets for Veneto wine exports increased from 2006- 2007, with particular increases in Eastern Europe (Russia +41.8% and the Czech Republic +49.2%), the Netherlands (+38.3%) and France (+21%). Provisional results for 2008 confirm Veneto's position with 995 million euro, a further increase of 1.6 percentage points in the value of wine exports, which is in line with the average national increase of 1.7. Wine and typical-product roads
Veneto's strong vocation for wine-making and the increasing importance of the link between territory and product mean that promoting typical products with culinary routes is an excellent idea; indeed today it is one of the most important types of emerging tourism.Along these routes, typical products become markers that communicate an area's production, cultural and emotional values to tourists, customers and consumers. Consequently, Regione Veneto introduced Regional Law L.R. no. 17 of 7 September 2000 "Establishment of wine and typical-product roads in Veneto", which promotes and regulates the creation of these routes, in order to add value to its major wine-producing and typical-product areas. These routes pass through areas with a high vocation for wine-making that are characterised by the vineyards and cellars of farm businesses, as well as by places of natural beauty and of cultural and historical importance in order to provide integrated food-and-drink tourism. These regulations govern both wines and typical regional products. Regarding wines, special focus has been placed on areas that produce the region's DOC and DOCG wines. However, the areas that make typical products other than wine, i.e. DOP and IGT farm and food products, are governed by Council Regulation (EEC) 2081/92. These are Veneto's Strade del vino, its wine roads:
(Figure 11.1.13) |
|
Data processed by the Statistics Office of Regione Veneto are collective property; reproduction of this material is authorised for non-commercial purposes only, provided the source "Regione Veneto - Regional Statistics System Management" is acknowledged.
English translation by the University of Padova Language Centre.


