13. Veneto and its provinces
|
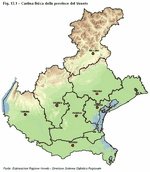
The seven provinces which make up Veneto provide an interesting point of departure for analysis and reflection on the regional territory as each province has its own particular morphological and socio-economic characteristics. The territory in fact covers: a high-altitude alpine range, a lower 'middle-level' mountain range, a number of broad hilly areas, a vast plain, the eastern shore of the largest lake in Italy and an extensive coastline with over 150 kilometres of sandy beaches. (Figure 13.1).
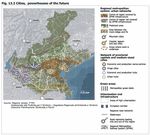
Of the seven provinces there are those which are more industrialised, others which tend more towards the service industries and others with a marked urbanisation. The territory is, however, largely given over to agriculture, and the open countryside limited to the hills and mountain areas. The areas of production extend around the central part of the region. The built-up areas extend over much of the plain beyond and even though the urban centres are large, urban sprawl is still common. (Figure 13.2). The figures demonstrate that, on the whole, the provinces of Veneto are in good economic health. The main characteristics and the differences in many aspects of their socio-economic realities will be described in the pages that follow, where population figures, the presence of immigrants, education, employment, production, tourism, wealth and mobility will be taken into account. The province of Padova can be considered the economic centre of development in Veneto. Its geographichal position at the centre of the region has, over the years, favoured the growth of industrial establishments and services throughout Veneto. The province of Verona has also been important in the development of regional wealth. Its growth has always been characterised by dynamism, in particular in the service industries, plus good levels of employment. It is an area which specialises in the food and furniture industries. Its position near Lago di Garda and the emphasis on cultural activities have also made it an important focus for tourism. Vicenza, apart from being the province with the highest export figures, is characterized by a healthy growth in the manufacturing sector and good levels in economic indicators. It also attracts tourists to its many mountain resorts and historical cities. Treviso, with its part flat and part hilly landscape, is a destination for tourists interested in the beauty of its many historical towns and cities. It is characterised by good economic growth with both a strong industrial presence and agricultural traditions at the same time. The agricultural sector is largely devoted to the production of wine and also includes a large number of artisan businesses. The province of Venezia possesses a particularly open type of territory and an open-minded population which draws both Italian and foreign tourists, who come not only to visit its provincial capital. It has much to offer the tourist from long-stay beach-style holidays to short weekend visits to the historical cities. Belluno, which is distinguished by its position in the moutain area, has good economic and employment indicators in an active production sector and specialises in optical and wood products. During recent years economic growth in the province of Rovigo has managed to emerge in spite of a more disadvantaged position in relation to the other provinces. The food sector, textiles and fashion, and artisan businesses constitute the backbone of the area's production industries. Tourism is also of major importance thanks to a focused campaign to promote and develop tourism in the area. (Figure 13.3). From a physical point of view, Belluno differentiates itself from the other provinces by being the only one which is entirely mountainous. Rovigo and Venezia have most of their territory on the plain, Padova and Treviso have both hills and plain, whilst Verona and Vicenza have the most varied territories with areas pertaining to each physical type. Demographically, the seven provinces of Veneto have been characterised by a general population increase over recent years, with significant differences within the region: Treviso shows the greatest population increase and, according to Istat (Italian National Institute of Statistics) data, will maintain this rate over the next ten years. This is due to the economic attraction of the area as well as natural growth levels which are boosted by the number of babies born to foreign residents in particular. It is interesting to note that the population of Belluno has increased slightly over the last five years and there is a reversal of the trend towards de-population normally associated with mountain areas. The population density of the region is 263 residents per square kilometre. The high density of the municipalities in the central band of the region contrasts with the low concentration in the mountain areas and in the lower Po valley. Padova is the most densely populated province of Veneto-the only one that exceeds 400 residents per square kilometre-followed by Treviso and Venezia. The low birth rate together with greater life expectancy mean that Veneto and Italy itself are territories with an ageing population. The process of ageing in Veneto appears to be slower than the national average: in 2007 there was a quota of 139 over-65-year-olds for every 100 0-14 year-olds, the lowest quota is 119 in Vicenza and the highest 204 in Rovigo. Foreign residents are part of every day life in Veneto and their number is growing, as can be seen in the larger cities, more industrialised areas, in schools and at work. In 2007 foreign residents amounted to 8.4% of the population in Veneto as a whole, a figure which is markedly greater than the national average (5.8%). Their presence is concentrated mainly in the more industrial provinces of Treviso, Vicenza and Verona (which together host 63% of foreigners) where it is easier to find work and better living conditions for those who have escaped the poverty and hardship of their countries of origin. The foreign residents come mainly from Romania, Morocco and Albania. Of note is the striking 59% increase in Romanians over the last year, and they are now the largest foreign community overtaking the Moroccans, the former largest foreign presence. The educational level in Veneto is constantly improving and the number of people in possession of a university degree or at least a school-leaving certificate is rising steadily. The rate of schooling in the region, i.e. the proportion of children aged 14-18 enrolled at secondary school is increasing and in 2007 exceeded 89%, with a peak of over 98% in Rovigo. Schools have also had to adapt to the growing presence of foreigners, requiring innovative and efficient measures to cope with this evolving situation. During the 2006/2007 school year the schools in Veneto admitted 12.3% of the foreign students in Italy and these accounted for 9% of total enrollments in Veneto. The lowest numbers were in Belluno where there were 6 foreign students to every 100, and the highest in Treviso where there were 11 to every 100, putting Treviso among the top 10 provinces in Italy to this respect. By completing their education to university level young people are better able to find suitable employment and achieve professional fulfillment. An increase in the number of students completing higher education, a trend which can be seen throughout the provinces, also signals a greater willingness of families to invest in the future of their children. Successful completion of a course in higher education has increased in Veneto over the last six years with a two-thirds rise in the quota of students graduating from the universities in the region. The year 2007 saw a total of about 20,500 graduates from different backgrounds and origins. Taking into account the residents of Veneto alone, figures from Padova indicate that in 2007 there were 6 new graduates for every 1000 residents over the age of 20, closely followed by Treviso with 5.7. With regards employment rates the provinces of Veneto are in the top positions for Italy as a whole, despite the current climate of uncertainty in the job market. The Unemployment rate in the area was 3.5% in 2008, noticeably lower than the national average of 6.7%. Veneto has managed to maintain its privileged position among the Italian regions, with the fourth lowest unemployment rate. The levels of unemployment are marginally higher in Verona where the rate is at 3.8%, the highest in Veneto. In spite of this rise in the employment rate, the figures are still far from the goals set at Lisbon which aimed at a 70% employment rate in the European Union by 2010. The province of Treviso is the closest to this target where in 2008 68.3% of the population aged 15-64 was in gainful employment compared with the regional average of 66.4%. This is in part due to the greater employability of the foreign residents and the capacity of the economic system of the province to absorb female labour. There is currently a widespread perception of the inadequacy of the means used to accurately assess the growth and wellbeing of an area. For any calculation of this type it is still held necessary to take the much disputed GDP of the area into account as an indicator of the region's value added in that it is the means most commonly used to describe economic status. For 2007 and 2008 there are only estimates available with regard to the creation of wealth at provincial level. In 2007 the greatest contributions to regional growth can be attributed to the provinces of Belluno, Rovigo and Vicenza. The estimates for 2008 show a general stagnation which is slightly more acute in the province of Treviso. Estimates for the agricultural sector in 2008 are positive for all the provinces while the construction sector shows a marked decline in the province of Verona. There is a general decline in the industrial sector throughout all the provinces. A slight improvement for the service industries can be seen in Belluno while in the other provinces the situation should remain stable compared to the 2007 figures. On 31 December 2008, active businesses in Veneto numbered 462,567, with a negative balance of -0.75%, which was the sum of 32,427 newly registered businesses and 35,884 cessations of activity registered during that year. The year 2008 recorded the lowest balance for the area over the past fifteen years, which is certainly a sign of the economic crisis that began during this same year. The situation is reflected in the high business turnover, also at a national level, with high rates both in start-ups, +7.0%, and in cessations, +7.8%, in the business system during 2008. Rovigo showed a rise of 1.5% in the number of businesses during 2008 compared to the previous year, next are Verona +0.8% and Venezia +0.7%, increases which are above the regional average compared to 2007. The provinces of Padova, Verona and Treviso maintained the highest level of active businesses in the region, confirming the strong business presence along the central axis of the territory. A measure of the strength of the business system may be seen in the degree of penetration into international markets, and foreign trade represents a good means for measuring this engagement with foreign markets. Vicenza is certainly the province with the greatest tendency to export with a rate which is almost 30 percentage points over the total for the region (followed by Treviso with 21 percentage points) and with a ratio between export value and value added of 64%. Veneto is the most important region for the tourism industry in Italy and has for a number of years been in top position for the number of nights spent by tourists in the region (more than 16% of the national total). During 2008 more than 14 million tourists visited the region accounting for a total of 60.6 million nights spent with more than half of these recorded in the province of Venezia and a further 21% in Verona. The transport system and its infrastructure are amongst the most important elements necessary to sustain both regional economic growth and the quality of life of the population. With this in mind mobility in Veneto is a key issue given its geographic and economic importance as a transport corridor for through-traffic and the nature of the sprawling urbanisation so characteristic of the central area of the region. Although the indicators for infrastructure in the provinces are good on average (five out of seven are above the national average), daily traffic congestion is a serious problem and indicates an inefficient road system unable to satisfy the demands of both domestic and commercial use. Padova has the highest number of circulating vehicles (almost 729,000) whilst Verona has the highest number of cars (around 548,000). The number of vehicles in use by adult citizens varies from a maximum of 98 for every 100 residents in the province of Vicenza to a minimum of 79 per 100 residents in the province of Venezia. |
|
|
|
|
|
Resident Population
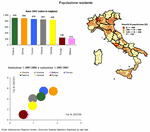
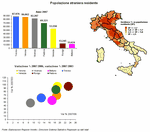
On 31 December 2007 the resident population in Veneto amounted to 4,832,340, an increase of more than 4% over the last five years and an increase of 1.2% on 2006. Padova, with a population of over 910,000, is the province with the highest number of residents and is also the most densely populated. The map shows how the central area of the region, which corresponds with the area of urban sprawl, is amongst the most densely populated areas in the whole of Italy, with a housing density which varies from a minimum of 287 residents per square kilometre to a maximum of 425 in Padova. Verona with 5.4% and Treviso 5.5% compared with figures for 2003 show the most marked increase, compared to 2006 they showed a 1.8% and 1.4% increase respectively. The growth is slightly less for Padova (4.4% compared to 2003 and 1.3 on 2006) and Vicenza (4% on 2003 and 1% on 2006). There has also been a population increase in Venezia, 2.7% compared to 2006 and 1% compared to 2003. Both Rovigo and Belluno also show an increase, albeit a slight one. In fact figures for Belluno appear to show a reversal in the trend towards de-population, a phenomenon normally associated with mountain areas. |
|
|
Old-Age index
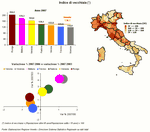
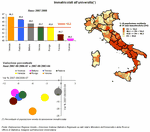
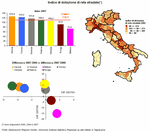
The figures for the old-age index in the region are very much influenced by the presence of foreign immigrants; it is in fact due to the higher birth rates among foreign residents compared to Italians that the index shows a general decrease in the average age of the population. This is clear from the chart which shows the provinces of Veneto with higher rates of migration (Treviso, Verona, Vicenza, and Padova) on a par in terms old-age index with the provinces in southern Italy, which are characterised, however, by a lower rate of migration. Treviso and Vicenza show a lower rate than that for the region as a whole (139 over-65-year-olds to 100 young people), 16 and 20 points circa. The figures are quite the opposite for Venezia, Belluno and Rovigo, which are markedly higher than those for the rest of Veneto (+26, +39 and +65 respectively). Furthermore a significant increase in the old-age index has been noted over the last year only in the provinces of Vicenza and Belluno (+1.2% and +1.0%), followed by a more limited increase in Padova and Venezia (+0.4% and +0.1%). The only province to record a negative variation (albeit limited) over the last year and the previous five years is Treviso (-0.3%). Furthermore, it is estimated that the increase in the ageing population in Treviso will be much more contained over the next ten years unlike the siuation in the other provinces. |
|
|
Foreign Residents
The quota for the foreign resident population is synonomous with mobility, changes in the fabric of society and the economic draw of the territory. It in fact influences many factors: the demographic structure and growth of the population, social and cultural stability and the available labour supply.The map shows quite clearly how the region, together with the rest of northern and central Italy, are the favoured destinations for migrants, albeit with slight differences between the provinces. The year 2007 was an exceptional year for migration into Italy and Veneto, due, above all, to the greater influx of Romanians following the entry of their country into the European Union. Ten thousand foreigners more than the previous year, for example, arrived in Treviso and about half of these were Romanian. In Veneto in 2007 the total number of foreign residents amounted to slightly less than 404,000. Treviso was the province with the highest proportion of foreigners, almost 88,000, i.e. 22% of the whole foreign presence in the region and with a greater impact on the population (10 foreigners to every 100 native residents). Between 2003 and 2007 there was a constant increase in the number of foreign residents in all the provinces. This is particularly significant in the data for Rovigo and Venezia where over the last five years the foreign resident-population has almost doubled. In Rovigo the increase over the past year is also particularly marked (+23%), followed closely by Venezia, Verona and Padova. |
|
|
Migration rate
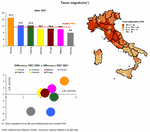
The migration rate is given by the ratio between net migration for that year and the average resident population, multiplied by 1000. Net migration is an expression of both entrance and exit mobility and is calculated from the difference between the total number of people registered and those annulled from the council registers in any given period. It is an appropriate indicator for expressing the mobility of the population and highlights the contribution made by the migrant component-not only the foreign migrants but also those from other parts of Italy-to the rise or fall in population figures.In 2007 the migration rate in Veneto equalled 11.4 per 1000 residents. The provinces which attracted a greater number of migrants, with figures above the regional average, were Verona (17%), Treviso (12.5%) and Padova (12.4%). Venezia, Rovigo and Belluno stood at around 10%. Vicenza had a migration rate of 8%, a result which is mostly due to the greater mobility in exit rather than the lack of attraction to the area. Compared with 2006 all the provinces present an increase in the migration rate, Verona in particular with 7 points above the others, whereas Treviso and Vicenza have fallen by over 5 points in the last 5 years, demonstrating a decrease in their capacity to attract migrants. Padova also shows a decrease albeit only a very slight one. The remaining provinces, and Verona and Belluno in particular, show a tendency towards an increase in the migration rate in the long term. |
|
|
Number of students enrolled in Higher Education
How many school leavers from Veneto decide to continue their education at university and then also manage to graduate? This analysis looks at the tendencies of young people from Veneto who decide to continue their studies in the higher education istitutions within the region and also those who decide to study elsewhere. Over the years, and in line with national levels, there has been a decrease in the number of students from Veneto who continue with their studies beyond secondary school. Immediately after the 2003/2004 reform there was a marked increase in enrollments with more than half of the region's nineteen-year-olds enrolling at university, since then there has been a noticeable decline. This is true for enrollments in general at the universities in the region and for numbers of students from Veneto who decide to study within the region or elsewhere. On the whole Venezia shows the greater tendency for students to continue with their education (46.3% of nineteen-year-olds) whilst Vicenza (40.5%) shows the lowest. The map clearly shows that Italy is divided into two parts in this respect; in Central and Southern Italy there is a greater tendency for students to enter higher education with indicators over 60% even. |
|
|
Graduates
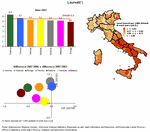
Given the demands of our constantly evolving society the possibility of attaining a high level of education is undoubtedly a key element which can effect the quality of life of an individual. If a local population has a good level of education and culture, then in macroeconomic terms this will be transferred to enterprises in the shape of qualified human resources.In 2007 there were circa 21,600 graduates from Veneto, equal to over 7% of the national total. The map of Italy clearly divides the country in two, demonstrating that the provinces in the Centre and South are in the top positions for the number of graduates per 1000 residents over the age of 20. This is due to the greater difficulty in finding jobs in these areas and hence the importance of acquiring the highest possible qualifications. In Veneto, the province of Padova takes first place on this account, its leadership due undoubtedly to the presence of its university, which is one of the most highly regarded and developed centres of higher education. This province provides a solid base for education and training and in fact has the highest numbers of new graduates per 1000 residents aged over 20. Compared with 2006 the indicator shows a decrease, in particular in the provinces of Rovigo and Padova, which have both lost half a point, but if we look back to 2003 the indicator seems to show an increase, albeit a small one. |
|
|
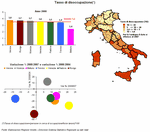
Unemployment rate
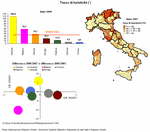
The year 2007 was a record one both in Italy and in Veneto, with the lowest unemployment rate (6.1% and 3.3% respectively) recorded over the last ten years. The average for 2008, however, influenced by the current global economic crisis, shows an inversion of tendency and rates have started to rise again. The unemployment rate in 2008 in Veneto amounted to 3.5%, still significantly lower than the national recorded average of 6.7%. The map clearly shows a divided Italy, with situations of hardship and difficulty increasing as we descend toward the Centre and South. Comparing Veneto provinces, Verona has the higher levels of unemployment at 3.8% and the lowest are in Belluno at 2.4%. Rovigo and, above all, Treviso are the only two provinces which show an inversion of tendency. Indeed, Treviso had a marked decline in unemployment compared with the previous year, falling from 3.9% in 2007 to 3.5 % in 2008. In the medium term, however, all the provinces in Veneto, with the exception of Vicenza, show a reduction in the unemployment rate. |
|
|
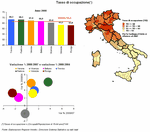
Employment Rate
In 2008 the number employed persons rose in Veneto by 2% compared with 2007. The rate of employment also rose, albeit still far from the target set at Lisbon of 70% for the European Union by 2010. In 2008 66.4% of the population in the region aged 15-64 were in gainful employment, a figure which is significanly greater than the national average (58.7%) and one in continuous growth in recent years with an increase of over 3% compared to 2004.Amongst the provinces of the region, Treviso and Padova hold the top positions, with 68.3% of the population of working age in employment, followed by Verona (67.4%), Belluno (66.9%) and Vicenza (65.4%). Venezia and Rovigo, on the other hand, are decidedly down on the regional average, with 63 employed people per 100 of working age. The provinces do show, however, a general trend of increasing employment levels compared to 2004, only Vicenza recorded a decrease of 2% on the previous 5 years. Padova and Verona, on the other hand, show the greatest increases, of 6.1% and 5.8% respectively. Compared to 2007, however, there are 3 provinces that have recorded a decline in the employment rate: Rovigo (-2.5%), Belluno (-1.4%) and Vicenza (-0.3%). In contrast Padova continues with its positive trend with an increase of 3.6% |
|
|
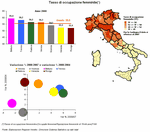
Female Employment Rate
Despite the increased presence of women in the labour market in recent years, the figures are still far from the target set at Lisbon in 2000 which set an average employment rate of 60% for women by 2010. In 2008 55.5% of women of working age in Veneto were in gainful employment. This figure is significantly greater than the national average (47.2%) and there has been a rise of more than 6% since 2004 and almost a 3% rise over the last year. Only Belluno appears to have figures which are near the threshold, even though the female employment rate recorded a decline of 2.5% compared to 2007. Treviso has reached 58.2%, followed by Padova and Verona, with over 56%. The lowest rates were recorded in Rovigo (52.1%), Venezia (52.3%) and Vicenza (54.2%). Vicenza is the only province to record a decrease in the rate of female employment in both the short and medium term. In all the others the trend is towards an increase compared with 2004, particularly in Verona and Rovigo where the percentage of women of working age rose by 10%. Besides Vicenza and Belluno, Rovigo also recorded a slight fall in female employment levels compared with 2007, while Padova and Treviso show the highest growth (6% and 5.4% respectively) |
|
|
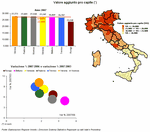
Value added per capita
The value-added per capita indicator represents the share of wealth produced, intended as the balance between output and intermediate consumption of the entire economy of a given territory which, on average, is each resident's due. This indicator summarises important information regarding the standard of living of the population and economic growth since it substantially effects both the quantity and quality of consumption. In 2007 the value added per capita of Veneto was 27,160 euro, which varied between the 27,773 of Verona and the 23,541 of Rovigo, all of which are higher values than the national average of 23,080 euro. Compared to 2006, Belluno appears to show the most significant growth in value added per capita (+3.3%), followed by Rovigo and Vicenza (+2.7% and +2.6% respectively). For the period 2003-2007, on the other hand, the provinces with the highest growth in value added per capita are Verona (+10.1%), Treviso (+8.9%) and Venezia (+8.2%), followed by the remaining four provinces with positive, but numerically lower, values (less than a 7% increase). |
|
|
Businesses
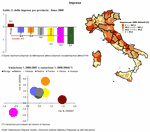
The analysis of a number of business-related indicators provides stimuli for reflection on the area of business as a whole. The level of industrialisation of a province in relation to the size of its population is given by the indicator of production capacity, calculated by the number of business to every 1000 residents. Padova, Verona and Treviso have the higher values, thus confirming their position as the economic leaders in the region; Rovigo also has a high value given by the high number of large-scale farming concerns on its territory. The balance, comparing the start-up rate of businesses with the cessation rate gives us information about mobility: in all provinces, apart from Rovigo, the number of new businesses set up in 2008 was less than those who ceased activity, above all in Padova, Belluno and Venezia. Finally, regarding business trends, two contrasting situations can be observed where in Rovigo in 2008 the number of active businesses rose by 1.5% on the previous year, while Belluno, on the other hand, was the only province to show a decline over the last year and over the previous 5 years. |
|
|
Exports
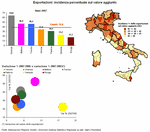
In a period of gradual economic integration, both in Europe and worldwide, it is important to understand the degree of receptiveness of a territory towards other markets and its propensity to export. One useful indicator for this purpose is the incidence of the percentage of exports on value added, expressed in euro at current prices. In Veneto in 2007 exports accounted for 39% of value added. Vicenza remains firmly in first place in the rankings for exports in general; with a share of 29.6% it demonstrates a capacity for export of 64% (it is in fact second to Siracusa in the national rankings). Vicenza is followed by Belluno (47%) and Treviso (46%) whilst Padova and Verona have around 30%. Venezia and Rovigo show a capacity for export of 23% and 18% respectively. All the provinces have recorded an increase compared to figures for 2006. Venezia distinguishes itself from the others with an increase of 18% on the previous year, followed by Belluno (+11.5%). The general figure for the region as a whole is 9%. Over the last five years, there has been 32% growth in Veneto, which was particularly high in Belluno (52%), Vicenza (41%) and Padova (37%). |
|
|
Utilised Agricultural Area
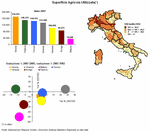
The Utilised Agricultural Area (UAA) is the area actively utilised for the production of crops; it includes those areas under arable farming regimes, forestry, meadows and permanent pastures, vegetable gardens and orchards. Verona has the most UAA with over 170,000 hectares; Belluno the smallest with slightly more than 34,000 hectares. The only provinces which have shown a diminished UAA between 2005 and 2007 are Belluno (-9.1%) Rovigo (-5.9%) and Padova (-11.5%). Between 1982 and 2007 there was on average a 10% loss of UAA. Along with the decrease in area for farming, the number of farms in the region has also been in constant decline, losing on average 34% of farms between 1982 and 2007. The "double speed" decline phenomenon i.e. the number of farms declines faster than the UAA, has given rise to farms with greater UAA. Farms in the provinces in the North West have the highest values for UAA with peaks of over 30 hectares, mainly due to the cultivation of cereals whilst the areas with the lowest levels, of less than 4 hectares, are the provinces of Liguria, those in central and southern Italy, and also Vicenza, Treviso and Padova. |
|
|
Tourism
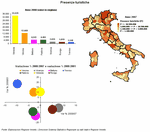
In 2008 60,607,455 nights were spent by tourists in Veneto, mainly in the province of Venezia (over 33 million) and Verona (over 12 million). The provinces with the lowest number of nights spent were Treviso and Rovigo. Through analysis of the differences in percentages, it emerges that in 2007 only Rovigo and Vicenza showed an increase in the number of nights spent, accompanied by an increase in the number of arrivals. It is important to recall in connection with these figures that in May 2008 Bassano hosted the annual meeting of the "Alpini" (the Mountain infantry corps of the Italian Army) and there were other cultural initiatives in the area to celebrate the fifth centenary of the birth of Andrea Palladio, which also attracted an influx of tourists. In Belluno, Padova, Treviso and Venezia there was a decrease in both arrivals and nights spent, whereas many tourists visited Verona but they stayed on average for a shorter length of time. Compared to 2001, Treviso on the other hand, showed an increase of 18%, Venezia and Verona 10%, while the other provinces are experiencing a decline, especially Belluno (-13%) and Padova (-9%). In spite of this, the number of visitors to the region has increased, a sign of the growing interest in what the region has to offer, but the average stay is shorter. |
|
|
Rate of Inbound Tourism
The rate of inbound tourism is an indicator which measures the effect tourism has on the demography of a region and is useful in understanding the effective capacity of an area to sustain the extra burden. It is calculated as a ratio of the number of nights spent, divided according to the number of days in the referred period, in this case a year, and the resident population of the territory in question, multiplied by 1000. In this way we arrive at the average number of nights spent recorded on a daily basis in the area per 1000 residents. In 2008 the rate in Veneto was 34.4 nights spent per day every 1000 residents. Venezia recorded the highest levels with 109 nights spent, followed by Belluno with 58 and Verona with 39. Figures for all the other provinces are lower than the regional average. In both the short and medium term, all the provinces show slight variations. The exception to this is the province of Belluno, which registered a significant decline compared with 2001 (-10.3), while Venezia registered an increase of 6 nights spent per day per 1000 residents on the same period. |
|
|
Road Quality Indicator
This indicator describes the accessibility and quality of the road network. It includes an analysis of the infrastructure i.e. type of road (motorways, A-roads, highways etc.), the quality of the network in terms of travel time (number of lanes, access, speed limits etc.) and other important factors.All of these factors, each with different weightings, are important in defining the final value of the indicator. Each single value is then compared with standard Italian value given as 100. In Veneto the only provinces which have registered values below this standard are Rovigo (circa -8 points) and Belluno (circa -17 points). The other five provinces, albeit with differing values, are above the national standard. During the 2007/2000 period Belluno is the only province that shows a sharp decrease (circa -15 points), in spite of being the province with the highest rise on the index between 2007 and 2004. All the other provinces, apart from Rovigo, have all registered an increase of around 8 points, although Treviso, Verona and Padova each lose 3 points during the same period. |
|
|
Rate of Circulating Motor Vehicles
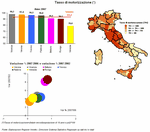
The number of vehicles circulating in a given territory, especially when compared with population figures and the road capacity for that territory, is an important factor in any description of the effect that the motor vehicle has on the environment. Vehicle density is one of the most critical elements for cities. The consequences of intense traffic are well known: air pollution due to pollutants produced during the combustion process; traffic congestion and road blockages; parking problems in urban centres; and greater probability of accidents, to name just a few of the most common issues. Despite all these negatives repercussions, more and more people are using cars and other vehicles. The most recently available data from 2007 demonstrates how the number of circulating vehicles in Veneto has increased, reaching a total of 3,747,192 units, of which 2,859,050 are cars. Motorisation density also continues to rise: in 2007 in Veneto there were 83 vehicles per 100 adult residents. Vicenza is in top position with 98 vehicles per 100 adult residents, followed by Verona and Treviso. For these provinces, with their high values, the margin for growth is contained and the rate over the last five years stands at around 4%. More consistent growth, on the other hand, has been registered in the provinces of Rovigo and Belluno of 8.6% and 8.1% respectively. |
Data processed by the Statistics Office of Regione Veneto are collective property; reproduction of this material is authorised for non-commercial purposes only, provided the source "Regione Veneto - Regional Statistics System Management" is acknowledged.
English translation by the University of Padova Language Centre.


