2.1 Imports and exports
|
In 2007 Veneto's exports exceeded 50,557 million euro, a 9.2% increase on 2006, while its imports exceeded 39,844 million euro, a 7.7% increase on the previous year. The region's trade surplus was more than 10,713 million euro, up 15.5 percentage points on 2006. With 13.9% of the national total, Veneto is Italy's second leading exporting region behind Lombardia (28%) and ahead of Emilia Romagna, Piemonte and Toscana.
Between 1991 and 2007, Veneto's exports grew at an average CAGR (Note 1) of 8.7%, higher than the Italian average of 7.9%; between 1991 and 1997 CAGR was 14.1%. However, from 1997-2002, its average annual growth rate more than halved to 6.3%, dropping again to 4.9% between 2002 and 2007. (Figure 2.1.1). This phenomenon is also clear in the region's share of national exports, which rose progressively from 12.3% in 1991 to a maximum of 14.8% in 2002; the figure then settled at 13.9% in 2007, a share similar to that of the late 1990s. (Figure 2.1.2). In some ways, Veneto's import trends reflect those of its exports. In the long-term, imports also have an annual average growth rate above the national average (+8.4% compared with +7.5% between 1991 and 2007). Here, however, Veneto's growth was slightly above that of the entire North East (CAGR +8.9%). The average annual growth rate of Veneto's imports, like that of its exports, has progressively fallen over time: it went from 10.8% between 1991 and 1997 to 8.3% between 1997 and 2002, then to 5.7% between 2002 and 2007. Exports also fell at national level, although variations in the average annual growth rate are far more modest: growth dropped from 8% from 1991-1997 to 7.2% from 1997-2002, but rose to 7.4% in the most recent five-year period.
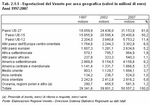
Overall Europe accounted for almost three-quarters of the value of Veneto's exports in 2007: EU15 accounted for more than half; 11.4% went to the 12 countries that have joined the EU since 2000; 6.5% to other Central European countries; and 5.2% to other Western European countries. The Americas accounted for 11.9% (North America 8.2%, Central and South America 3.7%), Asia 10.6%, Africa 3%, and Oceania 1.1%. (Table 2.1.1).
The last ten years have seen major changes in the destination of Veneto's exports. The share going to Europe has grown, but there has been a certain readjustment in the areas, with the share going to EU15 countries falling and that of new Member States in particular rising. Exports to the Americas fell in relative terms; the share going to Asia fell slightly (from 11.2% to 10.6%, with an increase in the share to the Middle East and Central Asia, and a fall in that to the Far East), while the share going to Africa and Oceania rose slightly. In 2007, Veneto exported to 177 countries on five continents. Germany, which has always been a major trading partner, accounts for 13.3% of the total with more than 6.7 billion euro; its share however has dropped by almost one third in the last ten years. France ranks as the second leading recipient of Veneto products, followed by the United States, Spain and the United Kingdom. Austria is the sixth biggest importer of Veneto products; seventh is Russia, which has almost doubled its share of imports, from 1.8% to 3.4% of the total, since 1997 when it ranked twelfth. In 2007, the growth rate for Veneto's exports to Russia was 31.1%. Romania, Switzerland and Belgium (Note 2) complete the top ten end-markets for Veneto products, a ranking that sees the United States as the only non-EU country. China ranks fifteenth with 1.7%, behind the Netherlands, Poland, Greece and Turkey, but ahead of five other European countries (Croatia, Hungary, Czech Republic, Sweden, Slovenia and Portugal). Exports to China rose considerably in 2007 (+15.2%) thanks to a major rise in exports of metal, mechanical, leather, and optical and electronic products. Exports to Romania, however, fell by 3.9% with a sharp fall in foreign turnover in the fashion sector. The key role of Europe in trade with Veneto is also illustrated by Veneto's imports. More than half of Veneto's imports come from EU15 countries, 11.6% come from new EU Member States, 4.7% come from other Central and Eastern Europe countries and 3.7% from the rest of Europe. Europe's overall share is 71.2%. East Asia is the second largest macro-area from which Veneto imports; its share was 6.6% of the total in 1997, but it had risen to 12.6% by 2007. The Americas accounted for 6.1%, followed by Africa, other Asian countries and Oceania. More than half of Veneto's imports come from a mere seven countries: Germany, China, France, the Netherlands, Austria, Spain and Belgium. These countries are followed by Romania (3.3%), the United States (3%), the United Kingdom, Switzerland and Libya, while another fourteen countries vaunt shares of more than 1%. China's rise to prominence stands out in that in 1997 it ranked twelfth in the league of exporters to Veneto, yet by 2007 it had risen to second place with a 7.3-fold increase in its exports to Veneto. In 2007 the value of Chinese imports exceeded the 3-billion-euro mark for the first time, rising by more than 22 percentage points on the previous year. These strong trends in imports from the Far East have occurred in all of Veneto's main import sectors, with notable rises in the fashion, mechanical, and optical and electronics industries. Other countries that saw their imports to Veneto rise sharply from 1997-2007 include Slovakia (4.8-fold), Ukraine (4.6-fold), India (3.6-fold), Poland (3.6-fold), Turkey (3.5-fold), and Libya (3.2-fold). In 2007 Veneto experienced a notable drop in imports from Romania (-7.3%), which was due to the decline in the supply of fashion products. When this drop is combined with the one in Veneto's fashion-sector exports towards Romania, this clearly suggests that there has been a major decline in the production of Veneto businesses that had relocated there. Indeed these businesses have migrated further east into Europe (Ukraine, Bulgaria, and Moldova) and to Asia (China).
Further insight into Veneto's trade flows can be garnered by cross-referencing exports and imports by sector and geographical macro-area.
Two of Veneto's specialised sectors (Note 3), i.e. leather goods and manufacturing, which includes furniture and jewellery, reveal high export specialisation in all geographical areas. Non-metal mineral products and electric, electronic and optical machinery and equipment also prove to be specialised in all areas; both of these sectors have the highest specialisation indices for the Americas. Other regional export specialisation sectors, including agricultural and fishery products, export to other European countries: the former mainly to Central and Eastern Europe and the latter to EU15 countries. Europe is also a major importer of Veneto textiles and clothing, wood and wood products (as is North America) as well as mechanical machinery and equipment. A more detailed look at sector/geographical area combinations reveals major pockets of specialisation in businesses where Veneto exports are unspecialised overall. In particular these regard: mining industry products being exported to countries that have recently joined the EU; rubber and plastic products exported to the whole of Central and Eastern Europe; metals and metal products towards Central and Eastern Europe and North America; vehicles exported towards Latin America; and information, professional and business products to non-EU countries in Central and Eastern Europe. Regarding Veneto's specialised imports, high specialisation indices can be found in traditional industries (textiles and clothing, leather and footwear, wood and other manufacturing) and in the metalworking industry (metals and metal products, mechanical machinery and equipment) for Central and Eastern European countries (EU and non-EU) and for "other areas" (most notably for southern Mediterranean countries). These results are mainly because Veneto businesses have relocated production to these areas.
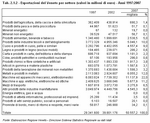
We have already mentioned that over the last ten years, six sectors account for just under three-quarters of Veneto's exports (Note 4). The mechanical sector has maintained its leading position for export volume, which only in 2002 dropped slightly below 20%. However, there has been a major shake-up in the rankings behind the mechanical sector. In 1997, metals and metal products ranked sixth in terms of export volume, but by 2007 they had increased their share by 4.8 percentage points, from 7.2% to 12%, to lie in second place. The electric, electronic and optical machinery and equipment sector rose from fifth place in 1997 to third in 2007 with 11.2%, an increase of 3 percentage points. These performances, however, contrast with those of Italy's traditional industries: textiles and clothing, leather, footwear and leather goods, and other manufacturing. From 1997-2007, their share of Veneto's exports fell by almost 10 percentage points, dropping from 37.2% to 28%. Textiles and clothing fell from third place for export volume in 1997 to fourth place in 2007; its share stands at 10% of the regional total, down almost 3 percentage points in ten years. The leather, footwear and leather goods sector dropped from fourth to fifth place with a fall of 2.2 percentage points (9% of Veneto exports in 2007). The aggregate of the "other manufacturing industries", which includes furniture and jewellery, accounted for about 9% of Veneto exports in 2007, dropping from the second place it held in 1997 to its current position of sixth, with a loss of 4.2 percentage points.
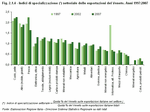
Figures for the remaining sectors between 1997 and 2007 reveal a rise in the share for vehicles (from 5.5% to 6.5%) and for food, beverages and tobacco (from 4.6% to 5.0%); falls were felt in chemical products, artificial and synthetic fibres and non-metal mineral products. Particularly important were figures for vehicles in 2007, which rose by more than 30% in one year; this was mainly due to the ship-building sector, exports for which more than doubled, from 374.5 million euro in 2006 to more than 813 million euro in 2007. (Table 2.1.2). More detailed analysis of exports reveals that some specific product classes play a key role in Veneto exports. In 2007, six categories accounted for more than 30% of the total: special-purpose machinery, clothing, general-purpose machinery, furniture, footwear, eyewear and optical instruments. An important role is also played by sectors such as hides and leather, jewellery and goldsmithery, plastic goods, machinery and equipment for the production of mechanical energy, other metal products and machine tools. In total these 13 sectors accounted for 52% of Veneto's exports in 2007. The share of Veneto's low-tech exports has dropped considerably over the last five years, yet this sector continues to account for more than one third of the total (35.9% in 2007 compared with 42.7% in 2002 and 44.7% in 1997). However the share lost in the low-tech category was recovered by the intermediate technology category (medium-low and medium-high tech). In 2007, medium-high tech products accounted for more than one third of Veneto's exports (33.9% compared with 32% in 1997 and 30.3% in 2002), while medium-low tech products accounted for more than one fifth of the total (20.4% compared with 15.4% in 1997 and 15% in 2002). This overview rounds off with high-tech products, whose share declined in the last five-year period in contrast with a considerable increase in the previous period (8% in 2007 compared with 9.9% in 2002 and 6.1% in 1997). (Figure 2.1.3). When compared with the national total, Veneto seems highly specialised in exporting leather and leather products (a specialisation index of 2.25 in 2007) and in fishery and fish-farming products. Veneto is also fairly specialised in electric, electronic and optical machinery and equipment, textiles and clothing, paper, publishing and printing, not to mention wood and wood products. However, Veneto's exports are highly unspecialised (indices below 0.50) in chemicals and fibres, public, social and personal services, miscellaneous goods and in the entire energy supply chain, i.e. energy products, energy minerals, electricity, gas and water. These sectors, however, account for very low shares of national exports; the only real exceptions are chemicals and fibres, and energy products to some extent. (Figure 2.1.4). It is worth taking note of Veneto's performance in exports of electric, electronic and optical machinery and equipment, a sector in which it was unspecialised ten years ago, but in which today it has a respectable specialisation (index of 1.3 in 2007). Specialisation in paper, publishing and printing, as well as in textiles and clothing, has also increased and although specialisation in fisheries and fish-farming has dropped, it is still high. Components of export growth
A study was conducted in order to assess export growth between 1997 and 2007, with regional specialisation being measured on the basis of exports in 1997 (Note 5). Export growth between 1997 and 2007 was divided into three components. The first is the structural component, which measures the impact of the difference between the sectoral structure of the region and of Italy. The second is the differential component, which captures the proportion of the difference between Italy's and Veneto's export levels, sector by sector, assuming that the structural composition of the regional economy is the same as the national one; this component reflects the different abilities and attitudes of businesses and the region when exporting abroad by comparing industrial activity type. The third is the allocative component, which captures the covariance between the structural and the differential component, which in turn indicates the region's degree of specialisation in sectors where exports are above the Italian average (or unspecialised in sectors that export less than the national average). In other words, the allocative component is positive wherever regional performance is better than the national one, meaning that Veneto specialises in this sector.The results of this analysis make interesting reading and highlight the determinants for Veneto's less-than- satisfactory export figures in recent years. Veneto grew at a higher rate than the national average in the ten-year period considered (+72.5% compared with +70.1%). The study shows that a considerable surplus in the differential component (+19.4%) enables Veneto to compensate for its deficit in both the structural component (-12.9%) and the allocative component (-4%). In other words, the region specialises in export sectors that grow slower than the national average (in parČticular, fishery products, textiles and clothing, leather and footwear, wood, and other manufacturing). Vice-versa Veneto is unspecialised in export sectors where growth is increasing most (i.e. minerals and energy products, chemicals, vehicles and electric energy); Despite this, Veneto still did better than the national average over the ten-year period because its businesses outperformed Italy's sector by sector. (Table 2.1.3). To conclude, the analysis results confirm that the recent trend in Veneto's exports is due to the region's sectoral composition. This factor is aggravated by its specialisation in some low-tech sectors, which by tradition are strongly geared towards exports, but whose capacity for further growth on international markets has nosedived in recent years. The negative impact of Veneto's industrial structure, however, is mitigated because Veneto businesses are able to penetrate international markets with their exports, sector-by-sector, more effectively than their Italian counterparts. Veneto businesses that set the export system rolling
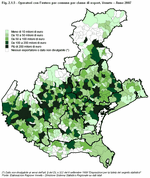
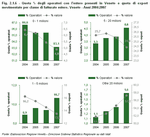
(Figure 2.1.5) In 2007 Veneto's exporters sold more than 27,000 units on international markets. In recent years, larger businesses have increased their share of overall value in the region's exports, which confirms the importance of business size on the world market. Businesses that manage to compete on the global market have become bigger and have optimised their financial structure, taking advantage of the long string of low interest rates that are thanks mainly to the introduction of the euro.In the last four years, the number of companies in the region declaring more than 20 million euro of exported goods has increased by 92 units (from 356 in 2004 to 448 in 2007), and their contribution to the share of exports has risen from 51.7% to 57.2%. Last year, 58 businesses had an export turnover of more than 100 million euro, 12 more than 2004. However, the number of smaller businesses (i.e. those exporting less than 5 million euro of goods) continues to fall; between 2004 and 2007, their numbers dropped by about 15 percentage points. Small businesses exported 18.4% of the regional total in 2007 (22.6% in 2004) despite accounting for almost 94% of Veneto's businesses. (Figure 2.1.6). This trend occurred throughout the geographical areas of the international markets, but peaked in emerging markets. Furthermore, data analysis confirms the correlation between market proximity and an exporter's turnover-size class: on average smaller businesses were more present on nearer markets, whereas larger businesses were relatively more present on markets further afield. (Table 2.1.4). An exporter's presence and responsiveness on international markets can be calculated by the average number of markets they serve. In the last four years, this indicator has risen slowly, but constantly (from 5.2 markets per exporter in 2004 to 6 in 2007), which suggests that Veneto's exporters have branched into more countries. The average number of markets served per exporter varies according to business size and ranges from 2.6 markets for businesses that have exports of less than 1 million euro to 45.4 for businesses that have exports of more than 20 million euro. Larger businesses, which export more, have more resources to invest in commercial and distribution networks abroad, a hallmark that enables them to promote their products on international markets more effectively and to depend less on indirect export channels. Note that a very high number of businesses, especially smaller ones, operate in just one country; in 2007 these businesses accounted for 51.6% of Veneto's exporters. |
|
Data processed by the Statistics Office of Regione Veneto are collective property; reproduction of this material is authorised for non-commercial purposes only, provided the source "Regione Veneto - Regional Statistics System Management" is acknowledged.
English translation by the University of Padova Language Centre.


