1.1 The current situation (Note 1)
|
Yes, there is a crisis, but as John Fitzgerald Kennedy said: "When written in Chinese, the word "crisis" is composed of two characters. One represents danger, and the other represents opportunity".
 The dangers that derive from the current situation are clear to all and, in terms of employment and production, as well as socially, we are already suffering the consequences. Less attention, however, has been given to the opportunities for the future that may spring from dark times like these. Italy's President Giorgio Napolitano himself has said: "We can limit the economic and social consequences of the global crisis for Italy, and even create the premises for a better future, if we leverage on our strengths and on the most vital energies at our disposal". This hope is founded on the results that Italy has been able to produce when it has faced serious crises in the past: President Napolitano recalled the terrible aftermath of the Second World War and later terrorism, as well as the crisis of the lira in the 1990s before the euro was launched. But in order to find solutions for this difficult situation it is necessary to take a step back and understand the phases that have brought us to this point. Until a couple of years ago, the world economy was experiencing an exceptionally long period of growth, with milder oscillations in business cycles compared to earlier periods and low and stable inflation rates in all the major economies. Thanks to the high growth rates of the economies of the largest emerging countries, the prospects for growth appeared stable and certain in most forecasts. This faith was gradually eroded by the events which took place between the summer of 2007 and last autumn; then it collapsed rapidly in the last months of 2008, giving way under a major increase in market volatility and economic activity in general and precipitating into widespread uncertainty about the future. After August 2007 the beginning of a recessionary period was already clear, though initially moderate. It was due to the effects of the American subprime (Note 2) crisis and to the structurally imbalanced condition of the United States, where it first erupted with the bursting of the housing bubble followed by a latent credit crisis. In this context, as the months went by, there was a worldwide fall in the value of real estate, restrictions on credit conditions, and a decline in the disposable income of families due to the energy and food-price hikes, and a shrinking of wealth because of the fall in share prices. All these factors played a role in slowing down domestic demand, but also in the decline in international trade, which was accompanied by the weakening of the dollar. The bankruptcy of the Lehman Brothers in September 2008, the worries about the solvency of other financial institutions, and the fear of a collapse of the financial system greatly intensified the crisis; from this followed heavy losses on stock markets around the world, a further tightening of credit conditions, and a decline in business and consumer confidence. Governments and central banks reacted in a coordinated fashion at international level (Note 3), by ensuring the flow of credit to financial institutions and to economies, by increasing guarantees on bank deposits, and by strengthening the equity of financial brokers in trouble. Measures of this kind (Note 4) were also taken in Italy. These actions avoided the paralysis of the financial markets. The deepening of the financial crisis found the economies of developed countries in a slowdown; these economies, however, had already been weakened by the steep increase in the prices of raw materials in the preceding months. Repercussions began to be seen in the emerging economies, which had appeared to be immune until autumn 2008. For some of them, the International Monetary Fund (IMF) is expected to intervene to combat the flight of capital, their difficulties in refinancing debt and tension in the foreign exchange markets. Alongside the deterioration of the global context, the trend of economic expansion in the euro area continued to slow down throughout the year. The growth in credit, even though still robust, slowed noticeably. Today (Note 5) the International Monetary Fund estimates that the intensity of recession for developed economies will be the greatest since the era of the Second World War. For 2009 experts predict a decline of 1.3% worldwide and of 3.8% for the economies that are considered advanced (Note 6). (Figure 1.1.1) An overall decline in output of nearly 6% is forecast for advanced economies, making the current recession comparable to the serious crises of 1974-1975 and 1980-1982.(Figure 1.1.2) and (Table 1.1.1) In the fourth quarter of 2008 all the major industrial countries experienced a slump in production. The most acute decline was recorded in the United States, -6.3% of GDP compared to the previous quarter, reflecting a sharp reduction in private consumption, a notable slowdown in exports and a persistent regression in investment in housing. In the last part of the year economic activity weakened further: employment fell by 1,950,000 in American non-agriculture jobs between August and December 2008; the rate of unemployment rose to 7.6% in January 2009; and consumption demonstrated a limited sensitivity to the increase in disposable income caused by the sharp decline in the cost of energy. Japan was hit earlier by the recession despite its marginal stake in the US financial crisis. Its variation in GDP was already negative in the second quarter of 2008. The contraction continued in the second part of the year; it was milder during the third quarter, but much more severe in the last of 2008. The cause is to be found principally in the global slowdown that, on the one hand, reduced foreign demand and, on the other, caused a rapid appreciation of the yen in respect to the dollar. This resulted in negative net exports in the third quarter, which was followed by a real collapse. In this period there was a significant reduction in private non-housing investment, which is tied tightly to the dynamics of foreign demand. (Table 1.1.2) Emerging economies, strongly characterised by an export-led model of development, were very quickly affected by the dynamics of the recession, highlighting the fragility of a model that is marked by its excessive dependence on foreign trade. The first to feel the effects were countries with strong ties to the United States, like those in Latin America and Mexico. The repercussions then began to be seen in Asian countries, which, until the autumn of 2008, had appeared to be immune: Chinese production and trade experienced a slowdown. At the end of 2008 a decline both in the flow of China's imports and exports was recorded; furthermore a slowdown in investment caused an increase in unemployment and influenced domestic consumption negatively. Raw materials
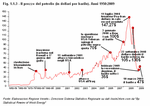
The intensification of financial turbulence and its transfer to the real economy have been accompanied by a continuing decline in the prices of crude oil and of other raw materials, which began in the summer. The fall in demand, which was tied to the recession in the industrialised countries and its spread to emerging economies, combined with a drop in the speculation that had fuelled the peak in prices at the beginning of the summer. Oil prices continued to fall in the final months of 2008: in the fourth week of December the price was around 35 dollars (down from its peak of 143 dollars in July). The recovery of commodity prices in the first months of 2009 is not yet persistent enough to bring about an end to the current critical phase in the near future. According to the prices of futures, the price of West Texas Intermediate oil (WTI) should recover in 2009 due to the gradual reduction in excessive inventories. Non-energy raw materials have also been influenced by the changed conditions in financial and real markets and they experienced consistent reductions in the last part of 2008. According to The Economist indexes, agricultural and industrial raw materials saw respective declines of 27% and 39% in the fourth quarter compared to the July-September quarter. (Figure 1.1.3). The dollar
The rapid deterioration of business cycles worldwide, and in the euro area in particular, together with the greater uncertainty of how the situation will develop, has caused a profound reordering of the portfolio of international financial institutions. We have therefore witnessed a slump in the prices of all investments that are considered risky, with a "flight to safety" that has favoured state securities, in particular those of the US Treasury, whose yields have been reduced significantly. The effect of this reordering has not penalised the dollar: in fact it has supported it. Paradoxically, though the United States is the epicentre of the crisis and, despite its large public deficit (which will increase in the near term), it is perceived to be a refuge. The rapidity and intensity of the Federal Reserve's adjustment of interest rates, as well as the huge fiscal stimulus package, has probably created expectations of a quicker recovery than in the euro area, where the introduction of monetary and fiscal measures has not been perceived to be as timely. (Figure 1.1.4).
In Europe, too, 2008 closed with negative growth in GDP in the last quarter. The principal reason for this slowdown can be traced to the fall in credit to firms and consumers as a consequence of tumbling confidence in the solvency of the financial institutions involved in buying toxic investments. The most restrictive conditions had a negative effect on the investment plans of firms and household consumption, causing a decline in the housing market as well. It also caused a slump in trade, in which Germany and Italy were the most penalised, as their economies had based the preceding phase of expansion on foreign demand to drive their economies more than others had.
The German economy has been greatly harmed by the crisis, which caused a significant decline in wealth in 2009. In France, in the October-December 2008 period, the decline was relatively mild in that slightly positive growth was recorded in the third quarter, in contrast with other leading countries. In Spain, where in recent years economic growth has been based primarily on consumer spending and a construction boom, GDP growth fell in the third and fourth 2008 quarters. (Table 1.1.3)
In the fourth quarter of last year the recession deepened in Italy, as it did throughout the euro area. Overall GDP declined by 1% in 2008, but what is more troubling is the 2.9% fall that was recorded in the last quarter of 2008 in respect to the same period of the preceding year.
The index of industrial production fell by 3.3% in 2008 compared to 2007, but if the month of February 2009 is compared with February 2008 it fell by 20.7%. The index of industrial orders follows a similar pattern, falling by 3.2% annually, yet it plummeted by 32.7% from February 2008 to February 2009. The quarterly changes in these indicators are also all negative. Economic growth felt the effects of the markedly negative figures for both domestic and foreign demand. Concerning foreign demand, exports have fallen over recent months, reflecting particularly the tightening of European export markets, especially in Germany; falling exports is combined with a significant slowdown in the emerging economies, which has led to a slump in the flow of trade. Investment has felt the full impact of the economic crisis. Declining profitability, more expensive terms of financing and unfavourable expectations have had a negative effect, especially on investment in production enterprises. This uncertainty had caused a reduction in stock, which has also contributed to the drop in GDP. Household spending on consumption in Veneto fell again in the last quarter of 2008. As can be imagined, the obstacles caused by the credit market have limited the purchase of durable goods in particular, while the spike in the cost of living recorded in the first semester of last year was especially unfavourable for purchases of non-durable goods. On the one hand, the marked cyclical decline of the Italian economy was caused in large part by the steep losses in the industrial sector. The second half of 2008, in particular, was one of the most intense periods of cuts in production in recent manufacturing history. In the second half of 2008, the service sector experienced a clear decline in its growth. Measured using the most recent national figures available, the variations of value added in constant prices were in slight decline in both the second and third quarters of 2008. The climate of confidence in Italy
In the wake of falling exports, investments have also weakened further, while the uncertain prospects for demand may further reduce the desired level of inventory in warehouses, pushing firms towards more cuts in production. Business confidence fell to record low levels at the beginning of 2009, feeling the weight of another decline in domestic and foreign orders. The evaluations of businesses concerning the level of inventories and the short-term prospects for demand and production remain unfavourable. After a pause at the beginning of the year, conditions for access to credit have once again tended to worsen for firms. According to estimates by ISAE, Italy's Institute of Economic Study and Analysis, industrial production is expected to contract by a further 3.8% in the first three months of 2009 in the wake of a steep decline at the end of 2008; given the trends that are emerging from quarterly surveys, it is probable that the decline in manufacturing will continue into the second quarter. As for other sectors, ISAE studies highlight a slowdown in construction and negative trends in market services. According to ISAE, overall consumer confidence was found to be stable, even though particularly cautious. After months of decline, the consumer confidence index leapt to 104.9 in April, its highest since December 2007. Analysing the features of this climate it reveals that, over the course of 2008, opinions about individual circumstances have shown signs of holding up, unlike the opinion about the general economic climate. The trend in inflation has probably favoured the improvement in the last period. (Figure 1.1.5), (Figure 1.1.6) and (Table 1.1.4)
The Prometeia research institute estimates stagnation in the GDP for Veneto in 2008, -0.5% and forecasts -2.2% for the end of 2009. The result for 2008, a little better than the national figure, can be attributed to the holding up of services in the face of a decline in value added for manufacturing.
However it should be said that, in the light of what is happening at an international level, it has become impossible to make forecasts, but some comments can be made about the prospects for Italy and Veneto. Veneto in particular seems less exposed to the causes of the crisis for various reasons: the lack of a real housing bubble from which to recover; bank balance sheets with fewer toxic assets (even when the exposure to Eastern Europe is considered); and lower household debt compared to other European countries. However, the reasons for greater exposure are smaller margins for fiscal policy measures than other European regions due to a delay in the implementation of federalist reform; the large manufacturing sector which, like in Germany, could become a factor that amplifies the effects of the recession, since the decline in global trade strikes its restructuring; and the strong ties with a German economy in serious recession. It is also true, in any case, that being part of an integrated area like the European Union allows members to take advantage of the spillover of stimulus packages adopted by countries with public accounts in better shape. The strong role of manufacturing could become a comparative advantage when the recovery begins in that the recovery of the world business cycle will be initiated by a strengthening of industrial trade; when Germany begins to recover, there will be clear positive effects on Italy, and on Veneto in particular. In 2007, the most recent year for official regional figures, Veneto consolidated the recovery that had begun in the summer of 2005, and a rate of growth equal to 1.8% was achieved, higher than Italy's 1.6% growth. In 2007, Veneto was once again the third leading regional contributor to Italy's GDP: the region contributed 9.4% to the national total, behind Lazio (10.9%) and Lombardia (20.8%). The development underway in agriculture, services and international trade certainly contributed to the good results. Internal demand was supported by family expenditure, up 1.9%, although families were still prudent, mainly on account of financial market turbulence. After an acceleration in 2005, total investments are slowing, although there was a modest increase from 2007-2008, in line with all of Italy's other regions due to the increasing problems in access to credit. (Figure 1.1.7) The Gross Domestic Product per inhabitant in Veneto in 2007 was 30,038 euro, greater than the national figure of 25,862 euro. In comparison to other Italian regions Veneto continues to be in a good position. In addition to its high ranking, its annual trend was better than the national one. Business confidence
The most recent quarterly indicators at regional level regard the perceived confidence of entrepreneurs. In Veneto there was an increase in concern about the trends in production, orders and inventories in the final months of 2008 and the first ones of 2009.Beginning in early 2007 confidence began to decline, in particular that related to orders, but since September 2008, when the banking and financial crisis blew up, their concerns about orders and production have increased. A slight improvement was recorded in April 2009. (Figure 1.1.8) Value added by sector
A major contribution to the growth in value added was made by the service sector, which represents 62.6% of regional GDP and in 2007 performed well, up 2%. Even though agriculture makes a modest contribution to regional wealth, accounting for 2.4%, in 2007 it recorded significant growth, up 6.7%.Industry, which in Veneto still represents 34.9% of the entire GDP, in 2007 continued the recovery begun in 2006, recording a percentage variation of +1.7% compared to the preceding year. In 2008 agriculture is expected to recover, services to stagnate, and industry and construction to fall. It's expected that the value added by sector in Veneto is in line with the national figures. However, value added in agriculture at a national level experienced a boom: +2.4%; for Veneto an increase of 2.1% is estimated. The industrial sector in Italy in 2008 underwent a decline of 2.7%; it was greater for industry in a strict sense, down by 3.2%, and more modest in construction, down by 1.2%. In Veneto a slight reduction in industry in a strict sense is estimated, down by 0.9%, with a more marked one in construction, down by 3%. The wealth produced by services was stagnant on a national level, down by 0.2%; it was pulled down by retail, hotels, transport and communications, which fell by 1.8%; in Veneto the value added of the tertiary sector in 2008 was stationary, up by 0.1% compared to 2007. For 2009 a decline is forecast for all sectors, except for services, which should remain stable. (Figure 1.1.9), (Figure 1.1.10), (Figure 1.1.11) and (Figure 1.1.12) Access to credit in the Veneto economy
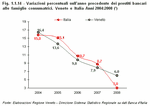
In the general climate of uncertainty, fears are rife concerning the development of a credit crunch, that is of a restriction in the supply of credit to the production sectors, with severe and deep consequences in the real economy. Nationwide studies by ISAE highlight signs of credit restrictions, especially for manufacturing firms and, to a lesser degree, for service and retail firms. In more detail, credit conditions for manufacturing drastically worsened in November 2008 and remained poor during the first months of 2009. In particular, rationing seems to have hit exporting firms, who are more exposed to the effects of the international crisis. After a significant increase at the end of 2008, the number of credit-rationed firms in services began to fall again in the first months of 2009. In trade, finally, the effects of the credit crunch were more evident at the beginning of last year, and became gradually less significant over the rest of 2008 and the first two months of 2009.The Bank of Italy's studies have also shown a worsening in access to credit: "in line with what was found on a national level, in Veneto (Note 7) 5% of the more than 260 industrial and service firms interviewed, between the end of September and the beginning of October 2008, said they found a stiffening of the conditions of debt, demonstrated through a lack of access to new financing or in requests by brokers to settle, at times partially, existing debts". However, in the survey of September 2007 a 2.5% share of firms responded in this manner. Growth in loans to consumer households declined from 7.9% to 6% between the end of 2007 and June 2008. Home mortgages contributed significantly to the decline in new loans (-11.8% percent in the second quarter compared to the corresponding period of the previous year). Consumer credit also slowed, falling from 15.2% to 8.4%. The decline in the growth of household credit continued until August 2008. (Figure 1.1.13) and (Figure 1.1.14)
At national level, investments experienced five consecutive declines beginning halfway through 2007. In the second half of 2008 they experienced a further decline highlighted by a fall in business confidence, the progressive decline of the employment of plants and the reduced access to bank credit, which became more selective after the summer. The decline was still clearer in the results for investments in vehicles and construction from the beginning of 2008. All of this translated into a fall in overall investment of 2.9% in 2008 compared to the previous year; this fall was larger for investments in machinery and equipment, down by 4.7%, but not in vehicles, down by 1.9%, and construction, which fell by 1.8%.
At regional level the most recent figure refers to 2006 when the increase in investment was +1.5% on the previous year, a rise that was driven primarily by investment in construction, +15.1%, and in industry in a strict sense, +3.8%; investment in services was stagnant, +0.6%, and was negative in agriculture, -9%. In 2007 an aggregate increase of 1.2% is estimated, while a 1.4% fall is expected in 2008, and an even greater one in 2009. In fact, sector investigations revealed a weakening in the dynamics of investments in the first part of 2008, which was accentuated by the difficulties experienced in the second part of the year. A recovery in investment activity will be slow and dependent on the effects of the international financial crisis, and therefore on the normalisation of financial and credit markets and an improvement in the general framework. The information in our possession today estimates a decline in 2010, even though less severe, and followed by a progressive recovery in 2011-2012. (Figure 1.1.15)
National private consumption in 2008 declined by 0.9% compared to the previous year. In the fourth quarter of 2008 the trend continued to worsen, confirming an underlying weakness and uncertainty. The weakness in purchasing can be explained in part by the difficulty in funding debt. The widespread uncertainty of the duration and depth of the recession and the increasing worries about the changes in the labour market have induced households to postpone larger purchases; indeed a sharp fall in purchases of durable goods was recorded in the summer 2008. Consumption of non-durable goods stagnated, after the declines recorded in the preceding four quarters, while expenditure on services experienced a modest recovery in the last quarter. (Figure 1.1.16), (Figure 1.1.17) and (Figure 1.1.18)
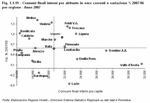
In Veneto in 2007, the year for which the most recent data is available, spending on final consumption was found to be +1.9%, a higher level than that for Italy. Compared to the other regions Veneto is a driving force in Italian domestic demand: final domestic consumption per person ranked higher than the national figure and the rate of aggregate growth was higher than the Italian figure. (Figure 1.1.19) Since 2000, family expenditure has shifted from transport, clothes and footwear, furniture and electrical appliances, recreation, culture and alcohol towards housing and communication. For 2008 stagnation has been estimated in household spending on consumption for Veneto due to the difficulty in accessing credit and the significant acceleration in inflation in the first half of the year. Household consumption will fall further in 2009 and then recover in 2010. (Figure 1.1.20) and (Figure 1.1.21)
World trade in manufactured goods experienced a brisk slowdown as a result of the continuous spread of the effects of the financial crisis on the major world economies. In 2009 a decline in international trade is expected due to the contraction in economic activity of the principal industrial economies between the end of 2008 and the beginning of 2009.
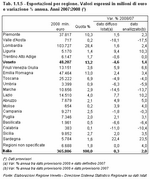
In 2010 a modest recovery is forecast because of the continuing positive contribution coming from the demand of emerging countries. The ability of these economies to maintain autonomous growth, especially for countries that export raw materials, will be the crucial factor if the world economy is to avoid a recession of an intensity and length greater than expected. (Figure 1.1.22) In this general framework, in 2008 (Note 8) Italian exports recorded an increase of 2% on 2007 and imports of 2.5%; the trade balance (Note 9) was minus 11,478 million euro, larger than that recorded in 2007 (8,596 million euro). As the final figures for 2008 are not yet available, the figures for foreign trade published by Istat are accompanied by the percentage variation for 2008/2007, which is calculated by comparing the two sets of provisional data, in order to provide a more accurate forecast of the trend for regional international trade; from here on the analysis will be carried out on the provisional data. (Table 1.1.5) In 2008, the trend in national exports was positive with most of Italy's principal trading partners. Germany (+1.1%), Switzerland (+8%), Russia (+9.3%) and Poland (+10.5%). Declines in foreign sales were recorded with Spain (-9.8%), the United States (-5.5%), the United Kingdom and Belgium. On the other hand, exports to France, which is still the second export market for Italian goods (about 41 billion euro in 2008), were stable. The imports from several principal trading partners, Germany (-3.1%), France, Spain and Belgium, decreased, while an increase was recorded, in value terms, with China (+8.4%), Libya, Russia and the United States. Imports from Holland were basically stable. Over the course of 2008, the growth in exports in the principal categories at national level involved mechanical products (+3%), chemicals, rubber and plastics, processed-metal, and food products. The declines were quite limited and involved only vehicles, minerals and a few of Italy's traditional goods such as leather, furniture and jewellery. In the sectors of greatest importance for national imports, there was an increase in raw materials (+26.3%), chemicals products, rubber and plastics, and food products. The declines, however, involved the sectors of metal products (-4.4%), vehicles, and fashion. Veneto exports
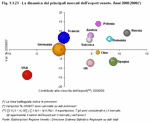
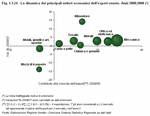
In Veneto, after the good performances in recent years, +9.2% in 2007 and +13.9% in 2006, exports will probably feel the effects of the international crisis, and the slowdown in international trade will also have a negative impact on the trend in regional exports. Indeed, growth in the value of foreign sales resized to +1.4% in 2008 and a contraction of about 6 percentage points is forecast for 2009.A temporary support for exports could come from a weakening of the euro in 2009, which should support the competitiveness of Veneto's exports in those markets and sectors in which price is still a relevant strategic variable. The variations in the price factor, which are in part caused by the international crisis, could favour a re-evaluation and specialisation of the goods and services supplied by Veneto. (Figure 1.1.23) In 2008 regional exports, equal to about 48.3 billion euro, grew in nearly all of the geographic areas except for North America (-12.7%). The growth of flows of direct exports to the 27 countries of the European Union experienced a rate more or less in line with that of previous years (+2.3%). Among its principal European partners, there was significant growth in sales to France (+6.4%), which remains Veneto's second export market, as well as to Austria, Romania, Belgium and Poland (+13.8%). Exports to Veneto's main trading partner remained steady: Germany, despite its significant economic slowdown, recorded a variation of -0.1% in the value of goods imported from Veneto. Veneto's exports to Spain (-6.5%) and the United Kingdom fell. Sales to the United States, epicentre of the world economic collapse, recorded a major decline, equal to nearly 14 percentage points. The value of sales to African, Asian and Eastern European markets, however, grew to a significant degree. +8.8% to the Middle East, +19.6 % to North Africa, +7.7% to Central Asia and +9.3% to Eastern Europe. In the latter, the percentage variation with Russia was about 17 percentage points. The value of exports to the markets of East Asia remained almost unchanged: nearly 3 billion euro in 2008. Emerging markets, thus, are bound to play an ever more important role in the foreign sales of Veneto's firms. Russia is certainly among these countries. Exports to Russia today account for about 4% of regional exports and they should continue to grow in the coming years as well. Between 2000 and 2008 the Russia market was the one that contributed the most to growth in regional exports: more than 11% of the growth in foreign sales in the last eight years can be attributed to trade with Russia. Veneto's firms will continue to receive significant orders from new emerging economies, which should substitute, at least in part, those markets that represent the traditional outlets for regional exports, such as the United States, France and Germany. In the year 2008 exports recorded a tendency to increase in many of the categories of economic activity with the exception of vehicles, non-metal minerals goods, and other manufactured goods (furniture, jewellery and sporting equipment). Regarding the principal categories, the greatest increases in foreign sales were in machinery and mechanical equipment (+3.1%), optical and electronic products, agricultural products and processed foods, and metal products. The economic crisis, at least in 2008, did not affect the export of Veneto manufacturers in the fashion sector. Indeed, 2008 ended with an increase of +2.9% in foreign sales for textiles and clothing and +1.2% for the production of hides and leather. (Figure 1.1.24) Exports by kind of goods
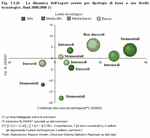
(Figure 1.1.25) In 2008 exports grew in all the classifications by kind of goods compared to the preceding year, with the exception of the consumption of durable goods (-2.1%) and capital goods (-0.4%).Foreign sales of non-durable consumer goods held up rather well, up by 5.2% compared to 2007, thanks to the performance of agricultural goods and the food industry. Exports of non-durable goods will also grow in 2009 and will be led by the sales of the food sector, which has been confirmed as one of the most traditional areas of Veneto's economy. The trend in foreign sales was also positive for intermediate goods: in 2008 the growth rate was +1.5%. The growth of regional exports in recent years has been supported by industrial restructuring, which has selected the firms which are able to compete in ever more global markets. Furthermore, these processes have mainly favoured specialised producers of capital and intermediate goods, which have demonstrated that they are able withstand the onslaught of foreign competition. The importance of capital goods (Note 10) in total regional exports rose from 27.9% in 2000 to 29.7% in 2008; this is a positive factor because the growth of the capital goods category follows the trend of world demand for investment goods, especially from the new economies. The importance of the export share of intermediate goods has grown as well (Note 11) going from 23.3% in 2000 to 26.7% in 2008. The export share of these goods also rose due to the effect of relocation and can be considered a good indicator as to the degree of integration of the global production processes. In recent years a few sectors of manufacturing excellence in Veneto, especially clothing, fashion and furniture, have had to face a serious crisis in competitiveness. The competition from some new emerging countries, due to low labour costs, has hit numerous specialised manufacturing sectors in Veneto. This has led to a substantial reduction, about 6 percentage points, of their weight in consumer goods exports: the share of non-durable goods went from 27.5% in 2000 to 24.5% in 2008, while that of durable goods declined from 19.6% in 2000 to 16.6% in 2008. Observing the dynamics of exports in the manufacturing sector in the last two years and aggregating the sectors by product technology content (Note 12), reveals an annual decline in exports of high-tech goods (-4.8%), due to a major contraction in exports in the aeronautics and aerospace sector (-23.6%), and in products with a medium-low technology content (-2.2%). However, growth was recorded in goods with a medium-high technology content (+3.1% compared to 2007) and low-technology content (+3%). The Veneto export model, although it is still centred on the specialisation in traditional sectors with a lower technology content, has experienced constant growth in goods with an intermediate technology content: the share of exports with a medium-high content went from 31.4% in 2000 to 34.7% in 2008, while that of medium-low technology content goods grew by about 4 percentage points over the same period. It is no coincidence that the best results come from the technology sectors and Italy's high-quality traditional sectors. In recent years, machine tools from Veneto have been able to compensate satisfactorily for the lower demand of the advanced markets with a more favourable development in the demand for machinery in emerging countries. This achievement is thanks to a high degree of production process automation and a knack of creating innovative products. Size also seems to be relevant if a business wishes to establish itself in the export of products with a high level of research and innovation, given that in sectors with a medium- and high-technology content the leading exporters are predominantly large firms. Small-sized enterprises, however, play a predominant role only in some of the traditional sectors. (Figure 1.1.26) From 2000-2008, the low-tech sector was still the most representative of regional exports and accounted for 36% of the entire value of goods exported by Veneto firms. The fashion sector (with a 51.8% share) and the furniture sector, as well as other manufacturing products (24%), also have significant influence. However, the share of goods with a high-technology content exported by Veneto has fallen slightly in recent years. Overall the goods exported at regional level had a share that went from 9% in 2000 to 7.7% in 2008: the consistent increase in exports for the optical, radio and television equipment, office equipment, and computer sectors has not been able to compensate for the fall in foreign sales in aerospace production and pharmaceutical products. Trade balance and imports
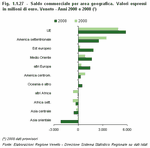
In 2008 Veneto's trade balance recorded a surplus, equal to about 11 billion euro. This result is the consequence of a surplus with the EU (+5,795 million euro), North America, Eastern Europe and the Middle East. Trade deficits, however, were registered with East Asian and Central Asian countries. Veneto's deficit with East Asia is due to the dominant role that China alone has played as it accounted for nearly one quarter of regional imports for products in the fashion sector. (Figure 1.1.27) and (Table 1.1.6)Over the course of 2008 an annual decline in the value of imports at current prices equal to 2.7 percentage points was recorded. Among the principal partners, the greatest falls in imports were recorded for France, Spain, the Netherlands, the United States, Switzerland and the United Kingdom. However, imports from the two leading trading partners of Veneto grew. +1.5% from Germany and +2.9% from China. The greatest increases in regional imports concerned Tunisia (+13.8%), the Czech Republic, Romania and Brazil. Among the economic categories with the greatest weight, there was a drop in imports of vehicles (-0.6%), metal products (-7.7%), hides and leather, other manufacturing products (including furniture and jewellery), machining, and chemical, rubber and plastic products. There were increases in products of the food sector (+8.7%) and the optical and electronics category, while the value of imports in textiles and clothing and vehicles remained substantially stable. The situation in the provinces
(Table 1.1.7) The dynamics of foreign trade in Veneto's provinces have produced varied results. In 2008 the value of goods exported from the provinces of Treviso, Vicenza and Verona grew, while in Padova, Venezia and Belluno it fell.Finally, a steep increase in exports from Rovigo was recorded as a result of the rise in foreign sales of vehicles (+140 million euro compared to 2007). There were also good performances in the other principal sectors of exports from Rovigo: +27% in metal products and +12% in mechanical products. The value of goods imported by the provinces of Treviso and Verona was substantially stable, while a negative percentage variation was recorded in Vicenza, Venezia, Belluno and Padova. However, the increase of imports to the province of Rovigo was large, caused by the value of imports in vehicles (+172 million euro compared to 2007).
In 2008 the harmonised index of consumer prices in the euro area increased by 3.3% compared to 2.1% in the previous year. Over the year, consumer inflation, after the peak reached in the summer quarter (3.8%), decreased dramatically in later months, to 1.6% in December, driven by the rapid decline in the prices of raw materials.
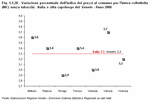
According to the European and Monetary Union (EMU), on a national level, the 3.3% annual growth rate in prices followed the bell-shaped course, with a peak in the months of July-August and a decline to 1.1% in March 2009. In March 2009, the projected inflation rate for the euro area was 0.6%, The 12-month inflation rate in the euro area in March 2009 was 0.6%, dropping for the eight consecutive month. Italy, Germany and France (0.4% in March) were all affected by this fall in inflation. In Spain, the 12-month inflation rate in March 2009 dropped very slightly (-0.1%). In Italy, the rate of harmonised inflation was 1.1% in March 2009, a decrease compared to 1.5% in February. Measured with the harmonised index, base inflation (calculated without energy and fresh-food prices) was 1.8% in Italy in March, a slight fall compared to the 2.1% in February, and a level not much higher than that of the euro area (+1.5%), where it declined slightly compared to the previous month (+1.7%). According to the predictions of professionals surveyed in December by Consensus Forecasts, in 2009 consumer prices in the euro area will grow on average by 1.4%; in the second and third quarters the 12-month rate could fall to particularly low levels, especially in comparison with the same period of 2008 when food products and energy experienced steep increases. In Veneto in 2008 inflation was on average identical to the national level of 3.3%; the provincial capitals that distinguished themselves for lower rates were Belluno, Venezia and Vicenza. In Veneto, the prices that contributed the most to inflationary pressure were those for housing and transport, as they were at national level. (Figure 1.1.28) |
|
Data processed by the Statistics Office of Regione Veneto are collective property; reproduction of this material is authorised for non-commercial purposes only, provided the source "Regione Veneto - Regional Statistics System Management" is acknowledged.
English translation by the University of Padova Language Centre.


