Chapter 9
The Veneto Region compared to the best European performers (Note 1)
In view of the increasingly intense competition between the economic markets in which businesses and highly qualified staff are established it is becoming increasingly important for a region to identify its competitive position in the international field in order to guarantee its future economic development. Regional benchmarking provides a tool specially adapted to this aim since it enables the comparison of different regions on the basis of various types of indicators. In this chapter, the regional economy of Veneto will be compared to that of Italy, Western Europe (Note 2) and 12 other economically strong regions in order to define its competitive position on the international scale and to identify the weaknesses and strong points as well as possible risks and opportunities (SWOT Analysis).
It was specifically decided that benchmarking would be carried out using comparison parameters resulting among the most performing economies in Europe, as the potentiality of the Veneto region's economic structure is clear to all, and in order to transform those critical aspects into tools to work on and improve the competitiveness of Veneto in the world.
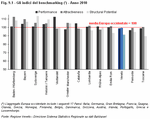
In the international field competitive is first and foremost a region which presents a positive economic trend (Performance), proves to be attractive in terms of business and human capital (Attractiveness) and is characterised by a modern economic structure (Structural Potential). The regional economic performance is evaluated by the GPD per capita indicators, growth in GPD and employment variation. The attractive capacity of a region is estimated by factors such as tax charge, accessibility, innovative activity and market regulation. Finally, combining information on the potential growth of the current sector composition (Industry Structure Potential), on the productivity of the sectors subjected to international competition (Capacity to Compete) and on the political scene (Political Structure Potential), the Structural Potential Index allows the potential future growth of the regional economy to be calculated. The current and potential international competitiveness of the Veneto region is evaluated on the basis of these three Bakbasel indices. (Figure 9.1)
A large heterogeneity emerges from the international comparison, as concerns either the level of regional competitiveness or its composition in terms of strong and weak points.
The regional Performance of Veneto is on average sustained by a GPD per capita above the European average, but held back by an average GPD growth between 2000 and 2010 which is weaker compared to that of the other benchmark regions and of Western Europe.
The Attractiveness of the Veneto Region is in line with the Western European average and benefits from a good accessibility but is at the same time held back by a heavy tax charge like other Italian regions and by an excessive regulation of the goods market and a smaller production of university research when compared to that of the benchmark regions.
With regard to the Structural Potential Index, the results of the Italian regions are more critical as the low degree of administrative decentralisation impacts negatively on its making. However this does not affect the region's sphere of influence. Included amongst the factors which do however impact on a regional level is the composition of the Veneto export base. This is mainly made up of industrial sectors which show records of productivity below the Western European average as is the case in sectors which are heavily subjected to pricing competition with Countries that use low-cost workforce (for example, textile industry). On the other hand, these industries can become a good opportunity for Veneto if they are based on a high quality production which is incomparable to products originating from Countries with low-cost workforces.
Again from the point of view of the sectors, the mechatronics and metal section represents another potential opportunity for the region, since, even if productivity is shown to be below the European average (2010) it is confirmed again as one of the sectors with the highest growth potential in Western Europe. This is also a result of the high export flows it generates. (Figure 9.2)
With reference to the opportunities which arise in Veneto for the future development of its regional economy, when observing the total results obtained in this international benchmarking, fundamental requirements such as investment in innovative activities, research and high level education are outlined in order to improve its attractiveness with regard to talents and businesses.
Analysing this comparison in more detail, Veneto emerges as an affluent region with a per capita income above both the Italian and European averages and with an average GDP growth which is more dynamic compared to that of Italy and to the majority of the peninsula's benchmark regions (in the period 2000-2010). The Veneto GPD which has been exclusively driven by the population growth over the last decade has experienced a decline moving into the new millennium, leaving behind the economic dynamism which characterised the Nineties and allowed this region to be included amongst the powerful industries of the age.
From then on Veneto's regional economy slowed its course if compared to the average Western European economic development, rising up during the first years of the 2000 and causing a gap in growth to open up whose signs are still evident today. The main reason for this gap seems to be the difference in productivity evolution which experienced a decline in Veneto over the last decade and consequently held the economic Performance back. However, in Western Europe a significant increase and important growth contribution was recorded.
The analysis of the innovative capacity of a region and the attractiveness it exerts on businesses and human capital, two factors which are closely linked, complete the image regarding the regional economic trend recorded in Veneto over the last ten years.
The 2010 Attractiveness Index highlights Veneto as less attractive from the production of university research point of view, calculated using the Shanghai index. It is also less attractive from the perspective of tax charge for legal and natural persons without taking into consideration the infrastructure and public service terms. Despite the fact that the Veneto Region can benefit from its strategic geographical position with respect to Europe and from its access to the sea in order to propose itself as an attractive location on a global scale, it is still difficult to reach on an intercontinental level and suffers from the absence of a metropolis of international acclaim which would help move the magnet of attraction. If the local talents and businesses are attracted elsewhere and the regional prospects abroad are weak in order to balance out emigration, there will be a lack in the innovation and productivity requirements. Moreover, the output of innovative activity, concerning both the density of patents and scientific publications, shows a shortage in this field even if it is increasing in comparison to the past.
Besides the innovative capacity, a sector composition in line with the growing international integration proves to be a fundamental element for guaranteeing a sustainable economic growth. A trend which leans towards a re-composition in favour of the tertiary sector is shown but the Veneto structure still reflects the historical industrial vocation of the region. On the basis of the current structural composition and of the growth potential calculated by single sections the economy of the Veneto region seems to have a potential below the Western European average. This must be brought back, on one hand, to an amount less than proportional with respect to the European average in the service sector, to which a large potential growth is attributed, and, on the other hand, to an importance above the industrial sector average (for example, traditional industry) for which the Western European development prospects are considered to be particularly scarce since they are in pricing competition with regions that use low-cost workforce. It must be considered, however, that whilst the majority of European manufacturing in traditional sectors is always more delocalised, the traditional handcraftsmanship and perfection features of the Veneto manufacturing places it within the medium-high level goods, well distinct from the low-cost manufacture produced in emerging Countries, and which is directed at clients who demand the taste and high quality of 'Made in Italy'. (Note 3).
The Italian political context particularly contributes to the determination of the Structural Potential Index of the Veneto economy which is positioned below the Western European average. The political context is an obstacle to the potential growth of the regional economy, even if only marginally falling back into the single region's sphere of influence. In order to guarantee its long-term competitiveness, Veneto's priority is increasing its productivity. In particular, an increase in productivity would allow the region to take advantage of the opportunities offered by the mechatronics and metals sector, already important and consolidated in Veneto and for which a development of other systems is also expected in the future. Some favourable conditions are also recorded even in the tertiary sector, which in addition to showing a high potential growth records a particularly dynamic evolution for the last decade in the Veneto Region.
A development of exports in the service sector, today almost exclusively centred on local needs, could also compensate for the possible erosion of the Veneto export base, currently subjected to a heavy price competition.
The term Performance here indicates the past competitiveness of a region measured on the economic trend recorded up until now. The best way to evaluate the Performance thus defined is by including either a measurement of level (Gross Domestic Product per capita) or a measurement of dynamism (growth of GDP and employment) in the analysis.
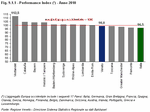
Both these measurements are relevant for determining wellbeing in so much as neither a high wellbeing level but in constant decrease nor the extension of this to constant low levels can be considered satisfactory in the long term. The economic Performance achieved in the past is summarised in the Bakbasel Performance Index. (Figure 9.1.1)
As much as this index is concerned, the Veneto region is positioned just below the Western European average. The more contained growth in GPD recorded in Veneto between 2000 and 2010 has particularly contributed to this result, causing a resizing of the index with respect to the past. The positive results obtained in relation to the above average GDP per capita and to the employment evolution (on average) have not been able to compensate for the weak growth of the Gross Domestic Product, driven by the population growth but held back by the decreasing productivity. From a sector point of view, over the last ten years on one side the stagnation of the fashion and furniture aggregate has been recorded, and, on the other hand, records show a particular dynamism in the building, banks and insurance and transport and communications sector. (Figure 9.1.2.)
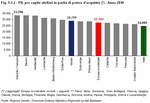
Although lower than that of strong regions such as Helsinki/Tampere, Bavaria or Western Norway, in 2010 the GDP per capita of Veneto registered a value above the Western European average. Compared to Italy which is last place on this benchmark, Veneto shows a decidedly more favourable relationship between wealth production and population. Still better is the situation recorded by Lombardy, the other driving area of Italy, which is presented at a solid advantage with respect to Veneto and just behind the regions that are first in the ranking. (Figure 9.1.3)
Up until around the end of the Nineties, Veneto's Gross Domestic Product growth was significantly more dynamic than that of Italy. After a setback of the indicator in the early 2000s, which was larger in Veneto than in Italy, a substantial homogeneity between the evolution of both the Veneto and national GDP was revealed. Veneto's advantage over Italy, shown on the graph for the total time scale considered, is therefore totally attributed to the large dynamicity shown by the region before passing to the new millennium. In comparison with the average of the Western European Countries, Veneto at first shows a greater dynamicity. However, from 1997 a rise in the European GDP is recorded, producing a growth gap which is still persisting.
In general, the GDP growth in Veneto is characterised by conjuncture fluctuations much more accentuated than those of Italy and, above all, Western Europe; Veneto's ability to recover has always been faster and more intense in the past compared to that of other regions. Let's think that in the year of recovery from the serious crisis of 2009, i.e. in 2010, the GDP growth was 3.2% in Veneto against Italy's 1.3%. (Figure 9.1.4)
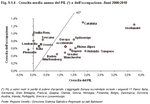
Comparing the growth of GDP with that of employment, a gap between the Italian regions and the rest of Europe is noticed; if compared with the other benchmark regions and the European average, Veneto actually shows a more contained growth in GDP, but compared to Italy and the other comparable Italian regions the GDP trend for Veneto is more dynamic.
As concerns the growth of employment, however, Veneto shows values higher than both the Italian and Western European averages.
The graph indirectly also provides information regarding the development of productivity: along the line shown on the graph at an angle of 45 degrees, the employment and GDP growth are equivalent, signifying that the work productivity (value added by worker) has remained constant during the period under consideration. This line therefore separates the regions where the rate of employment growth exceeds that of the GDP and that therefore show decreasing work productivity, from those which show an opposite development. The distance (orthogonal) between the bisector therefore indicates the dynamic (positive or negative) of the productivity.
In the period between 2000 and 2010 in Veneto a decrease in productivity was discovered. This dynamic is a typically Italian feature, since only the peninsula's benchmark regions recorded a GDP growth below that of employment. In the Italian context, the fall in productivity in Veneto should be considered as relatively contained but in the long term an increase in productivity will be necessary in order to reduce the growth gap between Veneto and the other Western European regions and therefore maintain a competitive position on the international scene.
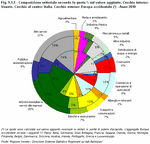
Observing Veneto's total economic structure it is clear that the tertiary sector has supremacy over the secondary and that this is continually consolidated over the years; a trend which is found in all the main world economies. Veneto's historical industrial vocation proves to be stronger yet as the share of wealth produced by the industry in the region exceeds that recorded in Western Europe and Italy. (Figure 9.1.5), (Figure 9.1.6)
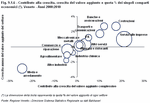
As regards the sectors which are driving the economic growth in Veneto, first of all a large contribution is shown to be provided to businesses by service sectors which also possess a significant share of the added value. The building, banks and insurance and transport and communications sectors also show a large growth contribution. However this can above all be traced back to the particularly dynamic added value produced by these sections.
The contributions to the growth of the mechatronics and metal and hotels and restaurants sectors are also positive. Both of these are particularly relevant to the total share of added value.
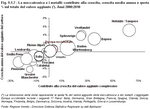
It is necessary to specify that included in the period under consideration that stretches from 2000 to 2010 is the serious crisis culminating in 2009 which particularly hit the Veneto manufacturing industries and contributed to the decline in the average annual growth of sectors such as fashion, food and agriculture and mechatronics. (Figure 9.1.7)
The more than proportional importance of the mechatronics and metal sector in Veneto compared to Italy and Western Europe is stressed. Also noticeable is that even in comparison with other benchmark regions the Veneto mechatronics and metal sector proves to be amongst the biggest in terms of added value share. Its contribution to growth is average as regards the norm for Western Europe, but it has not had the big success of other regions such as Helsinki/Tampere and Bavaria which show a sector amount barely above that of Veneto.
Having examined the current economic structure of Veneto, the growth of this sector could drive the regional recovery. In the Italian context, taking into consideration both the national average and that of the benchmark regions, Veneto is the only region where this sector shows a positive contribution to growth: mechatronics and metals actually show records of a negative effect on the economic growth, particularly in Piedmont, Emilia Romagna and Lombardy where its weight is similar if not actually above that of Veneto. By managing to stimulate growth in this aggregate, Veneto could benefit greatly from this situation.
Both these measurements are relevant for determining wellbeing in so much as neither a high wellbeing level but in constant decrease nor the extension of this to constant low levels can be considered satisfactory in the long term. The economic Performance achieved in the past is summarised in the Bakbasel Performance Index. (Figure 9.1.1)
As much as this index is concerned, the Veneto region is positioned just below the Western European average. The more contained growth in GPD recorded in Veneto between 2000 and 2010 has particularly contributed to this result, causing a resizing of the index with respect to the past. The positive results obtained in relation to the above average GDP per capita and to the employment evolution (on average) have not been able to compensate for the weak growth of the Gross Domestic Product, driven by the population growth but held back by the decreasing productivity. From a sector point of view, over the last ten years on one side the stagnation of the fashion and furniture aggregate has been recorded, and, on the other hand, records show a particular dynamism in the building, banks and insurance and transport and communications sector. (Figure 9.1.2.)
Although lower than that of strong regions such as Helsinki/Tampere, Bavaria or Western Norway, in 2010 the GDP per capita of Veneto registered a value above the Western European average. Compared to Italy which is last place on this benchmark, Veneto shows a decidedly more favourable relationship between wealth production and population. Still better is the situation recorded by Lombardy, the other driving area of Italy, which is presented at a solid advantage with respect to Veneto and just behind the regions that are first in the ranking. (Figure 9.1.3)
Up until around the end of the Nineties, Veneto's Gross Domestic Product growth was significantly more dynamic than that of Italy. After a setback of the indicator in the early 2000s, which was larger in Veneto than in Italy, a substantial homogeneity between the evolution of both the Veneto and national GDP was revealed. Veneto's advantage over Italy, shown on the graph for the total time scale considered, is therefore totally attributed to the large dynamicity shown by the region before passing to the new millennium. In comparison with the average of the Western European Countries, Veneto at first shows a greater dynamicity. However, from 1997 a rise in the European GDP is recorded, producing a growth gap which is still persisting.
In general, the GDP growth in Veneto is characterised by conjuncture fluctuations much more accentuated than those of Italy and, above all, Western Europe; Veneto's ability to recover has always been faster and more intense in the past compared to that of other regions. Let's think that in the year of recovery from the serious crisis of 2009, i.e. in 2010, the GDP growth was 3.2% in Veneto against Italy's 1.3%. (Figure 9.1.4)
Comparing the growth of GDP with that of employment, a gap between the Italian regions and the rest of Europe is noticed; if compared with the other benchmark regions and the European average, Veneto actually shows a more contained growth in GDP, but compared to Italy and the other comparable Italian regions the GDP trend for Veneto is more dynamic.
As concerns the growth of employment, however, Veneto shows values higher than both the Italian and Western European averages.
The graph indirectly also provides information regarding the development of productivity: along the line shown on the graph at an angle of 45 degrees, the employment and GDP growth are equivalent, signifying that the work productivity (value added by worker) has remained constant during the period under consideration. This line therefore separates the regions where the rate of employment growth exceeds that of the GDP and that therefore show decreasing work productivity, from those which show an opposite development. The distance (orthogonal) between the bisector therefore indicates the dynamic (positive or negative) of the productivity.
In the period between 2000 and 2010 in Veneto a decrease in productivity was discovered. This dynamic is a typically Italian feature, since only the peninsula's benchmark regions recorded a GDP growth below that of employment. In the Italian context, the fall in productivity in Veneto should be considered as relatively contained but in the long term an increase in productivity will be necessary in order to reduce the growth gap between Veneto and the other Western European regions and therefore maintain a competitive position on the international scene.
Structure of the sectors and GDP growth in detail (Note 4)
Compared to Italy and Western Europe, it seems that in Veneto in particular the fashion and furniture, mechatronics and metals and hotels and restaurants sectors produce a higher share of added value. On the contrary, the chemical industry, banks and insurance, public administration and other industry sectors play a significantly less important role. The share of the other services aggregate is also lower. This includes the activities linked to education, health and social services, other public and personal services and home economics.Observing Veneto's total economic structure it is clear that the tertiary sector has supremacy over the secondary and that this is continually consolidated over the years; a trend which is found in all the main world economies. Veneto's historical industrial vocation proves to be stronger yet as the share of wealth produced by the industry in the region exceeds that recorded in Western Europe and Italy. (Figure 9.1.5), (Figure 9.1.6)
As regards the sectors which are driving the economic growth in Veneto, first of all a large contribution is shown to be provided to businesses by service sectors which also possess a significant share of the added value. The building, banks and insurance and transport and communications sectors also show a large growth contribution. However this can above all be traced back to the particularly dynamic added value produced by these sections.
The contributions to the growth of the mechatronics and metal and hotels and restaurants sectors are also positive. Both of these are particularly relevant to the total share of added value.
It is necessary to specify that included in the period under consideration that stretches from 2000 to 2010 is the serious crisis culminating in 2009 which particularly hit the Veneto manufacturing industries and contributed to the decline in the average annual growth of sectors such as fashion, food and agriculture and mechatronics. (Figure 9.1.7)
The more than proportional importance of the mechatronics and metal sector in Veneto compared to Italy and Western Europe is stressed. Also noticeable is that even in comparison with other benchmark regions the Veneto mechatronics and metal sector proves to be amongst the biggest in terms of added value share. Its contribution to growth is average as regards the norm for Western Europe, but it has not had the big success of other regions such as Helsinki/Tampere and Bavaria which show a sector amount barely above that of Veneto.
Having examined the current economic structure of Veneto, the growth of this sector could drive the regional recovery. In the Italian context, taking into consideration both the national average and that of the benchmark regions, Veneto is the only region where this sector shows a positive contribution to growth: mechatronics and metals actually show records of a negative effect on the economic growth, particularly in Piedmont, Emilia Romagna and Lombardy where its weight is similar if not actually above that of Veneto. By managing to stimulate growth in this aggregate, Veneto could benefit greatly from this situation.
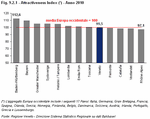
The term Attractiveness specifically refers to the capacity a region has for attracting business and human capital as well as for maintaining people and economic activity already located in the area, consequently constituting a fundamental component of the competitiveness of the present and above all, future. Some business surveys conducted by Bakbasel showed how factors such as tax burden, accessibility, quality of life, innovative capacity and market regulation are decisive for the choice of site location. In order to illustrate the attractiveness of a region, the Attractiveness Index has been used which enables the evaluation of the positioning of a region in the areas listed above (excluding the quality of life). (Figure 9.2.1)
With regard to the Attractiveness Index 2010, Veneto's score, as for the majority of Italian benchmark regions, is roughly in line with the European average. Amongst the regions of the Italian peninsula, Lombardy proves to be more attractive than Veneto. Western Norway, Catalonia and Rhône-Alpes however achieve lower scores, whilst the two German regions Baden-Württemberg and Bavaria lead the group by a significant distance. (Figure 9.2.2)
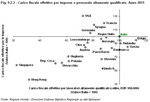
The result Veneto obtained in the regional Attractiveness evaluation is mainly attributable to a less favourable tax charge for natural persons and regulation of the goods market as well as to a lower number of university publications compared to the European average. However, the continental accessibility, regulation of the work market and, to some extent, the patent density and the tax charges for businesses influence the positive attractiveness of Veneto, without however managing to counterbalance the negative effect of the previously listed factors. The Shanghai Index and the global accessibility appear to be in line with the Western European average and therefore are not shown on the graph. It should be remembered however, that some of these phenomena like tax charges and regulation directly rely on national laws over which the regions have little or no control. (Figure 9.2.3)
Italy shows another tax charge: as regards the highly qualified personnel, Italy, and consequently also Veneto belong, along with Belgium, Sweden and Finland to the group of Countries with the highest level of tax charges. As concerns business taxation however, Italy is linked closely to the United Kingdom, whilst the United States, France, Spain and Germany have a significantly larger tax charge.
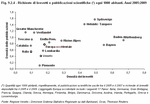
The research quality of the academic output is measured on the Shanghai Index, on the basis of which the classification of the 500 best universities in the world is annually decided. Included amongst the many factors involved in the evaluation procedure is the number of Nobel prizes held by the alumni and current collaborators, the number of researchers frequently referenced and the quantity of scientific articles published in renowned specialist journals. The total score of a region is found by summarising the scores obtained by individual universities in the area. Amongst the universities in the Veneto region, the University of Padua is entered into the rankings of the 500 best academic institutions in the world, occupying 169th place. (Figure 9.2.4)
The university publications represent a good indicator of the discoveries achieved in the field of core research. Despite these discoveries cannot usually be employed in projects and products which are concrete and therefore remunerative, they lay the foundations for innovations with more tangible economic effects. The requests for patents measure instead the intensity of research centred on the increase of the production of added value.
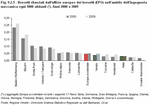
As regards patent density, Veneto is positioned within the European average even if it is clearly separated from the leading group which is made up of Helsinki /Tampere, South Sweden, Bavaria and Baden-Württemberg in first place.
This disadvantage - for Veneto as for other regions, but above all, for the whole of Italy - is also to be attributed in part to a more imbalanced economic vocation towards sectors which are traditionally considered to having a high intensity of work requiring few qualifications. Compared to the national data, the patent density in Veneto is clearly above average: it is however necessary to highlight that Italians often do not register their inventions in the patent office due to the costs implicated. (Figure 9.2.5)
It is necessary to find out if and to what extent a low patent density can be attributable to a regional economic structure characterised by sectors traditionally considered to be of a high intensity of work requiring little qualification or with a significant lack of innovation.
A first differentiation of the causes by a temporal and regional comparison can be supposed by focussing on a sector where patents definitely play an important role, such as mechanical engineering.
The largest number of patent requests in the technological aggregate (Note 5) "mechanical engineering" appear to come from Veneto. The value per 1000 inhabitants is placed within the Western European average, clearly above the Italian one. The Italian benchmark regions Emilia Romagna, Piedmont and Lombardy, however, show a larger quantity of patents per 1000 inhabitants. Compared to all of the benchmark regions, the innovative activity in Veneto is below average, but the development of the phenomenon is positive, increasing by 25% between 2000 and 2009.
The concept of Structural Potential takes on an extremely important role in the analysis of the competitiveness and of the future economic development. Three elements contribute in turn to the determination of the Structural Potential of a region: Industry, Structure Potential, Capacity to Compete and Political Structure Potential.
The Industry Structure Potential analyses the current economic structure with reference to future growth prospects. A strong regional concentration of sectors which have achieved high growth rates represents an opportunity for ensuring the long-term sustainability of the positive trend. On the other hand, a more than proportional presence of sectors with poor growth prospects presents an obstacle to the potential growth of the entire regional economy.
The subcategory Capacity to Compete studies the productivity of economic sectors subject to inter-regional competition in order to evaluate their competitiveness on the international scene. In the long term, the most productive regions are able to take advantage of the permeability of regional borders in order to increase the production of added value.
The Political Structure Potential analyses the regional political scene on the basis of the following indicators: amount of the submerged economy in the GDP, level of faithfulness detected and ability to decentralise the decision making processes. A high level of decentralisation and therefore a heavy influence of the region in the planning the regional policy, combined with a low economic submerged value in relation to the GDP enables an effective regional policy and good growth prospects.
These three factors do not have particularly favourable effects for Veneto which when compared comes below the European average. It must be remembered that the evaluation concerning the political structure is calculated on a national basis and cannot be significantly influenced by individual regions.
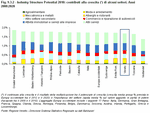
The sub index Industry Structure Potential measures the growth potential of a region for the years 2012-2020 on the basis of an average growth estimation worked out for each sector in Western Europe on one hand, and the current regional economic structure on the other. The potential growth for Western Europe (and not for the whole of Europe) is calculated by also including the inclination to move production to Countries with low-cost workforce in the estimations. This inclination crucially influences the growth prospects of a sector in a given area. Note that this procedure does not take the regional dynamics of the individual sectors into account (Figure 9.3.1).
The depiction of Veneto's sector structure obtained as described above shows the car manufacturing, precision equipment, constructions, automobile sales and repairs and wholesale sectors such as transport and communication to be in a favourable position.
The other sectors with high growth potential expected for 2020 are the chemical industry, the post and telecommunications, the financial intermediation, insurance, IT and professional and entrepreneurial activities. These fields are in development in Veneto but still represent a share of added value below that of the Western European average.
The fashion and furniture sector on which a considerably large part of Veneto's economy relies is shown to be attributed a lower growth potential. A negative development for the Western European sector is obtained above all due to either the transferral (always more diffused on this sector) of production in Countries with low-cost workforce, or the large acceleration of the competitiveness of emerging economies, particularly the Asiatic ones. As concerns this matter, it is important to remember that the potential growth is not calculated on a regional but rather a Western European level, making sure that any typically regional dynamics are ignored.
Actually, the fashion and furniture sector related to the Italian regions represents an exception with regard to the poor growth prospects of the sector on a Western European level. In fact, as suggested in chapter 12, a certain type of manufacturing, which is traditional, yet of quality, known as "il bello e ben fatto" (beautiful and well made) combining hand-made features with a high level of innovation cannot be delocalised. Keeping the production of these products in Veneto even becomes a strong point because here in particular, the production chains for leather and footwear, clothing, jewellery, eyewear, furniture, food and agriculture, sports articles and metal-mechanic manufacturing represent excellence and receive a large demand from abroad.
The fact that these sectors have a poor growth potential in the rest of Western Europe can favour a development of them in Veneto.
A sector which is already able to compete with the other Western European regions is that of car production, to which a high potential growth is attributed and is one of the gems of Veneto's economy.
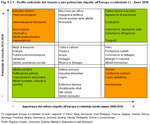
Comparing the sector distribution of the wealth production with the calculated growth potential it is noted that around 43% of the gross added value produced in Veneto is derived from sectors for which a dynamic growth is expected; however, only 13% is attributed to sectors with low growth prospects in Europe. Still more positive is the fact that 25% of the gross added value is found in the green box on the upper right but only 14% in the orange one on the upper left. In the light of all this, it would seem that the Veneto economy shows a potentially solid sector composition. However, a judgement of the potential competitiveness can only be formulated after having compared the situation in Veneto with that present in the other benchmark regions.
The main points as well as the improvement margins are also highlighted. As regards the secondary sector, the chemical and electronics industries are numbered amongst the pillars of world growth; however, Veneto shows a relatively low added value share in this area. As concerns the tertiary sectors, few banks and insurance and business services appear in terms of added value share compared to that of Western Europe. In particular, it is expected that an increase in added value share in the business services sector can positively influence the regional economic growth, as it not only allows a high potential growth but also represents the biggest sector in terms of added value share.
In the light of the growth prospects calculated on the basis of the Western Europe the mechatronics and metals industry in Veneto could generate a larger contribution to growth and have the opportunity to assume the role of the industrial sector responsible for driving the regional economy. (Figure 9.3.2)
The Industry Structure Potential analyses the current economic structure with reference to future growth prospects. A strong regional concentration of sectors which have achieved high growth rates represents an opportunity for ensuring the long-term sustainability of the positive trend. On the other hand, a more than proportional presence of sectors with poor growth prospects presents an obstacle to the potential growth of the entire regional economy.
The subcategory Capacity to Compete studies the productivity of economic sectors subject to inter-regional competition in order to evaluate their competitiveness on the international scene. In the long term, the most productive regions are able to take advantage of the permeability of regional borders in order to increase the production of added value.
The Political Structure Potential analyses the regional political scene on the basis of the following indicators: amount of the submerged economy in the GDP, level of faithfulness detected and ability to decentralise the decision making processes. A high level of decentralisation and therefore a heavy influence of the region in the planning the regional policy, combined with a low economic submerged value in relation to the GDP enables an effective regional policy and good growth prospects.
These three factors do not have particularly favourable effects for Veneto which when compared comes below the European average. It must be remembered that the evaluation concerning the political structure is calculated on a national basis and cannot be significantly influenced by individual regions.
Industry Structure Potential
It is necessary to examine the index related to the Structure Potential in more detail so that it is possible to give useful stimuli for reflection linked to the opportunities of various sectors.The sub index Industry Structure Potential measures the growth potential of a region for the years 2012-2020 on the basis of an average growth estimation worked out for each sector in Western Europe on one hand, and the current regional economic structure on the other. The potential growth for Western Europe (and not for the whole of Europe) is calculated by also including the inclination to move production to Countries with low-cost workforce in the estimations. This inclination crucially influences the growth prospects of a sector in a given area. Note that this procedure does not take the regional dynamics of the individual sectors into account (Figure 9.3.1).
The depiction of Veneto's sector structure obtained as described above shows the car manufacturing, precision equipment, constructions, automobile sales and repairs and wholesale sectors such as transport and communication to be in a favourable position.
The other sectors with high growth potential expected for 2020 are the chemical industry, the post and telecommunications, the financial intermediation, insurance, IT and professional and entrepreneurial activities. These fields are in development in Veneto but still represent a share of added value below that of the Western European average.
The fashion and furniture sector on which a considerably large part of Veneto's economy relies is shown to be attributed a lower growth potential. A negative development for the Western European sector is obtained above all due to either the transferral (always more diffused on this sector) of production in Countries with low-cost workforce, or the large acceleration of the competitiveness of emerging economies, particularly the Asiatic ones. As concerns this matter, it is important to remember that the potential growth is not calculated on a regional but rather a Western European level, making sure that any typically regional dynamics are ignored.
Actually, the fashion and furniture sector related to the Italian regions represents an exception with regard to the poor growth prospects of the sector on a Western European level. In fact, as suggested in chapter 12, a certain type of manufacturing, which is traditional, yet of quality, known as "il bello e ben fatto" (beautiful and well made) combining hand-made features with a high level of innovation cannot be delocalised. Keeping the production of these products in Veneto even becomes a strong point because here in particular, the production chains for leather and footwear, clothing, jewellery, eyewear, furniture, food and agriculture, sports articles and metal-mechanic manufacturing represent excellence and receive a large demand from abroad.
The fact that these sectors have a poor growth potential in the rest of Western Europe can favour a development of them in Veneto.
A sector which is already able to compete with the other Western European regions is that of car production, to which a high potential growth is attributed and is one of the gems of Veneto's economy.
Comparing the sector distribution of the wealth production with the calculated growth potential it is noted that around 43% of the gross added value produced in Veneto is derived from sectors for which a dynamic growth is expected; however, only 13% is attributed to sectors with low growth prospects in Europe. Still more positive is the fact that 25% of the gross added value is found in the green box on the upper right but only 14% in the orange one on the upper left. In the light of all this, it would seem that the Veneto economy shows a potentially solid sector composition. However, a judgement of the potential competitiveness can only be formulated after having compared the situation in Veneto with that present in the other benchmark regions.
The main points as well as the improvement margins are also highlighted. As regards the secondary sector, the chemical and electronics industries are numbered amongst the pillars of world growth; however, Veneto shows a relatively low added value share in this area. As concerns the tertiary sectors, few banks and insurance and business services appear in terms of added value share compared to that of Western Europe. In particular, it is expected that an increase in added value share in the business services sector can positively influence the regional economic growth, as it not only allows a high potential growth but also represents the biggest sector in terms of added value share.
In the light of the growth prospects calculated on the basis of the Western Europe the mechatronics and metals industry in Veneto could generate a larger contribution to growth and have the opportunity to assume the role of the industrial sector responsible for driving the regional economy. (Figure 9.3.2)


