Chapter 2
Economic components and social context
The World Trade Organisation has cut the estimates on world growth of exportations for 2011 due to the global economic slowdown. The prospects have worsened due to the current economic crisis, which is slowing down the growth recorded in the previous months. After the surge of +14.2% recorded in 2010 after the strong contraction of 2009, in 2011 world importation increased by 6.6% and for 2012 a further slowing down is predicted for the growth of world trade, which is expected to become even slower than the growth pace of global wealth.
The crisis of sovereign debts of some Countries of the European Union intensified in the second half of 2011 and could expand throughout Europe giving rise to a slowdown in the economic growth of the entire continent; it now coincides with the slowdown of some new emerging economies, such as Brazil and Russia, which pay the cost of the adaptation measures implemented to contain the rising inflation pressures. Another factor which could impact on the growth prospects of world trade is the increase of raw material prices, especially in light of the political crisis of some Arabic Countries.
The emerging markets, with China in the front row, were the main players in the growth of world trade over the last few years, and even in 2011 they generated the largest share of new trade flows, contrary to industrialised Countries, which at a global level contributed only a share of about 20% of new import. (Figure 2.1.1)
Source: Data and forecast of the International Monetary Fund processed by the Veneto Region - Directorate for the Regional Statistical System
The prospective increase of export involves all the main sectors. The products of the metal machining (+22.9%) and the mechanical industries (+13.9%) as well as the goods from the fashion sector (+12.3%) present growth rates that are higher than the national average. The recovery of 'Made in Italy' was also confirmed by the publication of TPI (Note 2), which places Italy at the top of the world ranking in foreign trade for 2010. Italy was in pole position in three of the fourteen macro sectors examined (textiles, clothing and footwear) and second in another three sectors (mechanical, machining in metal and 'other products'). (Table 2.1.1), (Table 2.1.2)
The most dynamic national export markets are: Saudi Arabia (+39.2% compared to 2010), Switzerland (+30.5%), United Arab Emirates (+28.5%), Mexico (+26.4%), Brazil (+23.4%), Turkey (+19.9%), Japan (+18.1%), Russia (+17.8%) and China (+16.2%). In the last year, the foreign turnover of Italian businesses in China has for the first time surpassed the threshold of ten billion euros. Among the main European partners, Germany (+12.2% compared to 2010), which remains the main reference market for Italian businesses (13.1% of national export), and Romania (+16.4%) recorded growth rates higher than the national average. Export to Great Britain (-0.3%) recorded a slight decline, whereas those to Greece (-13.1%) and Tunisia (-11.1%) are in sharp decline due to strong tensions present in the two Countries.
In 2011, the Italian trade deficit (-24.6 billions euros) recorded a slight improvement compared to 2010. In details, the energy deficit (-61.3 billions euros) grew compared to 2010 (-51.6 billion), whereas the surplus in the exchange of manufactured goods increased significantly: from 31.6 billion euros in 2010 to 49.7 billion in 2011. Among the more export oriented manufacturing sectors, the one that which presented the most significant trade surplus, equal to around 44 billion euros, was the sector of mechanic production, followed by the sectors of fashion (+13.1 billion), electrical appliances (+6.6 billion), metallurgic production (+5.9 billion) and furnishings (+4.4 billion). The value of import of the electrical goods sector greatly exceeded that of export, determining in the last year a trade deficit of a little less than 17 billion euros. The trade deficit of the agri-food sector, which grew slightly compared to the data recorded in 2010, is around 10 billion euros.
The trade balance with Countries of the European Union, while remaining negative (-3 billion euros), recorded a substantial improvement compared to that registered in 2010 (-8 billions). Even the exchange rates towards Non-EU Countries showed a negative balance, equal to around 21 billion euros, in line with that recorded in the previous year.
In 2011, the value of Italian export reached four hundred billion euros with a dynamic growth that in the last year settled at around nine per cent. The growth of import concerned all the main economic sectors, with percentages higher than 16% in the energy sector and in the metal machining sector. Germany remains the main national procurement market, with a share close to 16% of the total import. Continuing to grow is the weight of import from China: in 2011 the value of import coming from the former Celestial Empire reached twenty nine billion euros for the first time.
The leap in foreign turnover of the businesses of Veneto was 10.2%; such remarkable acceleration, which initiated in the last quarter of 2010, became more pronounced in the first quarter of 2011 to then stabilise in the second half of the year. This result puts the region of Veneto in second position in Italy for the value of exported goods, just behind Lombardy. (Figure 2.1.2)
The mechanic sector, which in the last few years constituted the main voice of the exportation of Veneto (20.2% of regional export), in 2011 recorded a growth in foreign sales equal to 18.1%.
The most significant increase, in terms of percentage, was recorded by the sales of metallurgic products: in 2011 the foreign turnover of the sector again reached the values that had been recorder before the crisis, of around six billion euros, equal to an annual growth of around twenty percentage points.
Also good are the results of foreign sales in the fashion sector, which is second place in regional export and recorded a growth close to eight per cent. Veneto export of food products, driven by the good performance of wine, was in line with the dynamics of the previous year: the foreign turnover of the businesses of this sector (4.5 billion euros in 2011) recorded an increase of around eleven per cent.
Germany is the main destination of exports from Veneto. In 2011, Germany absorbed 7.1 billion euros of Veneto products, corresponding to 14.1% of the entire regional export, about 846 million euros more compared to 2010. Germany is followed closely by France, with 5.3 billion (+9.5% compared to 2010), and the United Kingdom; with 2.4 billion euros (+7.8% on 2010) the latter is head and shoulders above Spain (-2.6% in the last year). Also growing are the sales of Veneto products towards Austria (+11.6%), Romania (+12.8%), Poland (+11.6%), the Czech Republic (+14.2%) and Sweden (+15.6%). (Figure 2.1.3)
The most significant progress, +12.6% compared to the value of 2010, were recorded by the export towards Non-EU Countries: +31.6 % towards China, the eighth reference market for the businesses of Veneto, +19.5 % towards Russia, +26.2 % towards Switzerland, +19.8 % towards Turkey, +24.5% towards Brazil and +24.4 % towards India. The negative trend of sales to the United States, however, continued: foreign sales towards the USA, which still remain the third reference market for Veneto exporters, recorded in the last year a decline of about one per cent.
The main area of procurement remains the European Union (26.1 billion euros), which alone represents almost two thirds (64.2%) of the goods imported to Veneto. Germany is the top EU partner for imported goods: in 2011 the value of imported goods reached almost 9.5 billion euros, recording an increase equal to around four per cent compared to 2010. After the European Union, with over 5.6 billion euros of goods, is East Asia (an increase of over two hundred million euros compared to 2010), where the role of China appeared dominant (4 billion euros in 2011, with an increase of 2.7% compared to 2010). The other areas are a lot more further apart, starting from Eastern European Countries, where a strong growth of import is signalled from Russia (almost 250 million euros more compared to 2010), and central Asia, a little over one billion euros, of which about half is attributable to India.
Decisively lower is import coming from other areas, with values of import lower than one billion euros. North Africa indicates a strong decrease in the procurement of raw materials, compensated by the growth of import from the Middle East.
Veneto import shows a trend increase through the main economic sectors, with peaks in metallurgic production (+12.7%), the food sector (+13.7%), chemical production (+10%) and fashion (+10.2%). Other main sectors show a more or less stable dynamics, or a dynamics which is in line with regional growth, with the exception of the electronic sector (-17.7%) and the furniture industry (-9,2%) which present consistent reductions of foreign purchases.
Vicenza, with 14.5 billion euros of export in 2011, was confirmed as the top province in Veneto for the value of exported goods and third in Italy, behind Milan (37.2 billion euros) and Turin (18 billion euros). Treviso, with 10.7 billion euros, securely holds the second position of regional export (seventh nationally), preceding Verona by 1.7 billion euros, a gap just slightly less than the one recorded last year. In fourth position is Padua, with foreign sales equal to 8.3 billion euros, followed by Venice (3.8 billion), Belluno (2.7 billion) and Rovigo, which returned to the values of 2008 (1.3 billion euros).
With regards to import, positive percentage variations were recorded in all the provinces of Veneto, with the only exception of Venice, which in the last year recorded a reduction in the value of foreign procurement equal to -4.6%.
The most consistent increase in regional procurement was recorded in the province of Vicenza (+9.2% compared to 2010), and was determined largely by the consistent increase of the value of import for the metallurgic sector (+227 million compared to 2010) and the fashion sector (+211 millions of Euro). (Table 2.1.3)
The crisis of sovereign debts of some Countries of the European Union intensified in the second half of 2011 and could expand throughout Europe giving rise to a slowdown in the economic growth of the entire continent; it now coincides with the slowdown of some new emerging economies, such as Brazil and Russia, which pay the cost of the adaptation measures implemented to contain the rising inflation pressures. Another factor which could impact on the growth prospects of world trade is the increase of raw material prices, especially in light of the political crisis of some Arabic Countries.
The emerging markets, with China in the front row, were the main players in the growth of world trade over the last few years, and even in 2011 they generated the largest share of new trade flows, contrary to industrialised Countries, which at a global level contributed only a share of about 20% of new import. (Figure 2.1.1)
Source: Data and forecast of the International Monetary Fund processed by the Veneto Region - Directorate for the Regional Statistical System
In Italy
During 2011, Italian exports recorded an increase of +11.4% compared to the previous year, reaching a value equal to 375.8 billion euros. Therefore, the positive trend initiated in 2010 was confirmed (+15.6% compared to 2009) which brought the value of Italian export back to the pre-crisis level of 2008. The contribution of national export was decisive for the growth of the GDP in the last year: the Prometeia institute (Note 1) estimated that the net contribution of export to the growth of national wealth was 1.4% and that for 2012 its positive contribution will be a little above one per cent. The prospective increase of export involves all the main sectors. The products of the metal machining (+22.9%) and the mechanical industries (+13.9%) as well as the goods from the fashion sector (+12.3%) present growth rates that are higher than the national average. The recovery of 'Made in Italy' was also confirmed by the publication of TPI (Note 2), which places Italy at the top of the world ranking in foreign trade for 2010. Italy was in pole position in three of the fourteen macro sectors examined (textiles, clothing and footwear) and second in another three sectors (mechanical, machining in metal and 'other products'). (Table 2.1.1), (Table 2.1.2)
The most dynamic national export markets are: Saudi Arabia (+39.2% compared to 2010), Switzerland (+30.5%), United Arab Emirates (+28.5%), Mexico (+26.4%), Brazil (+23.4%), Turkey (+19.9%), Japan (+18.1%), Russia (+17.8%) and China (+16.2%). In the last year, the foreign turnover of Italian businesses in China has for the first time surpassed the threshold of ten billion euros. Among the main European partners, Germany (+12.2% compared to 2010), which remains the main reference market for Italian businesses (13.1% of national export), and Romania (+16.4%) recorded growth rates higher than the national average. Export to Great Britain (-0.3%) recorded a slight decline, whereas those to Greece (-13.1%) and Tunisia (-11.1%) are in sharp decline due to strong tensions present in the two Countries.
In 2011, the Italian trade deficit (-24.6 billions euros) recorded a slight improvement compared to 2010. In details, the energy deficit (-61.3 billions euros) grew compared to 2010 (-51.6 billion), whereas the surplus in the exchange of manufactured goods increased significantly: from 31.6 billion euros in 2010 to 49.7 billion in 2011. Among the more export oriented manufacturing sectors, the one that which presented the most significant trade surplus, equal to around 44 billion euros, was the sector of mechanic production, followed by the sectors of fashion (+13.1 billion), electrical appliances (+6.6 billion), metallurgic production (+5.9 billion) and furnishings (+4.4 billion). The value of import of the electrical goods sector greatly exceeded that of export, determining in the last year a trade deficit of a little less than 17 billion euros. The trade deficit of the agri-food sector, which grew slightly compared to the data recorded in 2010, is around 10 billion euros.
The trade balance with Countries of the European Union, while remaining negative (-3 billion euros), recorded a substantial improvement compared to that registered in 2010 (-8 billions). Even the exchange rates towards Non-EU Countries showed a negative balance, equal to around 21 billion euros, in line with that recorded in the previous year.
In 2011, the value of Italian export reached four hundred billion euros with a dynamic growth that in the last year settled at around nine per cent. The growth of import concerned all the main economic sectors, with percentages higher than 16% in the energy sector and in the metal machining sector. Germany remains the main national procurement market, with a share close to 16% of the total import. Continuing to grow is the weight of import from China: in 2011 the value of import coming from the former Celestial Empire reached twenty nine billion euros for the first time.
In Veneto
In 2011, exports from Veneto again exceeded the threshold value of fifty billion euros, returning to pre-crisis record levels of 2008. This is a very important result if you consider that such records were achieved in a period in which word trade was inflated by the excess of domestic demand of some reference markets which purchased more than they could afford.The leap in foreign turnover of the businesses of Veneto was 10.2%; such remarkable acceleration, which initiated in the last quarter of 2010, became more pronounced in the first quarter of 2011 to then stabilise in the second half of the year. This result puts the region of Veneto in second position in Italy for the value of exported goods, just behind Lombardy. (Figure 2.1.2)
The sectors
Growth of Veneto export involved all the economic sectors, with the only exception of the aeronautical sector, which is notoriously independent from the cyclic trends of economy and is substantially linked to large job orders: in the last year the value of means of transport sold in foreign markets decreased by about fifteen per cent.The mechanic sector, which in the last few years constituted the main voice of the exportation of Veneto (20.2% of regional export), in 2011 recorded a growth in foreign sales equal to 18.1%.
The most significant increase, in terms of percentage, was recorded by the sales of metallurgic products: in 2011 the foreign turnover of the sector again reached the values that had been recorder before the crisis, of around six billion euros, equal to an annual growth of around twenty percentage points.
Also good are the results of foreign sales in the fashion sector, which is second place in regional export and recorded a growth close to eight per cent. Veneto export of food products, driven by the good performance of wine, was in line with the dynamics of the previous year: the foreign turnover of the businesses of this sector (4.5 billion euros in 2011) recorded an increase of around eleven per cent.
The markets
In terms of value, the European Union absorbed about 59% of Veneto overall export, and in 2011 the increase in the foreign sales of the businesses of Veneto towards partners from the European Community was close to nine per cent.Germany is the main destination of exports from Veneto. In 2011, Germany absorbed 7.1 billion euros of Veneto products, corresponding to 14.1% of the entire regional export, about 846 million euros more compared to 2010. Germany is followed closely by France, with 5.3 billion (+9.5% compared to 2010), and the United Kingdom; with 2.4 billion euros (+7.8% on 2010) the latter is head and shoulders above Spain (-2.6% in the last year). Also growing are the sales of Veneto products towards Austria (+11.6%), Romania (+12.8%), Poland (+11.6%), the Czech Republic (+14.2%) and Sweden (+15.6%). (Figure 2.1.3)
The most significant progress, +12.6% compared to the value of 2010, were recorded by the export towards Non-EU Countries: +31.6 % towards China, the eighth reference market for the businesses of Veneto, +19.5 % towards Russia, +26.2 % towards Switzerland, +19.8 % towards Turkey, +24.5% towards Brazil and +24.4 % towards India. The negative trend of sales to the United States, however, continued: foreign sales towards the USA, which still remain the third reference market for Veneto exporters, recorded in the last year a decline of about one per cent.
Trade Balances
2011 closed with a trade surplus of 9.7 billion euros, marking an increase higher than two billion euros compared to the balance of the previous year, due to an export dynamics higher than that of import. The trade balance per geographical area presents strongly positive data with reference to the relationship with the partners from EU27 (+3.6 billion euros), North America (+2.7 billion), the Middle East (+1.2 billion) and Eastern European Countries (+966 million euros), whereas the data are negative for Eastern Asia (-1.4 billion euros) and Central Asia (-477 million euros), albeit they have increased compared to 2010. The economic sectors which favour the surplus of the regional trade balance are the mechanical sector (+7.8 billion euros in 2011), the jewellery and eyewear sectors (+2.9 billion), the manufacture of electrical equipment (+2.4 billion) and the fashion sector (+1.9 billion). There is however, a trade deficit in the sectors of transport (-4.4 billion euros), food (-1.1 billion) and electronic products (-940 million euros). (Figure 2.1.4), (Figure 2.1.5)Import
During 2011, Veneto import recorded an increase of 5.9% compared to 2010, reaching a value equal to 40.6 billion euros.The main area of procurement remains the European Union (26.1 billion euros), which alone represents almost two thirds (64.2%) of the goods imported to Veneto. Germany is the top EU partner for imported goods: in 2011 the value of imported goods reached almost 9.5 billion euros, recording an increase equal to around four per cent compared to 2010. After the European Union, with over 5.6 billion euros of goods, is East Asia (an increase of over two hundred million euros compared to 2010), where the role of China appeared dominant (4 billion euros in 2011, with an increase of 2.7% compared to 2010). The other areas are a lot more further apart, starting from Eastern European Countries, where a strong growth of import is signalled from Russia (almost 250 million euros more compared to 2010), and central Asia, a little over one billion euros, of which about half is attributable to India.
Decisively lower is import coming from other areas, with values of import lower than one billion euros. North Africa indicates a strong decrease in the procurement of raw materials, compensated by the growth of import from the Middle East.
Veneto import shows a trend increase through the main economic sectors, with peaks in metallurgic production (+12.7%), the food sector (+13.7%), chemical production (+10%) and fashion (+10.2%). Other main sectors show a more or less stable dynamics, or a dynamics which is in line with regional growth, with the exception of the electronic sector (-17.7%) and the furniture industry (-9,2%) which present consistent reductions of foreign purchases.
The Provinces
In 2011, all the Veneto provinces contributed positively to the increase of regional export: the highest percentage growth was observed in the province of Rovigo (+20.2% compared to 2010), corresponding in terms of value to an increase in foreign sales equal to about 200 million euros; it is closely followed by Padua, which recorded an increase in foreign sales of about sixteen percentage points (+1,128 million euro compared to the previous year); the increase for Vicenza and Verona was nearly eleven per cent (respectively +10.9% and +10.6). Foreign sales are growing, even if slightly below the regional average, for businesses in Belluno (+9.1%) and Treviso (+8%), whereas the export of the province of Venice, which was affected by the standstill of the foreign sales in the naval sector, stopped at the levels recorded in 2010 (+0.3%).Vicenza, with 14.5 billion euros of export in 2011, was confirmed as the top province in Veneto for the value of exported goods and third in Italy, behind Milan (37.2 billion euros) and Turin (18 billion euros). Treviso, with 10.7 billion euros, securely holds the second position of regional export (seventh nationally), preceding Verona by 1.7 billion euros, a gap just slightly less than the one recorded last year. In fourth position is Padua, with foreign sales equal to 8.3 billion euros, followed by Venice (3.8 billion), Belluno (2.7 billion) and Rovigo, which returned to the values of 2008 (1.3 billion euros).
With regards to import, positive percentage variations were recorded in all the provinces of Veneto, with the only exception of Venice, which in the last year recorded a reduction in the value of foreign procurement equal to -4.6%.
The most consistent increase in regional procurement was recorded in the province of Vicenza (+9.2% compared to 2010), and was determined largely by the consistent increase of the value of import for the metallurgic sector (+227 million compared to 2010) and the fashion sector (+211 millions of Euro). (Table 2.1.3)
Figure 2.1.1

Table 2.1.1
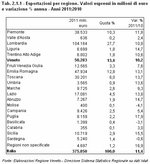
Table 2.1.2
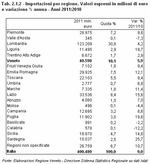
Figure 2.1.2

Figure 2.1.3

Figure 2.1.4
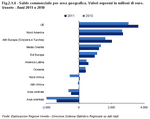
Figure 2.1.5
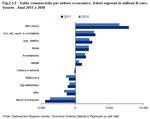
Table 2.1.3

In Italy
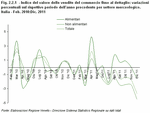
At the end of 2011, the sales index of fixed retail trade records a contraction of 1.3% compared to the previous year, summarising the stability of food sales and the reduction of 1.8% in sales of non food products. The difficulty of the market can be observed in all forms of distribution: the small shops recorded a contraction of 1.4% and even the large retailers, for the first time since the beginning of the economic crisis in 2008, ended the year with the negative result of -0.9%. (Figure 2.2.1)In Veneto
The sales data of Veneto are not available for the year 2011, but the trend of the previous years allows to assume that the regional dynamics is similar to the national one, with a contraction of sales more pronounced with regards to the non food sector and the small shops. The number of commercial concerns with fixed offices and premises in Veneto in 2011 maintained a substantial equilibrium compared to the previous year: also continuing is the reduction of the number of business offices and premises in the last year and the growth of local units which are not the main offices or premises of a business. The concerns specialising in the sales of computer equipment and telecommunications are are the fastest in growth (+3.4%), followed by non specialised shops, which grew by 0.6% per annum. Suffering a weakening during 2011 however, were the concerns specialising in the sale of automotive fuel (-0.2%), cultural and recreational items (-0.8%) and other products for domestic use (-1.5%). Venice, Verona and Rovigo registered an increase in commercial activity during 2011; Padua is in fact the province which was most affected by the market difficulty, with a drop of 1% of its commercial concerns. (Figure 2.2.2)
Itinerant trade showed a good performance in 2011, with an annual growth of 1.3%: the itinerant vendors of furniture and household articles showed healthy growth (+7.1%), as well as the itinerant vendors of clothing, fabric, footwear and leather goods (+1.5%); itinerant trade of food products however, shrunk by 1.2% compared to 2010.
With regards to retail outside shops, stalls and markets, the explosion of e-commerce should be noted: the activity of sales made exclusively via the internet grew in a single year by more than 18 per cent, reaching a number of nearly 700 commercial concerns in Veneto. (Table 2.2.1)
In 2010, Department Stores Retailing (DSR) developed in Veneto, following the continual expansion of the most well-structured distribution forms, occurred in the last few years: the growth of specialised areas is evident, with an increase of 4.2% of commercial concerns and of 9.4% of employees in 2010. Despite the fact that this distribution format operates in the non food sector, which was most hit by the contraction of sales, it remained the most dynamic due to its strengths, especially the wide range of specific product categories and customer service if offers.
In the same year, large department stores, supermarkets and hypermarkets grew at a good rate (overall +3.6% per annum), but without a corresponding increase in the number of their employees however (-0.2%).
That of mini-markets is the only type of retailing to undergo a reduction in the number of shops, in the shop sales surface area and in the labour force (respectively -3%, -3.3% and -2.4%); these commercial concerns, of small-medium size, operating in the food sector and located in urban centres, have been in decline for years in Veneto.
2.3 The situation of agricultural economy (Note 3)
In 2011, the value of the agricultural production of Veneto appeared to be growing, being estimated at about 5 billion euros, with an increase of 5% compared to the previous year, and therefore almost recovering the highest levels of the last decade. Not all the agricultural sectors contributed in equal measure to this result: herbaceous crops in fact suffered a decline (-3.5%), especially due to the disappointing performance of the horticultural segment, whereas woody crops recorded an increase of about 17%, this mainly because of the good trade results achieved by wine products. Even animal husbandry, after some years characterised by market heaviness, benefited from a significant increase of value (+8.8%) due to the increase in the prices of the productions.
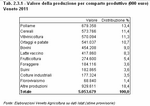
The deficit of the trade balance of Veneto food products increased compared to the previous year: in 2011 it exceeded 1 billion euros (+25% compared to the previous year) due to the greater increase in imports (5.6 billion of purchased goods, +13.7%) compared to exports (4.5 billion of goods sold, +11.1%). (Table 2.3.1)
With regards to industrial crops, a notable drop was observed in the number of hectares cultivated with sugar beet (-37%), which however obtained higher levels of production (3,100 €/ha, +48%) due to its high degree of popularity and market demand. The surface area of soy increased by 19% (77,000 ha), production raised by 14%, and on average traded up 10%, whereas the cultivation of tobacco decreased notably (-22%) and showed a decrease in average price equal to 5-10%. Still in decline is the surface area cultivated with sunflowers (-4%), whereas rapeseed, after five years of continual expansion, hits a standstill: its surface area declined by 16% and production by 21%.
For fruit crops, it was a year of light and shade, with opposite results for the different crops. The apple tree confirmed the results of the previous year, both for the quantity produced and for the market price, whereas the pear tree recorded a slight increase in production (2.3%) but a corresponding drop in prices (-3.8%). Peaches suffered a fall in price (-10.7%), while apricots, cherries and kiwis recovered from the disappointing prices from the previous year.
The Prosecco phenomenon, after the revision of the name in 2009 with the new CMO, appeared to have had a significant impact on the structural characteristics of winemaking in Veneto.
The Glera variety - from the grapes of which we get the Prosecco wine - was the top vine in Veneto with a share of 25.7%, followed at a notable distance by Garganega (13.4%), Merlot (10.1%), Pinot grigio (9.8%) and Corvina (8.3%). The data relative to the declared production of grapes with Denomination of Origin confirmed the result of Prosecco DOC with a share of 34.5%, followed by Valpolicella with a share of 14.6%. In third place is again a Prosecco: the Conegliano-Valdobbiadene DOCG with 13.6%, which was above two DOCs from Verona (Soave 10.6% and Bardolino 6.4%).
From a commercial point of view, 2011 was a positive year, after the 2009 crisis and the signs of recovery in 2010. The average price of grapes recorded at the commodity exchanges in Veneto increased by 27%, whereas according to the data collected by Ismea (Institute for services to the agricultural and food market), the average price at origin of DOC-DOCG white wines on the Treviso market rose on an annual basis by 28.7% and that of DOC-DOCG red wine on the market of Verona rose by 31.9%. Also the export of Italian wine increased, of which Veneto holds the 'majority share', equal to 29.6%.
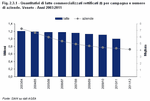
The price of milk in 2011 continued the slow climb already observed during the previous year, after having touched the historic minimum of the last 15 years in 2009. The average price therefore amounted to 38-40 euros/100 litres + VAT, about 10% higher compared to the average annual price recorded in 2010. Prices also increased for the main DOP cheeses (having Protected Denomination of Origin): Grana Padano, the production of which records a considerable increase (+17%) in Veneto, Asiago (+6% the average price of pressed Asiago), and Montasio. (Figure 2.3.1)
The national data available for 2011 show that the production of beef and veal meat in Veneto decreased by 6.7% compared to the previous year, falling just under 200,000 tonnes. This trend was due to the stagnation of domestic consumption and the difficulty of the farmers, who were not sufficiently compensated against the strong increase in production costs (especially energy and feed) caused by the rise in the price of cereals during the first quarter of 2011. The number of the meat and mixed product farmers or meat farmers active in Veneto declined by 5.9% compared to the previous year, with a contraction which affected the medium-small farmers the most. (Table 2.3.2)
Consequently, the cattle population of Veneto has suffered a decline of 3.4% on a one-year basis, mainly due to a reduction in the number of calves. (Table 2.3.3)
The reduced availability of animals for procurement on the national and foreign markets consolidated the contraction trend of the supply: in Veneto the import of live animals also suffered a decline which was equal to 3.6% overall. The majority of imported bovines is represented by feed-lot cattle from France (420,000 head of cattle), a Country that further reinforced its leadership. From a commercial point of view, the price of feed-lot cattle presented a general downward trend, with an annual average lower than 3% compared to the previous year, while the market of slaughter animals recorded an average recovery quantifiable between 4 and 6%, depending on the breed. (Table 2.3.4)
The pig breeding in Veneto is mainly aimed at the production of heavy pigs intended for the DOP production chain, which in the last few years maintained a quantity of animals slaughtered per annum equal to 600/650,000, corresponding to about 8% of the national total.
At the end of 2011, the availability of pork was estimated to have declined at the national level, especially due to a decrease in domestic production (-3%). A strong decline is expected in the slaughter of growing pigs (-35%), whereas a smaller decline is forecasted for fattening pigs (-1.8%), especially for the animals of the DOP circuit. Also to be noted is the significant decrease in sows in the first six months of 2011(-7.5%), which is indicative of the production plans of the farmers for the future. The reduction in the supply from domestic production, however, was largely offset by the increase of import (+3%), whereas the average annual sales of heavy pigs recorded a net improvement compared to 2010 (+15.5%) reaching 1.41 euro/kg in Mantua. The household consumption of pork slightly decreased in quantity (-0.5%) and increased in value (+1.5%), probably due to replacement with beef and veal meat.
Poultry production, of which Veneto had a large share at a national level (40%), has increased. The annual data on the slaughters showed an increase for chickens above 2 kg (+4% in deadweight) and for turkeys (+3.7%). The demand for poultry meat remained substantially positive and the average annual prices increased by about 15% for chickens and about 12% for turkeys. Egg production remained stable, equal to about 2 billion pieces, corresponding to 15% of the national production.
The rabbit segment ended the year 2011 in partial recovery compared to the difficulties met in the previous year. A decrease of 2-3% is estimated for production in Veneto, mainly because of the suspension the activity of many medium-large breeding farms due to myxomatosis and enteric problems (depopulation) and should slightly exceed the number of 19 million rabbits slaughtered. However, the trend of quotations in 2011 was more favourable, with an average annual value equal to 1.79 euro/kg (+4%) for the heavy rabbit in Verona.
Looking at the major regional markets, it is noted that in 2011 the transit at the fish market of Chioggia amounted to 11,361 tonnes (-19.1%), while the overall value obtained was equal to 41.6 millions of euros (-9.1%). This significant decline interested both the local product and the domestic product, which fell by 21.8% and 17.9% respectively. The fish market in Venice, characterised by a larger share of foreign catch, showed greater resilience, recording 9,900 tones of transit, similar to the previous year, and a value which reached 59.8 million euros, resulting in a growth of 4.7%.
The number of boats in the fishing fleets of Veneto continues to decrease, slowly but steadily: as of 31st March 2012 in Veneto there were 724 fishing boats registered on the Fleet Register of the European Union, with a drop of 7 units compared to the situation recorded at the end of 2011 (-1.0%). The businesses operating in fisheries and aquaculture reached 3,016 active units in 2011, with an increase of 20 units (+0.7%) compared to the previous year, in which a slight drop was recorded in the number of the businesses operating in fisheries (-1.1%) and a simultaneous increase (+2.6%) in the number of breeding farms. (Table 2.3.5)
The deficit of the trade balance of Veneto food products increased compared to the previous year: in 2011 it exceeded 1 billion euros (+25% compared to the previous year) due to the greater increase in imports (5.6 billion of purchased goods, +13.7%) compared to exports (4.5 billion of goods sold, +11.1%). (Table 2.3.1)
Businesses and employment
Still in decline is the number of agricultural farms in Veneto. Those active enrolled on the registries of the Chambers of Commerce fell in 2011 to about 73,800 units, with a contraction of 2.3% compared to the previous year, still lower than the national average variation (-3%). Regarding the food businesses, their numbers remained stable, around 3350 units, in contrast to the contraction which occurred overall in the regional manufacturing sector (-1.3%). The number of agricultural workers increased (+5%), reaching 69,769 units due to an increase both in self-employed workers (+4%) and, to a greater extent, in employed workers (+7%). At the national level, however, a decrease of employment in agriculture was observed, equal to 2%.Cereals and industrial crops
Cereal crops had a good hold on the market, which resulted, especially in the first part of 2011, in an increase in their average prices compared to the previous year. Corn was confirmed as the main crop in Veneto, with an increase by 10% in the cultivated surface area, which reached 250,000 hectares, and a raise by 13% of the quantity produced, equal to 2.5 million tonnes. The average annual price is calculated at 224.3 euro/tonne, increasing by 33% compared to the previous year. The increase in corn cultivation corresponded to a decrease in wheat, which fell to 85,000 hectares (-10%) and 500,000 tonnes produced (14%), but with average prices higher than 37%, and of durum wheat, the production of which fell to 46,000 tonnes, determined a price increase of 54% compared to 2010. The trends were similar for barley (the surface area decreased by 12% and production by 11%, but the average price increased by 32%), while rice showed an increase of the invested surface area by 10% and in price by 26%. With regards to industrial crops, a notable drop was observed in the number of hectares cultivated with sugar beet (-37%), which however obtained higher levels of production (3,100 €/ha, +48%) due to its high degree of popularity and market demand. The surface area of soy increased by 19% (77,000 ha), production raised by 14%, and on average traded up 10%, whereas the cultivation of tobacco decreased notably (-22%) and showed a decrease in average price equal to 5-10%. Still in decline is the surface area cultivated with sunflowers (-4%), whereas rapeseed, after five years of continual expansion, hits a standstill: its surface area declined by 16% and production by 21%.
The fruit and vegetable sector
In 2011, the surface area sown with vegetables had a slight increase, rising overall to about 33,400 hectares (+2%). The variation especially involved tuber plants, which recorded a relevant increase of investments (4,000 hectares, +14%), and to a lesser extent open-grown vegetables (25,800 hectares, +1%), whereas greenhouse vegetables dropped to about 3,500 hectares (-3%). The disappointing sales of the horticulture segment, mainly due to the heaviness of the markets and to the alarm for the bacterium 'E. Coli', determined a negative variation in the production value (-9%), falling to 541 million euros. Contrary to this was radicchio, which for some varieties recorded an increase in average price equal to 14%.For fruit crops, it was a year of light and shade, with opposite results for the different crops. The apple tree confirmed the results of the previous year, both for the quantity produced and for the market price, whereas the pear tree recorded a slight increase in production (2.3%) but a corresponding drop in prices (-3.8%). Peaches suffered a fall in price (-10.7%), while apricots, cherries and kiwis recovered from the disappointing prices from the previous year.
The wine sector
The 2011 vintage substantially confirmed the productive levels of the last few years with a declared production of 11.2 million tonnes of grapes, corresponding to about 8.2 million hectolitres of wine. Taking into consideration also the grapes imported from other Italian regions, Veneto should be able to produce a quantity of wine equal to 9.5 million hectolitres, strongly oriented to quality, as 41.8% of the wine it produces is marked with the Denomination of Origin, whilst 41.1% is marked with the Geographical Indication of Origin. The Prosecco phenomenon, after the revision of the name in 2009 with the new CMO, appeared to have had a significant impact on the structural characteristics of winemaking in Veneto.
The Glera variety - from the grapes of which we get the Prosecco wine - was the top vine in Veneto with a share of 25.7%, followed at a notable distance by Garganega (13.4%), Merlot (10.1%), Pinot grigio (9.8%) and Corvina (8.3%). The data relative to the declared production of grapes with Denomination of Origin confirmed the result of Prosecco DOC with a share of 34.5%, followed by Valpolicella with a share of 14.6%. In third place is again a Prosecco: the Conegliano-Valdobbiadene DOCG with 13.6%, which was above two DOCs from Verona (Soave 10.6% and Bardolino 6.4%).
From a commercial point of view, 2011 was a positive year, after the 2009 crisis and the signs of recovery in 2010. The average price of grapes recorded at the commodity exchanges in Veneto increased by 27%, whereas according to the data collected by Ismea (Institute for services to the agricultural and food market), the average price at origin of DOC-DOCG white wines on the Treviso market rose on an annual basis by 28.7% and that of DOC-DOCG red wine on the market of Verona rose by 31.9%. Also the export of Italian wine increased, of which Veneto holds the 'majority share', equal to 29.6%.
Animal husbandry
Despite the further reduction in the number of the breeding farms of the dairy segment of Veneto, which fell to 4,116 units (-3.9%), in the production season 2010/11, 11 million quintals were reached, as in the previous year; this after seven consecutive years during which production declined overall by 8%. The surplus production amounted to 37,000 quintals, but as the national reference quantity was not exceeded, no fine will be charged to the producers of Veneto for the corresponding production season. The price of milk in 2011 continued the slow climb already observed during the previous year, after having touched the historic minimum of the last 15 years in 2009. The average price therefore amounted to 38-40 euros/100 litres + VAT, about 10% higher compared to the average annual price recorded in 2010. Prices also increased for the main DOP cheeses (having Protected Denomination of Origin): Grana Padano, the production of which records a considerable increase (+17%) in Veneto, Asiago (+6% the average price of pressed Asiago), and Montasio. (Figure 2.3.1)
The national data available for 2011 show that the production of beef and veal meat in Veneto decreased by 6.7% compared to the previous year, falling just under 200,000 tonnes. This trend was due to the stagnation of domestic consumption and the difficulty of the farmers, who were not sufficiently compensated against the strong increase in production costs (especially energy and feed) caused by the rise in the price of cereals during the first quarter of 2011. The number of the meat and mixed product farmers or meat farmers active in Veneto declined by 5.9% compared to the previous year, with a contraction which affected the medium-small farmers the most. (Table 2.3.2)
Consequently, the cattle population of Veneto has suffered a decline of 3.4% on a one-year basis, mainly due to a reduction in the number of calves. (Table 2.3.3)
The reduced availability of animals for procurement on the national and foreign markets consolidated the contraction trend of the supply: in Veneto the import of live animals also suffered a decline which was equal to 3.6% overall. The majority of imported bovines is represented by feed-lot cattle from France (420,000 head of cattle), a Country that further reinforced its leadership. From a commercial point of view, the price of feed-lot cattle presented a general downward trend, with an annual average lower than 3% compared to the previous year, while the market of slaughter animals recorded an average recovery quantifiable between 4 and 6%, depending on the breed. (Table 2.3.4)
The pig breeding in Veneto is mainly aimed at the production of heavy pigs intended for the DOP production chain, which in the last few years maintained a quantity of animals slaughtered per annum equal to 600/650,000, corresponding to about 8% of the national total.
At the end of 2011, the availability of pork was estimated to have declined at the national level, especially due to a decrease in domestic production (-3%). A strong decline is expected in the slaughter of growing pigs (-35%), whereas a smaller decline is forecasted for fattening pigs (-1.8%), especially for the animals of the DOP circuit. Also to be noted is the significant decrease in sows in the first six months of 2011(-7.5%), which is indicative of the production plans of the farmers for the future. The reduction in the supply from domestic production, however, was largely offset by the increase of import (+3%), whereas the average annual sales of heavy pigs recorded a net improvement compared to 2010 (+15.5%) reaching 1.41 euro/kg in Mantua. The household consumption of pork slightly decreased in quantity (-0.5%) and increased in value (+1.5%), probably due to replacement with beef and veal meat.
Poultry production, of which Veneto had a large share at a national level (40%), has increased. The annual data on the slaughters showed an increase for chickens above 2 kg (+4% in deadweight) and for turkeys (+3.7%). The demand for poultry meat remained substantially positive and the average annual prices increased by about 15% for chickens and about 12% for turkeys. Egg production remained stable, equal to about 2 billion pieces, corresponding to 15% of the national production.
The rabbit segment ended the year 2011 in partial recovery compared to the difficulties met in the previous year. A decrease of 2-3% is estimated for production in Veneto, mainly because of the suspension the activity of many medium-large breeding farms due to myxomatosis and enteric problems (depopulation) and should slightly exceed the number of 19 million rabbits slaughtered. However, the trend of quotations in 2011 was more favourable, with an average annual value equal to 1.79 euro/kg (+4%) for the heavy rabbit in Verona.
Sea fishery
The data on sea fishery show for 2011 a consistent drop in quantity in Veneto, falling to 30,659 tonnes with a relative loss of -9.9% compared to the previous year. Looking at the major regional markets, it is noted that in 2011 the transit at the fish market of Chioggia amounted to 11,361 tonnes (-19.1%), while the overall value obtained was equal to 41.6 millions of euros (-9.1%). This significant decline interested both the local product and the domestic product, which fell by 21.8% and 17.9% respectively. The fish market in Venice, characterised by a larger share of foreign catch, showed greater resilience, recording 9,900 tones of transit, similar to the previous year, and a value which reached 59.8 million euros, resulting in a growth of 4.7%.
The number of boats in the fishing fleets of Veneto continues to decrease, slowly but steadily: as of 31st March 2012 in Veneto there were 724 fishing boats registered on the Fleet Register of the European Union, with a drop of 7 units compared to the situation recorded at the end of 2011 (-1.0%). The businesses operating in fisheries and aquaculture reached 3,016 active units in 2011, with an increase of 20 units (+0.7%) compared to the previous year, in which a slight drop was recorded in the number of the businesses operating in fisheries (-1.1%) and a simultaneous increase (+2.6%) in the number of breeding farms. (Table 2.3.5)
2.4 There are still difficulties for businesses, but the two year period which has just ended was better than 2009.
In Italy
The year 2010 allowed a glimpse at the path of recovery, raising expectations for the contraction of 2009 to be recovered in the present or in the next future. The year 2011, which has just ended, partly confirmed such expectations, but also registered a slowing down that raised some uncertainties about the ability of the system to recover.The economic crisis which has been accompanying Italy for some years has inevitably lead to a reduction of the vitality of the Italian entrepreneurial system, with birth and death rates for businesses different from those recorded at the beginning of the decade. This trend has however diminished in recent years: at the end of 2009 the contraction of active Italian businesses was 0.9% per annum, whereas in 2011 it was only -0.1% compared to 2010.
In an especially hostile economic situation it is obviously more difficult to believe and invest in a new productive activity; indeed the birth rate of businesses has been mostly affected by the difficulties that Italy is facing, reaching thus a value equal to 7.4 of newly registered businesses out of every 100 active businesses over the last year, a rate which has decreased by 4.6% compared to 2010.
Fortunately, the modest decline in the birth rate of businesses was accompanied by a very slight increase in their death rate: to summarise, the entrepreneurial balance (Note 4) was -0.04%, i.e. close to zero.
In 2011 the economic dynamics of the Italian production system was supported once again by stock companies, which grew by almost 3 per cent compared to 2010. In the same period, partnerships and one-man businesses suffered a decline of 0.1% and 0.7% respectively.
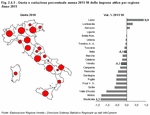
Last year, like the previous ones, closed with a reduction of the agricultural and manufacturing sectors equal to -2.6% and -1.5% per annum, respectively. The services sector however, continued to cope with difficulties, touching on 1% growth in 2011: the sectors that have best reacted are accommodation and catering services (+2.2%), services to businesses (+2.0%) and services to the person (education +6.3%, health +5.1%, other social and personal services +1.4%). (Figure 2.4.1)
Italian artisan businesses are also still suffering, since the negative trend of recent years continues and 2011 closed with -0.6% of active businesses.
The Italian regions which recorded an increase of the active businesses in their territory are only 3: Lazio closed 2011 with an increase in business activities close to 1%, whereas Lombardy and the Abruzzi stopped a little above zero. The regions affected by major decrease in the last year are the Aosta Valley, Molise and Basilicata, all with a contraction of over 1 per cent per annum.
In Veneto
The business of Veneto have overall been able to maintain a substantial equilibrium even in 2011: the very weak economic cycle of the year which has just ended, has certainly not supported the business vitality of the region, and the entrepreneurial activity closed the year with a decline equal to -0.3%. The annual net variation of the primary sector is however positive, +0.1%. Veneto remains one of the most important regions for share of businesses out of the national total: in 2011, with 8.6% of the national businesses, Veneto was the fourth Italian region, after Lombardy, Campania and Lazio.As is the case at the national level, in Veneto also the most obvious sign of the difficulties that the production system is facing is the decline of the birth rate of businesses, which last year decreased by 4.3%, reaching 6.7 new business out of every 100 active businesses, a rate lower than the national average.
The death rate of businesses, equal to 7.0% in 2011, provides positive information, as it continues to remain stable compared to 2010 and is the lowest at the national level.
To summarise the trend of birth and death rates of the businesses of Veneto, we observe a slightly negative entrepreneurial balance equal to -0.3%.
One-man businesses and partnerships are actually the enterprises most hit by the current economic difficulties: both, in fact, suffered a downsizing of 0.8% in the last year. The stock companies of Veneto however, typically larger and more structured, registered a net increase: even more than 2 per cent. Even the small forms, including cooperatives and consortia, closed the year with a positive variation compared to the previous year +0.6%.
Verona and Padua, the top two provinces of Veneto for share of active businesses, are also the ones that suffered the greatest decline in 2011, -0.8% and -1.3% per annum respectively. Vicenza, the leader of Veneto exports, recorded the best result of 2011, with +0.5% of active businesses, also due to the essential contribution to growth coming from its opening to international markets. Treviso and Venice in the course of 2011 achieved a slight increase in the number of their businesses, both with +0.2% per annum, where as Belluno stopped at -0.5% compared to 2010. (Figure 2.4.2)
Even the year just ended saw the service sector maintain its leading role within the economy of Veneto: in the last year, the sector grew by 0.6%, consolidating the increasingly important weight of services; the business operating in the service sector were 54% of the regional production activities. In top place is services to businesses, which closed the year with a net growth of +2.0%; followed by banking and financial services, +1.3%, hotels and restaurants, +1.2%, and other social services and services to the person, +1%. In 2011, the top sector of Veneto, trade, suffered a slight drop of -0.2%, perhaps because of the relative stagnation caused in the market by the decline in demand. Transport is the only service sector to experience consistent economic difficulties, with a reduction of active businesses of 1.9%, which is probably to be due to the high exposure of the sector to the changes in oil prices.
The downsizing of industrial and agricultural businesses continued in the course of 2011: the primary sector lost 2.2% of active businesses, manufacturing 1.3% and building construction 0.7%.
The difficulties involved almost all the businesses of the manufacturing industry of Veneto. Metallurgy, wood, furniture, printing and the fashion sector, which together cover almost 60% of the production activities of Veneto, closed the year with a contraction compared to 2010, -2%, -2.6% and -0.7% respectively. Fashion, a sector of excellence for the 'made in Veneto', was able to slow down the fall compared to last year.
Even the mechanic and electronic sectors closed 2011 negatively, with a loss of at least 2 per cent compared to the volumes of the previous year. The difficulties, compared to the trend of 2010, were exacerbated for the manufacture of means of transport, -1.6%, and for the chemical, rubber and plastic sectors, 1.8%.
There are only two sectors, being the traditional heritage of Veneto, which were able to go against the trend compared to the other manufacturing sectors: the jewellery, sports items and eyewear sectors closed the year positively, +1.4%, followed by the food sector, +0.1%.
Artisan businesses
Not even the artisan businesses of Veneto were able to keep themselves afloat in 2011: in the last year they decreased by 1.1%, even more than in 2010 and the national average, a percentage second only to that of the collapse recorded in 2009.The sectors which have positively contributed to the performance of the segment belong to the service industry, mainly services to businesses +4.3%, and accommodation and catering services, +2.4%. The difficulties however, can still be read at 360°: the agriculture and construction sectors closed the year each with -1.5%, the manufacturing industry with -1.4%, trade with -1.1% and transport with -3.8%. (Table 2.4.1)
The enormous potential of Veneto for tourism, enhanced by the entrepreneurial capacity of the operators and by a well-structured and collaborative promotion plan, has allowed the region to achieve its overall record in tourist presence in the year 2011. The proposal of Veneto is multi-faceted, including tourism, culture, food and wine, features of local identity, landscape and territory, and is therefore able to satisfy every request in the best possible way. By contextualising this result in the period of strong economic uncertainty currently in progress, it can be said again and with greater vigour that tourism represents the most important sector for the economy of Veneto, both for the wealth that it produces directly and for the induced economic activities upstream and downstream of the tourism industry.
In 2011, 15.8 million tourists were counted, over one million more compared to the previous year (+8.1%), and a significant increase, although a little more bland, was also recorded in the number of tourist presence (+4.2%), which reached about 63,4 millions, which signals a reduction in average length of stay in holiday resorts (4 days). (Figure 2.5.1), (Table 2.5.1)
The most recent data of tourism in Veneto, relative to the first quarter of 2012, indicates a further increase in arrivals (+3%) and tourist stays (+0.7%) compared to the same period of the previous year, with particular growth in flows to cities of art, lakes and the seaside.
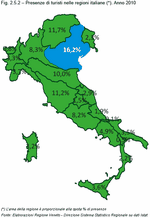
Since several years Veneto is chosen as a holiday destination by millions of tourists and has therefore maintained a leading position among Italian regions; this was also confirmed for 2010 (the last year for which data is available at a national level), totalling 14.8% of arrivals and 16.2% of tourist stays of the entire Country. (Figure 2.5.2)
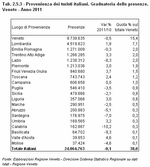
The 2011 record is not solely determined by an increase in the number of foreign tourists but also from a growth in the number of Italian tourists (+2.6%), corresponding to a substantial stability in the number of overnight stays (-0.1%). Regarding the Italians who visit Veneto, most of them come from Veneto; they are, attracted by the offer of their own region, and are 8 per cent more of the tourists coming from Lombardy. Afters years of stability of the top positions, Lazio lost the third position, surpassed by Emilia Romagna and Trentino Alto Adige. (Table 2.5.3)
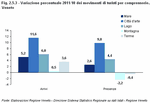
In 2011, the number of tourists grew in all five districts. The famous beaches of Veneto, the cities of art and Lake Garda totalled a new record both of arrivals and stays. Both the mountain and spa resorts are the destination of an increasing number of tourists who stay, however, for a shorter period on average; such habit is growing even more widespread and induces a negative variation in the numbers of tourist presence. (Figure 2.5.3)
2011 was a good year both for hotels (+6% of stays), and for other accommodation facilities (+2.7%), which include campsites, agritourism farms, room-rental, hostels, holiday homes, alpine refuges, B&Bs, etc. In the hotel sector, a strong increase in the demand for high quality lead to a corresponding increase of quality in the offer, partly due to re-classification processes.
It is interesting to compare the phenomenon of tourism in Veneto with that which has happened in the rest of Europe, even if such comparison is limited to tourists registered in hotels, campsites and holiday parks, i.e. to those types of accommodation that can be used for conducting methodologically uniform comparisons at the European level.
In the ranking of European regions based on tourism flow during 2010 (the last year available), Veneto is among the top positions mainly due to foreign tourism (more than 60% of overnight stays). The top ten regions accounted for about a quarter of tourists' overnight stays in the whole of the EU27(Note 5), thus highlighting the key role played in this by the Italy, Spain, the United Kingdom and France, the home Countries of the tourists concerned.
Italy is the top nation for bed-places in hotel facilities, with 18% of the EU27 offer and second with regards to campsites and holiday parks.
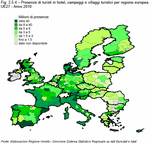
After two years in which tourism flow has reduced in conjunction with the start of the international economic crisis, in 2010 the sector returned to recording increases, with a recovery impetus which seemed to be stronger for Veneto than at the national average and appears to be even greater than the Europe average, with an increase in arrivals of +4.9%, +3.3% and +2.5% respectively. The presence of tourists, which depends on the length of stay, has always showed a quite moderate growth that puts Veneto in line with the national trends and the European trend in general, with an increase of around 1%. (Figure 2.5.4)
Tourism at a global level has been confirmed as an economic sector which continues to grow at a pace of 4%; the World Tourism Organisation quantified a growth of +4.4% of tourist presence in 2011, predicting for 2012 a further +3-4% globally and a projections around +2-4% for Europe.
In 2011, 15.8 million tourists were counted, over one million more compared to the previous year (+8.1%), and a significant increase, although a little more bland, was also recorded in the number of tourist presence (+4.2%), which reached about 63,4 millions, which signals a reduction in average length of stay in holiday resorts (4 days). (Figure 2.5.1), (Table 2.5.1)
The most recent data of tourism in Veneto, relative to the first quarter of 2012, indicates a further increase in arrivals (+3%) and tourist stays (+0.7%) compared to the same period of the previous year, with particular growth in flows to cities of art, lakes and the seaside.
Since several years Veneto is chosen as a holiday destination by millions of tourists and has therefore maintained a leading position among Italian regions; this was also confirmed for 2010 (the last year for which data is available at a national level), totalling 14.8% of arrivals and 16.2% of tourist stays of the entire Country. (Figure 2.5.2)
Origins and destinations
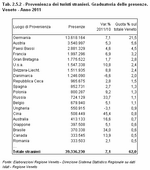
The excellent results of tourism in Veneto in 2011 reflect essentially the trend of foreign tourist flow, which grew compared to the previous year by 11.6% in terms of arrivals and 7.1% in terms of tourist stays. The growth of international tourism slowed at the beginning of the global economic crisis and recovered, albeit slightly, as early as 2009; today the number of regular customers has increased: they come from Germany (+7.1%), Austria (+5.3%), The Netherlands (+4.6%), France (+6.9%) and Switzerland (+8.8%). The number of American and English tourists, essential in particular for the cities of art, also increased (+1.7%) after having suffered from repeated (and the most serious) contractions in recent years. Also increasing are tourism flows from Russia (+33.7%), China (+45.4%) and Brazil (+34%). (Table 2.5.2)The 2011 record is not solely determined by an increase in the number of foreign tourists but also from a growth in the number of Italian tourists (+2.6%), corresponding to a substantial stability in the number of overnight stays (-0.1%). Regarding the Italians who visit Veneto, most of them come from Veneto; they are, attracted by the offer of their own region, and are 8 per cent more of the tourists coming from Lombardy. Afters years of stability of the top positions, Lazio lost the third position, surpassed by Emilia Romagna and Trentino Alto Adige. (Table 2.5.3)
In 2011, the number of tourists grew in all five districts. The famous beaches of Veneto, the cities of art and Lake Garda totalled a new record both of arrivals and stays. Both the mountain and spa resorts are the destination of an increasing number of tourists who stay, however, for a shorter period on average; such habit is growing even more widespread and induces a negative variation in the numbers of tourist presence. (Figure 2.5.3)
2011 was a good year both for hotels (+6% of stays), and for other accommodation facilities (+2.7%), which include campsites, agritourism farms, room-rental, hostels, holiday homes, alpine refuges, B&Bs, etc. In the hotel sector, a strong increase in the demand for high quality lead to a corresponding increase of quality in the offer, partly due to re-classification processes.
It is interesting to compare the phenomenon of tourism in Veneto with that which has happened in the rest of Europe, even if such comparison is limited to tourists registered in hotels, campsites and holiday parks, i.e. to those types of accommodation that can be used for conducting methodologically uniform comparisons at the European level.
In the ranking of European regions based on tourism flow during 2010 (the last year available), Veneto is among the top positions mainly due to foreign tourism (more than 60% of overnight stays). The top ten regions accounted for about a quarter of tourists' overnight stays in the whole of the EU27(Note 5), thus highlighting the key role played in this by the Italy, Spain, the United Kingdom and France, the home Countries of the tourists concerned.
Italy is the top nation for bed-places in hotel facilities, with 18% of the EU27 offer and second with regards to campsites and holiday parks.
After two years in which tourism flow has reduced in conjunction with the start of the international economic crisis, in 2010 the sector returned to recording increases, with a recovery impetus which seemed to be stronger for Veneto than at the national average and appears to be even greater than the Europe average, with an increase in arrivals of +4.9%, +3.3% and +2.5% respectively. The presence of tourists, which depends on the length of stay, has always showed a quite moderate growth that puts Veneto in line with the national trends and the European trend in general, with an increase of around 1%. (Figure 2.5.4)
Some economic indicators and forecasts (Note 6)
The economic sector data processed by CISET, the International Centre of Studies on the Tourism Economy, indicate for 2011 a good growth in Italian tourism income (+10.1% compared to 2010), an especially important result if you consider that it was achieved in a particularly difficult moment for the global economy. In quantitative terms, of the 32,300 million euros of wealth produced by the tourism sector in Italy, a consistent share equal to about 15% is to be attributed to Veneto. The overall context and, in particular, the crisis of North Africa in the Mediterranean basin, in some areas have created some opportunities which allow to better support this negative phase. The regions that have been able to derive benefits from such opportunities, in terms of re-evaluation of tourism destinations, are the ones that, just as Veneto, can boast competitive factors dependent on the availability of traditional cultural products, on proximity to the basins of origin (mainly the German market) and which may be proposed as substitutes with respect to Northern Africa (bathing).Tourism at a global level has been confirmed as an economic sector which continues to grow at a pace of 4%; the World Tourism Organisation quantified a growth of +4.4% of tourist presence in 2011, predicting for 2012 a further +3-4% globally and a projections around +2-4% for Europe.
Labour in Veneto
In the course of 2011, employment presented positive signs of recovery: in Italy, the number of employed grew to about 95 thousand units compared to the previous year (+0.4%) and in Veneto it grew by 22 thousand (+1.1%). The Italian employment rate remains at the levels of 2010 (56.9%), while Veneto recorded a value equal to 64.9%, an increase after two years of decline. Equally encouraging is the unemployment rate: the number of people looking for work in Veneto reduced by 17 thousand units, recovering a good part of the decline recorded between 2009 and 2010. The unemployment rate thus fell from 5.8% in 2010 to 5.0% in 2011 (in Italy it remained equal to 8.4%).Looking more closely at Veneto, in 2010 the 'Sistemi Locali del Lavoro' (SLL) employment monitoring areas of Conegliano and Adria were the highest unemployment black spots: out of 100 people belonging to the labour force more than 7 were searching for employment ; the Venice and Porto Viro areas also presented unemployment rates well above the regional average. In most SSL areas of the province of Verona and Belluno, however, there were at least 5 unemployed out of every 100 active people: in particular, the minimum values were observed in the SLL areas of Belluno (4.2%) and Malcesine (4,4%).
The highest levels of employment were recorded in the province of Verona: in San Giovanni Ilarione, San Bonifacio, Grezzana, Bovolone and Verona the employment rate of people over 15 years of age exceeds 53%, compared to a regional average of 50.5%; however, good levels are signalled in the area of Castelfranco Veneto. Again, Adria, Venice and Porto Viro present the greatest problems, with employment rates not reaching 47%.
By comparing data from the last few years, the crisis seems to have especially struck Treviso: in the 5 main SLL employment monitoring areas of Treviso, from 2008 to 2009 the employment rates decreased by over 3 per cent, with peaks of around 3.7 % in Treviso and Conegliano. From 2009 to 2010, employment especially diminished in Bassano del Grappa, Schio, Portogruaro and again in Treviso.
With regards to unemployment however, in the year following the crisis a particularly strong increase was recorded in the province of Belluno: the most affected areas were those of Auronzo di Cadore and Feltre, with 2.5 unemployed out of every 100 people active. In 2010, the most sever impact of the crisis was seen in the province of Rovigo: Porto Viro, Badia Polesine and Rovigo recorded the most significant increase in the number of people looking for employment. However, it should be noted that the SLL employment monitoring area which was most affected by the crisis is Conegliano. (Figure 2.6.1)
Support from social welfare
In 2011 in Italy, 973 million hours were paid by the cassa integrazione guadagni (CIG, the redundancy fund), of which 87 million were for Veneto. In Veneto, the CIG a gestione ordinaria (ordinary redundancy fund) accounted for about 23% of authorised hours paid out, whereas a greater part is represented by the CIG a gestione straordinaria (special redundancy fund, 42%) and the CIG in deroga (redundancy fund on derogation, 35%). (Note 7)Compared to 2010, the hours covered by the CIG redundancy fund decreased significantly (-30% in Veneto, -19% in Italy), approaching the percentages of 2009. At a national level, the decline especially weighed on the ordinary redundancy fund, whereas in Veneto the use of the three types of CIG redundancy fund decreased all by the same percentage (-28% CIG on derogation and ordinary, and -33% special CIG). By turning the hours paid out by the redundancy fund into equivalent workers, i.e. by assuming the amount of hours worked per person within the year is 1,650 hours (Note 8), in Italy in 2011 the equivalent workers were almost 590 thousand paid from the GIG fund, of whom less than 53 thousand were in Veneto.
The decrease in use of the CIG funds and relative equivalent workers recorded in 2011 can be read as a twofold interpretive key: on one hand, it can be a positive sign of recovery, on the other it can be a cause of new redundancies following exhaustion of social welfare instrument.
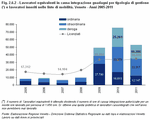
The analysis of the dismissals that have occurred in the last few years comes in support of such a hypothesis. According to the provisions of law 223/1991 (Note 9), the number of people registered on the 'mobility list' (i.e. workers to whom the employer cannot ensure return to work) increased sharply from 2008 to 2009, going from about 6,800 to more than 10 thousand, a value which was also recorded in the following year; 2011 saw a slight increase, leading to a share of 11,800. Individual dismissals (people entered on the mobility list pursuant to Law 236/1993 (Note 10)) had already started to increase towards the end of 2008, but the year of the greatest growth was 2009: workers involved doubled and exceeded 23 thousand units, to then settle in 2010 and 2011 at around 22,700 units. The decrease in the number of hours paid out by the redundancy fund observed in 2011, however, was not accompanied by a substantial increase in dismissals, a sign, perhaps, of a weak recovery in the labour market. (Figure 2.6.2)
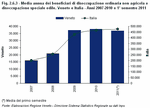
Another means of income support for people who lost their job or whose contract expired, is unemployment benefits. In the first quarter of 2011, in Veneto the average number of beneficiaries of special unemployment benefits for the building construction sector and ordinary unemployment benefits for the non-agricultural sectors was equal to 36,850, i.e. 7.7% of the national total of beneficiaries. Campania (13%), Lombardy (11%) and Sicily (10%) are the regions which allocated the most allowances compared to Veneto. In the first few months of 2011, in the number of unemployment benefits recipient declined in Veneto, reaching values lower than those seen in 2010 and 2009; in Italy, however, the trend is still growing. (Figure 2.6.3)
Redundancy fund, labour mobility scheme and unemployment benefits are the main forms of income support of the Italian welfare system. The government is facing a difficult challenge, i.e., the reform of social welfare; in the first few meetings between the government and social partners, the guidelines were outlined aiming at increasingly extending the coverage of these instruments to a number of workers without burdening general taxation. However, the knot of resources remains a critical problem that clashes with the complex situation of the Italian labour system. The aspects to be analysed are of course numerous, such as, for example, the extension of aids for workers employed under a collaboration agreement, for young people who are looking for a new job, for the long-term unemployed and for those who decide to re-enter the labour market after a long period of inactivity.


