
Chapter 1
The new decade starts with an uncertain economic cycle (Note 1)
The international economy
After the international recession of 2009 and the timid upswing of 2010, at the end of 2011 global economy was slowing down. Despite the many differences induced in the various economies by the persistence of significant discrepancies between the emerging Countries and the advanced economies, 2011 can in general be defined as a year of uncertainty, as it showed clear elements of fragility and was further weakened by the financial crisis.Although the tensions on the financial market have been focused on the trends of the Eurozone, actually the deterioration of the economic framework concerned all the major areas of global economy without distinction, even if with different intensity.
However, returning to the analysis of 2011, the situation deteriorated particularly in the last quarter of the year, when the domestic demand slowed down in most of the advanced economies, without being offset by a positive contribution from net exportation to growth. In this framework, the demand of the emerging Countries, despite their development has become more lively, does not provide a significant contribution to the growth of the advanced economies. This lead to a growth in the global GDP of 3.9% within the year compared to 5.3% of 2012. For the emerging Countries, the increase is 6.2%, for the advanced economies growth has decreased compared to 2010 passing from 3.2% to 1.6%. These trends are in line with that which has been observed since the mid-twenty first century, with a strong and dynamic development of the emerging economies and a general slowdown of the advanced economies. Just two years after the start of the new economic cycle, recovery appears weakened, especially in the Eurozone, whose the contribution to growth of the advanced economies was even negative in the last quarter of 2011%. (Figure 1.1.1), (Figure 1.1.2), (Table 1.1.1).
Japan saw its wealth reduced by -0.9% as early as in 2011, and now is suffering from the effects of the earthquake which interrupted its production cycle. The Country has by now recovered its usual production levels, even if its economic activity has remained relatively weak in recent months.
The economy of the USA continued to grow during 2011, but at a moderate pace. Even in the United States the economic indicators in the second part of 2011 showed deterioration, anticipating moderate growth in the fourth quarter. In any case, considering the general slowdown of global economy, the USA demonstrate good endurance capacity due to the increase in the sales of the big chains, and the decline in the unemployment rate.
As clearly shown by the economist Uri Dadush (Note 2), the United States take advantage of three unique strengths: they remain by far the largest economy on the planet (three times bigger than that of China) and the most competitive, flexible and productive of the G-20; their economy is the most innovative in the world: with only 5% of the global population, the USA boast 28% of patents and 40% of the best universities; according to projections, the work force within the next 20 years is expected to grow by 17%, whereas other Western Countries are expected to remain stagnant. These three strengths put the United States potentially in the best position to seize the huge opportunities offered by the broad trends of the modern world: the rising of emerging markets, globalisation and technological innovation. (Figure 1.1.3)
Europe, the debt and the Euro
The European Union closed the year with a weak growth, equal to +1.5%, i.e. the same recorded for the Eurozone, with a downward overall trend during the course of the year which in the last quarter of 2011 finally lead to record a negative short-term variation equal to -0.3%. The increase in exports has continued to be the main stimulus to output growth; the variation of domestic demand (0.6%) has scarcely recovered the decline suffered in the acute phase of the crisis.In the Eurozone, the strongest growth was seen by the German economy and also by Austria, Finland, Slovakia and Estonia (the latter has grown by 7.7%). The performance of the peripheral economies, on the other hand, is totally different: in addition to the structurally weak trend of Italy and Spain, recession in Greece (-6.9%) and Portugal (-1.6%) is worrisome. (Table 1.1.2), (Figure 1.1.4).
The economic analyses identify (Note 3) four factors as the main elements which have contributed to the slowdown of the European cycle.
First, the initial recovery in 2010 in several Countries was unable to bring back the pre-crisis level of productive capacity utilisation. Specifically, saturation occurred in the property sector due to the quality of property constructed in many Countries during the cycle of the twenty-first century. Consequently, the investments did not contribute to the growth of GDP, contrary to that which commonly happens in traditional cycles, which draw a significant boost from recovery of investments a couple of years after the minimum level was exceeded.
A second aspect is linked to the prices of raw materials: the increases in raw material prices were thus likely to dampen the cycle of global demand from the outset.
In addition, demand for labour was very slow in its recovery. In many economies, businesses have tried to take advantage of the recovery of the cycle to improve their profitability after the collapse occurred in 2008-2009; new recruitment has been kept to a minimum, and in most cases unemployment has benefited only marginally from the effects of the 2010 recovery. Budgetary policies were an essential feature. The public balance sheets have been burdened with heavy losses subsequent to the effects of the 2008-2009 crisis and to the policies implemented to mitigate the intensity of such effects. This has led to the budgetary policy being neutral in several cases, often assuming a restrictive intonation. Linked to this is the last and basic element connected to the fiscal crisis of the Countries which have accumulated major imbalances on the side of public finances, and to the consequences of the default risk of sovereign debt of some Eurozone economies on the performance of financial markets. (Figure 1.1.5)
In particular, the financial situation is marked by the fact that for Greece, Portugal and Ireland, the public debt pays a high risk premium which is not sustainable in the medium term. Only Ireland has recently shown signs of improvement, whereas in the last quarter of 2011, even the spreads in Spain and Italy remained at values which are not sustainable for long.
The financial markets have long underestimated the possibility of insolvency of a Eurozone Country, to the point of excluding it tacitly; they have finally begun to assign excessive probability to the possibility of insolvency, involving Countries the fundamentals of which would have suggested less negative evaluations. The markets, the operators and the analysts are obviously struggling to interpret coherently all the available information, which are at times incomplete or lack transparency; especially during high uncertainty periods, the operators tend to resort to imitative behaviour which feeds the financial contagion.
In journalistic debate, a hypothesis begins to be deemed probable, at a certain level, which initially appeared to be simply an academic exercise, i.e. the hypothesis of the disintegration of the single European currency. The option of Greece to exit from the single currency, at least for a limited period and with a re-entry with a weaker Exchange rate, was discussed. If also Portugal and other peripheral Countries were involved, this would lead to the end of the Euro.
In 2011, the risks of using a single currency without having a single and unified government were clear. The consequences of delays in the transition from a monetary policy to a real budgetary policy and common debt policy in the Eurozone Countries are being dealt with. In particular, the crisis amplified the already known weaknesses: a centralised EU monetary policy which is faced with multiple economic policies; a Stability and Growth Pact which is deficient in terms of public finances and ineffective in the promotion of development policies; a growing financial integration which lacks rules and common supervisory practices.
There is also scepticism about the actual capability of the intergovernmental mechanisms to support Countries in difficulty (European Financial Stability Facility, EFSF) in coping with a deepening of the crisis. The lack of agreement between the authorities and the slowness of the decisional process had a heavy weight, especially on the potential of the EFSF.
During 2011, the Heads of State launched several common measures to restore the full functionality of the markets of sovereign bonds and wholesale bank funding; the intervention capacity of the EFSF was strengthened, with the possibility to lend sureties for the emission of public bonds; a new programme to benefit Greece was adopted; a plan was prepared to provide capital and guarantees to the banks, taking into account the effects of the sovereign debt crisis on their budget. The European Central Bank also intensified its activity in terms of reduction of interest rate, increase of liquidity to the banking system and purchase of government bonds on the secondary market. The measure for expansion of liquidity, directed to the banks, could also have effects on the possibility for the National Banks to support the public debt.
The lesson to be drawn from this crisis, especially regarding the monetary policy, is that the reaction of the EU should be immediate and of equal size to the problem, and the EU should be always ready to make flexible use of those tools which result to be the most adapted to the emergency situation.
The 'global governance' (Note 4), together with the identification of the surveillance and structuring of reforms by Countries in the most difficulty seems to have been received with favour by the markets in the first few months of 2012. (Figure 1.1.6), (Figure 1.1.7).
The net debt for the European Union (Note 5), which was equal to 0.9 percentage points of GDP in 2007 and worsened to 6.9% in 2009, at the end of 2011 reached the value of 4.5%, an improvement with respect to the value of 6.5% in 2010. The public debt (Note 6), which in 2007 represented 59% of the GDP, for the EU27 came to reach 74.8 percentage points of GDP in 2009, and in 2011 it reached 82.5%, i.e. a value worse than the one recorded in 2010 (80%). The net debt and the public debt calculated as a percentage of the GDP are the two reference indicators for the evaluation of public finances, the first in particular for budgetary management and the second for public finance management.
In 2011, most European economies also adopted individual tax adjustment measures aimed at reducing deficits. As a result of such policies, the average public deficit of Eurozone Countries is expected to decrease to below 3 per cent of the GDP this year, and below 2 per cent next year. Based on the OECD estimates, in four years - between 2010 and 2013 - the Eurozone shall achieve a fiscal correction to the order of 5 GDP points. According to the International Monetary Fund (IMF), in the next two years the ratio between public debt and Gross Domestic Product should continue to increase in all major Countries, with the exception of Germany and Italy. In Italy, the ratio should begin to reduce in 2013, due to the strong contraction of the deficit programmed for the next two years. In Italy, the resources needed in 2012 to finance the expiring debt and the new deficit should amount to 23.5% GDP, a value lower than that of the United States (30.4%) and Japan (58.6%) and just a little higher than that of France and Spain.
Traditional indicators of the sustainability of public debt also indicate a relatively strong position for Italy. Italy is generally meeting the commitments undertaken on this matter with the European Commission: from 2012 to 2011 the public debt/GDP ratio moved from a value of 118.1 to 120.1, but the net debt/GDP ratio improved from a value of 4.6% to 3.9%.
The European Commission estimates that the improvement in the primary surplus needed to stabilise the debt/GDP ratio would be equal to 2.3 percentage points of GDP for Italy, against 6.4% for the total Eurozone and 9.6% for the United Kingdom. A similar indicator calculated by the IMF confirms Italy's favourable position even compared to the United States and Japan. The result of Italy benefits from the reforms in the public pension system introduced at the beginning of the Nineties, which significantly reduced age-related expenses (which, compared to today, in total would increase by 1.5 percentage points of GDP, compared to 3.4 for the whole Eurozone). Similar indications emerge from another indicator recently developed by the Commission in order to take into account any additional information about the vulnerability of a Country to macroeconomic risks. (Table 1.1.3)
In the opinion of the investors, Italy suffers from the high public debt and especially from low growth; however, Italy presents elements of strength such as the content level of the budgetary deficit compared to other major economies, the low debt of the private sector, the solidity of the banks and the limited foreign debt.
Raw materials and Exchange rates
The prices of raw materials began to fall during 2011 in line with the slowing of global economic activity. In most cases, however, quotations remain high, in a historical perspective. Therefore, the extensive correction which could have been expected following the worsening of the financial crisis and the increased uncertainty about growth prospective has not occurred. In 2011, a process of downsizing the quotations of oil, metal and food raw materials began, but a reduction able to compensate the increase recorded in 2008 did not occur; overall, the year ended with an increase in the raw material cost budget compared to the previous year: oil, whose quotations in dollars indicate an increase of almost 40% compared to 2010, metals (almost 20%), agricultural raw materials (50%), and food raw materials (30%). Furthermore, for other Eurozone Countries, the year end framework was impacted by the weakening of the Euro, which to some extent thwarted the benefit deriving from the moderate correction of prices of imported raw materials. Oil, if valued in euros, was destined to close 2011 with an increase a little over 30%.
Given the sharp revision of growth expectations, one would therefore expect to have a rather sharp decline in prices. This, however, up until today has not occurred, for different reasons.
In the case of metals, for a few months problems prevailed related to stock reduction which occurred in 2010, and this would lead to a relative difficulty of the offer to accommodate higher levels of demand. Regarding oil markets, correction of prices did not occur due to the fact that the downward revision of the levels of demand associated to minor global growth was partially offset by reductions in supply caused by the decline in Libyan production. Furthermore, the market is affected by pressures associated to the uncertainty about the medium term trends of the difficult geopolitical situation of North African Countries. (Figure 1.1.8)
The strong turmoil about bonds led, in 2011, to a decline in the Euro against the dollar. For 2012, many are the factors in play: to the variations of the current expected interest rates, which also depend on monetary policy decisions, they have to be added the effects of the financial flow linked to deleveraging - reduction of debts - of the European banks on one hand and American banks on the other, which tend to repatriate the financial resources invested abroad. The belief still remains that a strong Euro is the thing the Europe in recession needs less.
Italy and Monti reforms
The tensions in the International finance markets remain high, but it seems that there is confidence in the reforms that Italy is embarking upon. In the first half of 2011, the spread between the yield on 10 year-BTPs and the yield of comparable German bonds almost always remained below 200 points, whereas in the last few months of 2011 it reached 550 basis points, and in February 2012 stood at 370 points. (Figure 1.1.9)The attention of the markets is focused on the ability of Italy to pursue with determination the consolidation of public finances and at the same time to stimulate the economy's growth potential by means of structural reforms.
Italy is today engaged in a particularly intense effort: the Government predicts that in the next three years the debt/GDP ratio will decrease significantly. When added to the interventions of July and August 2011, the objectives of the DEF 2012 (Note 7), which summarise the operation approved by the Parliament on 22nd December, should lead to a primary budget surplus next year equal to 3.6% of GDP; if the consolidation targets were met, according to the Banca d'Italia (Bank of Italy), the debt/GDP ratio could reduce or stabilise even in the event that the yield of government bonds was to record significant increases. To reduce permanently the sovereign risk however, measures to raise the growth potential are required, which in this stage are closely linked to financial stability. The commitments undertaken at the EU level for an effective reform should be implemented rapidly. The road has been undertaken with clarity and the international public opinion recognises it: in recent months in Italy the economic policy has progressed in the direction of financial sustainability which would have been unimaginable before, for example in terms of the pension system. Progress just as brave are expected on other (decisive) front to which the government has already committed itself: efficiency of the tax system and fight against tax evasion; systematic review of all the items of public expenditure to search for redundancies and savings; rationalization of laws, institutions and practices which harness the energies of the Country, compress the competitiveness of the businesses and stifle the expectations of young people.
Italy suffers from low productivity compared to the European competitors, and some measures in favour of the businesses should be taken to recover productivity, in particular the following: relief from IRAP, the regional tax on productive activities; refinancing of the Guarantee Fund for Small and Medium Enterprises; and adoption of the ACE model, the so-called 'aid to economic growth', which aims at promoting investment in corporate capital by means of tax relief measures. Furthermore, more specific deductions are provided in case of the recruitment of women and young people, for a value of about a billion euros.
Still on the front of recovery of economic growth, the government is working in particular on the competition, on the job market and social safety networks, on the education system and on the role, size and function of governmental presence in economy. The Government predicts that the interventions for increasing competition shall lead to an increase of 1.2% points of GDP. Due to their effects, which promote greater social equity and are not only economic, particularly interesting are the liberalisation measures adopted in different sectors and professions. (Figure 1.1.10)
In fact, many indicators show that the degree of competition in services (which represent 73% of the entire national economy and about 65% of that of Veneto) is still low compared to international levels.
According to some studies carried out in the services sector by the OECD (Note 8) and the European Central Bank (Note 9) the profit margins in Italy were, at least until the middle of the last decade, higher than 60%, whereas in the rest of the Eurozone they were equal to 35%. These same margins, in the manufacturing sector, where competition has been global for some time, appear for Italy aligned to those of the Eurozone, on a level lower than 20%.
According to another OECD analysis (Note 10), for example, if at the beginning of the past decade Italy had aligned its regulations on services to the regulations of more virtuous Countries, it would today have a level of productivity 10 points higher than the level actually observed.
Italian Economy
In 2011 in Italy GDP increased by 0.5% as the result of a recovery which occurred in the first part of the year but then reduced until recording negative variations. In 2010, the increase was more consistent, equal to 1.8%: a sharp recovery compared to the decline of 5.5% which occurred in 2009. Despite the growth of the last two years, in 2011 the GDP volume stood at levels lower still than the levels recorded in the years previous to the 2008-2009 economic crisis.
In terms of investments, stagnation occurred in domestic final consumption as well as a decline in gross fixed capital formation equal to 1.2%. In 2011, expenditure for final consumption of the resident households showed an increase in volume equal to 0.2%, with variations smaller than the ones recorded in 2010 (+1.2%). Consumptions were generated above all by expenditure for service charges (+1.5%), whereas the consumption of goods decreased to 0.8%; the decline in spending on food was particularly significant in terms of annual average.
In 2011, gross fixed capital formation recorded a decline in volume equal to -1.2%, after the recovery which characterised 2010 (+1.7%). The reduction was particularly relevant for the investments in construction activities (-2.3%), and in machinery and equipment (0.3%); whereas growth was recorded in the investments in transport: +1.8%.
A significant positive contribution to the variation of GDP came from net foreign demand, whereas the contribution of the domestic demand and the variations of stock were negative.
With reference to the productive sectors, the added value of the industry recorded a decrease in the building construction sector (3.1%), and an increase in industry in the strict sense (+1.7%). The services sector registered a growth of 0.8%, compared to a negative variation of half a percentage point for agriculture, forestry and fishery. (Figure 1.1.11)
Unlike that which has happened during the 2008-09 recession, which originated overseas and mainly affected export businesses and therefore the investments and only reflected in household consumption, this new phase of the crisis has families at its core, because it reduces the value of their wealth and make their prospects uncertain. A recent study (Note 11) summarises all the operations approved during 2011 for the three year period 2012-14: 48.5 billion euros (3 percentage points of GDP) on the current year, to which another 27 billion shall be added in 2013 and 5.5 in 2014 for a total of 81.2 billion euros. It is estimated that this operation will mainly weigh on households, and therefore it will primarily affect their consumption, for an overall contraction presumably of 1.2% of GDP. Moreover, erosion of purchasing power will occur due to the increase in indirect taxes on prices, whereas from the foreign side, the scenario of lower global growth combines with a mild depreciation of the Euro, so that altogether the effects on domestic growth will be modest (Figure 1.1.12)
Industrial activity
During 2011, industrial activity was rather flat, in 2010 increases were compressed and the pre-crisis values of 2008 were not recovered: the industrial production index did not evolve compared to the previous year, stopping at the average annual value of 88.4 (101.7 in 2008, 105.4 in 2007). Industrial production had a differentiated evolution depending on the type of goods: for consumer goods a contraction of 2.9% is recorded, in particular non-durable consumer goods (-3.1%), whereas the producers of capital goods showed a recovery equal to +3.2%.The trend of the turnover index is not uniform, as it is growing: within the year it grew 5.6% compared to 2010, reaching a value of 113.1 in December 2011, therefore recovering and exceeding the values of 2010 but not those of 2008. The turnover was sustained by foreign demand more than by domestic demand, which in the last quarter diminished. The variation of the orders index in 2011 was equal to +5.9%, a value which is supported mainly by foreign orders, which suffered setbacks in the last quarter (Figure 1.1.13)
The Credit Crunch
The volumes produced by the industry started dropping down in the third quarter of 2011, along with the investments, which in the final months of 2011 were declining. Uncertainty about credit particularly weighs on the prospects for business investment. The Banca d'Italia reports that the financial needs of businesses, despite low investment requirements, are increasing. However, in the face of a demand that remains strong, a deceleration is observed however, in the offer of credit to businesses. At the end of 2011, the nationwide growth of loans to the non-financial private sector, compared to the previous year reached an average value of 5.6%. Adjusting it by including overdues and repurchase agreements, the growth of loans is found to be low and decreasing compared to the summer. In particular, growth is zero for small enterprises due to the difficulties in accessing credit; the same enterprises, included in the survey conducted by ISTAT (Italian National Institute of Statistics) on the manufacturing businesses, among the obstacles to production report the increase in the weight of financial constraints. The number of businesses which state a worsening of credit access conditions increased. For their part, in the third quarter the banks indicated a tightening of the criteria used for the awarding of loans to business; such tightening applies in particular to long term loans and leads to an increase in the margins of the bank, to restrictions on the amount of the credit, on due dates and, in particular, on the clauses. According to the banks interviewed in the Bank Lending Survey (BLS) (Note 12), credit offer restrictions are mainly due to constraints connected to the ability of the bank to finance itself on the market. Since some months the banks, in fact, are experiencing considerable tensions on their budgets, as they have to deal not only with the issue of recovering outstanding payments ( probably destined to increase in the current framework of economic deterioration), but also with a notable increase of the cost of bank funding. The yield levels of long term government bonds remains high and such situation is leading to a rise in the cost of funding by banks; as a consequence, negative effects arise, and are in part already visible, on credit offers (Figure 1.1.14)The level of trust in Italy
The level of trust of manufacturing businesses deteriorated rapidly during the year: at the beginning of 2011 the levels of the beginning of the twenty-first century were recovered, but in the following months confidence dropped down, due to the effect of the cycle deceleration and upheavals. Although the situation for the industry does not appear as dramatic as it was three years ago, there are still elements of concern for the future. The opinions on the orders to manufacturing businesses have decreased, especially regarding domestic orders and starting from autumn. The weakness of domestic demand is also reflected in the service sector, which was traditionally more orientated to the domestic market: the climate of trust in services returned to the levels of December 2008, and trade is particularly affected by this situation, so that pessimism reached a level greater than that recorded in 2009, during the acute phases of the crisis (Figure 1.1.15).Even the opinion of the families was gradually depressed during the year. Among the factors which contributed to this result are objective elements linked to the prospects of economic progress and to the subsequent fiscal policies. The impact information from the financial markets on the trust level also has a certain weight. At the end of 2011, the few signs of improvement in the performance of the risk premium paid by the yield of public bonds, in addition to the decline for the fourth consecutive year of the disposable income, transmitted a feeling of concern to the families. (Figure 1.1.16)
The economy of Veneto
The official data of regional accounting stop at the year 2009, therefore for the purposes of the following analysis the estimates and predictions made by the research institute Prometeia will be used.In the national framework of uncertainty, in 2011 Veneto saw its GDP grow by 0.6 percentage points. The domestic demand was weak, supported mostly by household consumption (+0.6%), whereas investments decreased (-1.1%).
The increase in GDP, although small, was higher than the national one, due to the strongly export-led productive structure of this region, which supported production. In fact, the result of 2011 was mainly determined by the increase recorded by the manufacturing industry in the strict sense, the added value of which grew by 1.4 percentage points. The service sector recorded a growth of 0.9, agriculture remained stable, and the construction sector is estimated to be still in decline (-2.5%).
According to the forecasts, in 2012 the effects of recession will be similar to those of 2011 for the whole nation, and perhaps will be slightly less heavy due to significance of the businesses of Veneto. Recovery is expected to start in 2013 and it should lead to a growth of around 2% in 2014. (Table 1.1.4), (Figure 1.1.17), (Figure 1.1.18), (Figure 1.1.19).
Despite the economic difficulties, Veneto remains the third region in Italy for wealth production, after Lombardy and Lazio: 9.3% of the Gross Domestic Product is made in Veneto. The GDP per inhabitant in 2011 in Veneto was 30,148 Euro, 16% higher than the national one. Ultimately, the job market is also good, with an employment rate which is increasing and an unemployment rate of 5.0%, lower than during the acute phase of the crisis and among the lowest in Italy.
Consumption and disposable income
The current recession is mainly due to the trends of domestic demand and consumption in particular. The deterioration of operator's level of trust, the climate of high uncertainty, the tensions on the financial and credit markets and the first adjustment measures of public finances influence the behaviour of consumers, leading to a postponement or downsizing of spending plans. The effects are made clear by household behaviour: real spending of families was in decline in the last two quarters of 2011, and is predicted to continue to fall until the middle of 2013. Within this trend, food consumption is significant, the negative performance of which has lasted for ten quarters in the two-year period of 2008-2009 and is expected to continue for as many quarters in the 2011-13 period. (Figure 1.1.20)In the face of these changes in consumption levels, real disposable income drops down to the levels of 20 years ago. The households are therefore particularly struck by the crisis, but in addition to the problems linked to the labour market and the financial markets, the tax measures which are being implemented will weigh heavily on the reduction of disposable income. Some measures, such as raising the personal income tax IRPEF, the direct and indirect taxation on financial assets, the operation of indexation of pensions and increased taxation of the home, will drop 74% of their burden on families.
For 2011, it was estimated that household consumption in Veneto would remain stable (+0.6%) compared to the National stagnation (+0,2 %), whereas for 2012 a reduction equal to 2.4% is predicted, in line with the national of 2.5%. 2012 will also see a contraction of disposable income per capita of the households of Veneto. (Figure 1.1.21)
The wealth of the households of Veneto (Note 13)
Faced with the reduction of disposable income, over time accumulated wealth may be helpful to the households. An analysis conducted by Banca d'Italia estimates the wealth of Veneto households in the period from 2002 to 2010 and shows how the resources of the households have been affected by the economic downturn.The wealth considered here is the total of tangible or intangible assets having market value available to the household. This is the result of the sum of real assets (equal to the value of housing, land, and producer households' stock capital) and financial assets (value of deposits, securities, shares, etc.), which are part of the household's gross wealth, less financial liabilities (mortgage loans, personal loans) (Note 14) (Table 1.1.5).
Based on preliminary elaborations, it was estimated that up to 2010 in Veneto the net wealth of consumer and producer households, in per capita terms, would amount to a little less than 148 thousand euros per capita, i.e. to a value that is higher by 6.3% than the national average but is in decline compared to the values of pre-crisis year 2007. (Figure 1.1.22)
Between the end of 2002 and the end of 2007, the net wealth per capita of families increased by 9.8% net of inflation (1.9 on average per year) especially due to an increase in real assets. The crisis causes the fall of financial assets to be reflected in the aggregate total: between the end of 2007 and the end of 2010, real wealth did in fact decrease by 8.5%. The positive difference compared to the rest of the Country, which in 2002 was equal to 11%, in 2010 was reduced to 3.6%.
An analysis of nominal wealth shows that in 2010 real assets represented almost 70% of net wealth per capita (62% in 2002), and amounted to 103.2 thousand euros (97.7 thousand in Italy). In the five year period of 2002-2007 it grew to an average annual rate higher than the of inflation rate (4.8%), whereas in the subsequent three years its growth slowed down to an average annual rate of 1.0%. This trend is mainly due to the value of housing which in 2010 was equal to 82.2 thousand euros per capita (in Italy 81.8 thousand). The value of family housing grew on average by 4.2% per annum in the period from 2002 to 2010, mainly as a result of the trend in house prices. The latter, according to data from OMI increased in Veneto by an average annual rate of 5.5% between 2002 and 2007 and subsequently stopped with the arrival of the crisis. Since 2007 the cost of housing has in fact slowed down (1.3% on average per year).
The financial assets, which in the 2002-2007 period went from 58 to almost 69 thousand euros per capita, with an average annual growth of 3.4%, by the end of 2010 dropped to 61 thousand euros, with an annual average drop of 3.9% in the three-year period 2008-2010.
In 2010 financial liabilities of families were equal to 16.7 thousand euros per capita (14.6 thousand in Italy). Compared to 2002, when their value was around 10 thousand euros, financial liabilities grew at an average annual rate of 6.5%. Household debt, encouraged by low interest rates, increased on average by 10.1% per year in the five year period from 2002 to 2007 to then abruptly slow down in the subsequent three years (3.3% per year). (Figure 1.1.23)
Prices in Veneto
In 2011 in Italy inflation rose by 2.8%, signalling the recovery of this variable after a quite contained 2010 (1.5%) and a 2009 in which the consumer price index was the lowest of the last 50 years. The year-end showed a higher growth rate, driven by the increase of standard VAT by a percentage point introduced by a decree in mid September, within the framework of various measures aimed at stabilising and consolidating public finances. To the increase in VAT and of other indirect taxations, such as the excise duties on fuel, they should be added the consequences of higher raw material prices, which remained at level that were still very high considering the deterioration observed in the international economic cycle. To sustain the growth of prices, also public fares and administrative prices contribute to a great extent.The average inflation recorded in Veneto was equal to 2.5%, slightly lower to the national average; provincial capitals which stood out because of their lower inflation rate were Belluno, Rovigo and Verona (Note 15).
With reference to expenditure items, Veneto shows a progress similar to the national one: the most relevant contributions to average growth during the last year were transport (6.3%) and housing, water, electric power and fuel (+5.5%).
Figure 1.1.1

Figure 1.1.2
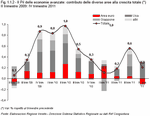
Table 1.1.1

Figure 1.1.3

Table 1.1.2

Figure 1.1.4
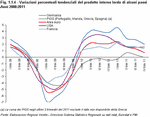
Figure 1.1.5
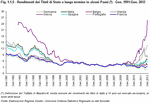
Figure 1.1.6

Figure 1.1.7
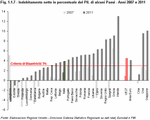
Table 1.1.3

Figure 1.1.8

Figure 1.1.9

Figure 1.1.10
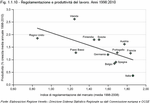
Figure 1.1.11

Figure 1.1.12

Figure 1.1.13

Figure 1.1.14
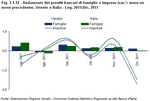
Figure 1.1.15

Figure 1.1.16

Table 1.1.4

Figure 1.1.17

Figure 1.1.18

Figure 1.1.19

Figure 1.1.20
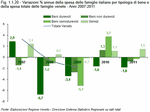
Figure 1.1.21
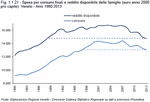
Table 1.1.5

Figure 1.1.22
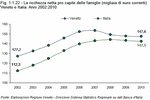
Figure 1.1.23


