Chapter 6
Equal opportunities
Equality means first of all understanding exactly which are the aspects that need to be made equal, taking into account that human beings are fundamentally different in their personal characteristics, experiences and preferences. Sociology distinguishes 'equality' from 'equal', i.e. social inequality from social difference: the term 'difference' captures the unavoidable subjective aspects and forms a rich background to human relationships and aggregates, whereas the term 'inequality' denotes a rather unfair imbalance in the distribution of privileges, resources and remuneration, undermining the potential of an individual in the community. Establishing which is the best and less imbalanced way to distribute resources and remuneration, in spite of subjective and human diversity, has always been at the centre of political and philosophical debate. This debate is constantly renewed and has continued up to the present day, influencing the measurement of social inequality. The economist Amartya Sen, Nobel Prize for economy in 1998, for example, analysed how human diversity is the key factor allowing equality within one sphere to co-exists with substantial inequality in other spheres. Take a healthy person and an ill person, a free individual and someone subjected to restrictions of freedom: while they enjoy equal incomes, they do not have the same opportunity for personal development nor the same opportunity to do what they believe is important. Therefore, to be able to talk about equality and measure social impact, Sen invites to ask the question 'equality of what?'
In general, where adequate social opportunities are present, individuals can both shape their own destiny and help the collective; this is why, for Sen, equality relates to 'capabilities' and 'functioning'. Functioning are the 'states of being and doing' which are chosen by the individual to feel good; they essentially are the type of person that we are or who we want to be: for example, being adequately fed, in good health, to have a good education and suitable work, to live in a peaceful community, to be happy and to respect oneself. Capabilities to do and to be, freedom to be able to choose one functioning over another, i.e. freedom to choose between a series of possible lives: 'to the extent that functioning constitutes well-being and capabilities represent individual freedom to achieve well-being (Note 1)'.
The degree of equality of a particular society in a certain moment of history, therefore, depends on the ability and suitability of that society to ensure everyone a series of 'capabilities' to pursue the goals and objectives that the individual wants to achieve, namely an adequate quality of life. The essential is ensuring that everyone is given the possibility to obtain complete personal realisation; this means ensuring equality of opportunities.
If inequality of income is not necessarily a negative factor when it is justified by merit, then poverty, which is the unacceptable reflection of an unequal distribution of wealth, is undoubtedly an important limitation to equal opportunities. Access to higher levels of studies, proper and timely care, having a comfortable home, to be able to participate in a rich and fulfilling social life, and also to feel able to cope with simple daily needs are preconditions for social inclusion which the poor are often lacking. Poverty, therefore, is seen as deprivation in terms of capabilities.
In a time of crisis like that which we are currently experiencing, poverty and inequality represent growing concerns for citizens, even among the most advanced Countries. According to the Eurobarometer survey conducted in 2011 (Note 2), in the midst of the recession that swept through the whole of Europe, the majority of citizens believed poverty to be a widespread and growing phenomenon. In Italy, as in many Countries, the common perception is that poverty now concerns more than 20% of the entire population and within the last 12 months has significantly increased. In particular, compared to the previous year, 81% of people (EU27 63%) perceived an increase in poverty in the area where they are living, 89% (80% in the EU27) perceived such increase as involving the whole Country, and 65% (UE27 67%) perceived it as regarding the whole European area.
Italians, together with Greeks, the French, Portuguese and the Spanish, showed to be particularly concerned about the advance of poverty, also because they were influenced by the critical situation experienced by their Countries in 2011. In Italy, more than elsewhere, apprehension has grown compared to previous years.
Being poor is believed to lead to a series of very important sacrifices and limitations. It significantly reduces the opportunities of having satisfactory housing (according to 88% of Italians and 86% in the EU27), to conduct a business by themselves (Italy 90%, EU27 85%), to access high levels of education (Italy 87%, EU27 80%) and also good basic school education (Italy 78%, EU27 60%); it can also limit the possibilities of receiving adequate medical care when needed (Italy 73%, EU27 61%), to use the most fundamental banking services (Italy 83%, EU27 64%), to maintain relationships and to take part in social networks and relations of friendship (Italy 68%, EU27 55%).
Why does poverty exist? What are the causes? The answers to these questions differ in an interesting way in the different European Countries, also due to essential differences in culture and orientations. In some Countries, for example in Northern Europe, where particular attention is paid to ensure everyone has good living conditions, poverty is perceived as the result of social injustice and as such is a problem which should be borne by the whole of society, in the belief that improvement in the conditions of the poor also implies a better quality of life for the collective. In other Countries, however, poverty is still considered a problem of the individual and the poor are often left alone with the very difficult task of recovering themselves.
In Italy, the majority think poverty is a social injustice (45%), but there are also those who attribute it to the lack of commitment, willingness and initiative of the individual (9%), as well as to bad luck (21%), and for 15% poverty is an inevitable consequence of progress. However, 88% of Italians (EU 89%) believe that poverty is a serious problem which requires urgent action by the government; but there are also those who believe that poverty cannot be combated and that it will always exist, as well as those who think it will disappear following economic growth (Italy 49%, EU27 34%). Among the former are those who think that the government should ensure a better redistribution of wealth between citizens to bridge the disparities, which are still considered excessive (Italy 87%, EU27 85%); and that perhaps redistribution could be achieved by asking those who can afford it to pay more taxes (Italy 78%, EU27 79%) (Note 3).
If poverty affects a minimum part of the collective, the discomfort generated by inequality involves everyone, not just the most disadvantaged, but also those who are at the top of the social ladder. Inequality conditions the social, economic and political balance of a Country: it stifles social mobility and limits growth opportunities of the deserving, affecting the economic performance and development of the whole society.
Various studies also show that in rich Countries and in Countries with a lower inequality of income, the population enjoys greater levels of physical and psychological well-being and that a decrease in income downsizes many health and social problems, such as obesity, mental health and crime. It is therefore in the general interest to contract the social gap and point towards a new concept of development that puts the focus on quality of life as a whole.
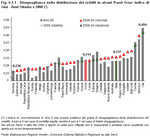
The Gini index, a measure of dispersion of income varying from 0 to 1, where 0 indicates a condition of perfect equality and 1 the maximum inequality, in 2008 assumed a value of 0.314 in the OECD area, as a summary of very different situations. Only in Slovenia, Denmark and Norway its value remains below 0.25, whereas in Chile, Mexico, Turkey, the United States, Israel, Portugal and the United Kingdom it highlights notable disparity. Italy, with a value of 0.337, is in the second half of the ranking, near to the most unequal Countries, confirming levels of inequality higher than the OECD average and almost all European Countries. (Figure 6.1.1)
In the last thirty years, from 1980 to 2008, before the recent global economic crisis, a generalised increase of the level of inequality occurred, both in the Countries which have always been characterised by strong disparity, and in those usually having a greater level of equality, such as Germany and Countries of Northern Europe. The disparity decreased significantly (with the lowest Gini index of at least 5%) only in Ireland, Germany, Greece, Estonia, Spain, Turkey and Chile, and remained fairly stable is Slovenia, Slovakia, Belgium, Hungary, France and Poland. In Italy, the trend first grew and then started a slight decrease: the Gini index increased between the Eighties and the first half of the Nineties, going from 0.309 to 0.348, to then stabilise and reduce slightly in the following fifteen years, without however offsetting the increase of the first period.
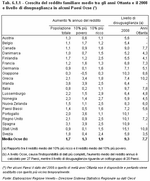
The inequality worsened particularly because wealthy families benefited from especially high incomes which grew to a greater extent than those of families with medium-low incomes. In fact, in the OECD area, the overall family income increased on average by 1.7% per annum, but the increase was greater for the richest (+1.9%) and less pronounced for the poorest (+1.3%). This distance is even greater in many Countries, including those in Northern Europe, usually more equalitarian. In Italy, over the past 30 years, the income of the poorest 10% of the population has remained fairly constant (+0.2% a year), whereas the corresponding richest 10% increased their income by 1.1% per annum; for this reason, in 2008, the richest segment of the population concentrated an average income almost ten times higher than that of the poorest 10%, indicating an increase in inequality compared to the ratio of 8 to 1 in the mid-Eighties. (Table 6.1.1)
In the survey on the possible causes of increased inequality, the OECD took into consideration both factors influencing the labour market, such as globalisation, technical progress, changes in the employment structure, policies and regulatory reforms, and demographic and social factors which have significantly modified the family structure.
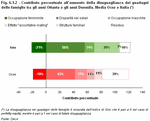
If globalisation has been a driving force of structural reforms that extended the employment basis including low salary categories, such as young people, women and foreigners, the technological progress has resulted in an increase of the demand of more skilled workers; in both cases the effect on inequality has been to broaden the wage gap and therefore induce a greater disparity. It is estimated that such disparities in wages have accounted for 56% of the total increase in inequality which was recorded between 1987 and 2004, when in Italy the Gini index went from 0.325 to 0.363, whereas the growth in female employment had a deflating effect of 21%. The general aging of the population and the fragmentation of households in more and more reduced units unable to exploit the scale economy of large families, are factors which are estimated to have contributed on average in OECD Countries by 11% to the total increase of inequality, whereas in Italy they were negligible. Not so for the phenomenon of 'assortative mating', i.e. the tendency to marry people of the same social status, to combine privileges and transmit them to one's children. This reduced social mobility is inevitably reflected in the economic disparities between families and in Italy would explain 35% of the increase in the inequality of incomes (11% on average in OECD Countries). (Figure 6.1.2)
In the event of perfect equidistribution of income, in general it is assumed that 20% of the poorest families would accumulate 20% of the overall income, the second 20% would earn another 20% of the income and so on; in essence every 'fifth' of the population should have a fifth of the overall income (Note 6).
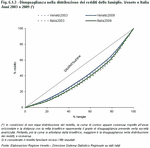
By showing the fifths calculated and the real population in a graph, the effective situation can be displayed as a curve, typically 'the Lorenz curve', and compared with the ideal situation of equidistribution, which is represented as a bisector line, and then measuring the degree of deviation between the line and the curve: the further the curve is away from the bisector, the greater the inequality in income distribution is, and vice versa.
In this way it can be seen that in Italy in 2009, the first fifth of the population, i.e. the poorest 20%, held 8% of the total income and the richest 20% had 37% of the overall income. In Veneto, the inequality is a little less pronounced and, like at the national level, has slightly improved over time: the first fifth held 10% of the total income (9.4% in 2003), the second fifth 15%, the third 18%, the fourth 23% and the last, namely the richest 20%, concentrated 34% of the total income (36.2% in 2003). More succinctly, in the period considered, the Gini index for Veneto went from 0.26 to 0.24, keeping below the national value (from 0.31 to 0.29) which was particularly affected by the high levels of inequalities in the Southern regions. It should be noted however, that due to the lack of available data, the analysis excludes any possible impact from the current crisis. (Figure 6.1.3)
By examining the composition of the fifths of income more closely and considering some characteristics of the households, the types of families which are in more difficulty than others can be identified.
Compared to the national distribution of income (Note 7), in Veneto only 10.4% of the households fall into the lowest fifth, with an equivalent household income lower than 12,589 euros per year, whereas almost 50% is concentrated in the medium and medium to high ranges, i.e. with incomes between 17,275 and 28,670 euros.
Comparison of these percentages, referring to the total number of households in Veneto, shows that the people who live alone and those living in families with a large number of members present the most imbalanced distribution and concentrate to a greater extent than others in the lowest income fifth. It is in fact the families made up of just two members which are most found in the richest fifth (7 per cent more than average).
The presence of minors in households contributes to an unequal distribution in the lowest income fifths: among the families with two or more minors, only 7% are in the maximum income range, whereas among those without dependent children the percentage rises to 23.2% and goes up to 50% if we also consider the medium-high income range (4th fifth, over 21,958 Euro of equivalent family income a year).
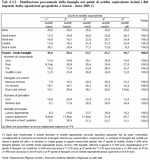
The number of income earners in the household is also an important factor in sorting the households: households with only one earner are strongly unbalanced (about 19% of these households are in the first income fifth, almost double the regional average of 10.4%), whereas households with at least two earners are concentrated for more than 24% of cases in the last income fifth, i.e. double the number of single earner families. But it is especially the source of income, if it is self-employment, subordinate employment or pension for example, which determines the major differences. The distribution of households in which the income derives from subordinate employment is more uniform, given the minor variability in wages, whereas self-employment ensures better economic conditions, so much that almost half of these households fall into the highest income fifth. Those who receive a pension or other public transfers are in the central income range, mostly medium to low. (Table 6.1.2)
Various studies also show that in rich Countries and in Countries with a lower inequality of income, the population enjoys greater levels of physical and psychological well-being and that a decrease in income downsizes many health and social problems, such as obesity, mental health and crime. It is therefore in the general interest to contract the social gap and point towards a new concept of development that puts the focus on quality of life as a whole.
The International picture ...
Alongside the extraordinary processes of economic development which have involved industrialised Countries in the last century and, in recent years, even the developing Countries, there are still unacceptable inequalities. A recent study by OECD (Note 4) offers a comparative analysis between 34 Countries on the evolution of inequality of household incomes in the last 30 years, on the possible determinants and on the most effective policies to combat inequality. The Gini index, a measure of dispersion of income varying from 0 to 1, where 0 indicates a condition of perfect equality and 1 the maximum inequality, in 2008 assumed a value of 0.314 in the OECD area, as a summary of very different situations. Only in Slovenia, Denmark and Norway its value remains below 0.25, whereas in Chile, Mexico, Turkey, the United States, Israel, Portugal and the United Kingdom it highlights notable disparity. Italy, with a value of 0.337, is in the second half of the ranking, near to the most unequal Countries, confirming levels of inequality higher than the OECD average and almost all European Countries. (Figure 6.1.1)
In the last thirty years, from 1980 to 2008, before the recent global economic crisis, a generalised increase of the level of inequality occurred, both in the Countries which have always been characterised by strong disparity, and in those usually having a greater level of equality, such as Germany and Countries of Northern Europe. The disparity decreased significantly (with the lowest Gini index of at least 5%) only in Ireland, Germany, Greece, Estonia, Spain, Turkey and Chile, and remained fairly stable is Slovenia, Slovakia, Belgium, Hungary, France and Poland. In Italy, the trend first grew and then started a slight decrease: the Gini index increased between the Eighties and the first half of the Nineties, going from 0.309 to 0.348, to then stabilise and reduce slightly in the following fifteen years, without however offsetting the increase of the first period.
The inequality worsened particularly because wealthy families benefited from especially high incomes which grew to a greater extent than those of families with medium-low incomes. In fact, in the OECD area, the overall family income increased on average by 1.7% per annum, but the increase was greater for the richest (+1.9%) and less pronounced for the poorest (+1.3%). This distance is even greater in many Countries, including those in Northern Europe, usually more equalitarian. In Italy, over the past 30 years, the income of the poorest 10% of the population has remained fairly constant (+0.2% a year), whereas the corresponding richest 10% increased their income by 1.1% per annum; for this reason, in 2008, the richest segment of the population concentrated an average income almost ten times higher than that of the poorest 10%, indicating an increase in inequality compared to the ratio of 8 to 1 in the mid-Eighties. (Table 6.1.1)
In the survey on the possible causes of increased inequality, the OECD took into consideration both factors influencing the labour market, such as globalisation, technical progress, changes in the employment structure, policies and regulatory reforms, and demographic and social factors which have significantly modified the family structure.
If globalisation has been a driving force of structural reforms that extended the employment basis including low salary categories, such as young people, women and foreigners, the technological progress has resulted in an increase of the demand of more skilled workers; in both cases the effect on inequality has been to broaden the wage gap and therefore induce a greater disparity. It is estimated that such disparities in wages have accounted for 56% of the total increase in inequality which was recorded between 1987 and 2004, when in Italy the Gini index went from 0.325 to 0.363, whereas the growth in female employment had a deflating effect of 21%. The general aging of the population and the fragmentation of households in more and more reduced units unable to exploit the scale economy of large families, are factors which are estimated to have contributed on average in OECD Countries by 11% to the total increase of inequality, whereas in Italy they were negligible. Not so for the phenomenon of 'assortative mating', i.e. the tendency to marry people of the same social status, to combine privileges and transmit them to one's children. This reduced social mobility is inevitably reflected in the economic disparities between families and in Italy would explain 35% of the increase in the inequality of incomes (11% on average in OECD Countries). (Figure 6.1.2)
... and Italy in recent years
Returning within Italian borders, we refer to the data from the survey about income and living conditions of the European project Eu-Silc (Note 5), which, although it is recent and therefore does not allow to extend analysis to before the year 2003, offers information with regional details. In the event of perfect equidistribution of income, in general it is assumed that 20% of the poorest families would accumulate 20% of the overall income, the second 20% would earn another 20% of the income and so on; in essence every 'fifth' of the population should have a fifth of the overall income (Note 6).
By showing the fifths calculated and the real population in a graph, the effective situation can be displayed as a curve, typically 'the Lorenz curve', and compared with the ideal situation of equidistribution, which is represented as a bisector line, and then measuring the degree of deviation between the line and the curve: the further the curve is away from the bisector, the greater the inequality in income distribution is, and vice versa.
In this way it can be seen that in Italy in 2009, the first fifth of the population, i.e. the poorest 20%, held 8% of the total income and the richest 20% had 37% of the overall income. In Veneto, the inequality is a little less pronounced and, like at the national level, has slightly improved over time: the first fifth held 10% of the total income (9.4% in 2003), the second fifth 15%, the third 18%, the fourth 23% and the last, namely the richest 20%, concentrated 34% of the total income (36.2% in 2003). More succinctly, in the period considered, the Gini index for Veneto went from 0.26 to 0.24, keeping below the national value (from 0.31 to 0.29) which was particularly affected by the high levels of inequalities in the Southern regions. It should be noted however, that due to the lack of available data, the analysis excludes any possible impact from the current crisis. (Figure 6.1.3)
By examining the composition of the fifths of income more closely and considering some characteristics of the households, the types of families which are in more difficulty than others can be identified.
Compared to the national distribution of income (Note 7), in Veneto only 10.4% of the households fall into the lowest fifth, with an equivalent household income lower than 12,589 euros per year, whereas almost 50% is concentrated in the medium and medium to high ranges, i.e. with incomes between 17,275 and 28,670 euros.
Comparison of these percentages, referring to the total number of households in Veneto, shows that the people who live alone and those living in families with a large number of members present the most imbalanced distribution and concentrate to a greater extent than others in the lowest income fifth. It is in fact the families made up of just two members which are most found in the richest fifth (7 per cent more than average).
The presence of minors in households contributes to an unequal distribution in the lowest income fifths: among the families with two or more minors, only 7% are in the maximum income range, whereas among those without dependent children the percentage rises to 23.2% and goes up to 50% if we also consider the medium-high income range (4th fifth, over 21,958 Euro of equivalent family income a year).
The number of income earners in the household is also an important factor in sorting the households: households with only one earner are strongly unbalanced (about 19% of these households are in the first income fifth, almost double the regional average of 10.4%), whereas households with at least two earners are concentrated for more than 24% of cases in the last income fifth, i.e. double the number of single earner families. But it is especially the source of income, if it is self-employment, subordinate employment or pension for example, which determines the major differences. The distribution of households in which the income derives from subordinate employment is more uniform, given the minor variability in wages, whereas self-employment ensures better economic conditions, so much that almost half of these households fall into the highest income fifth. Those who receive a pension or other public transfers are in the central income range, mostly medium to low. (Table 6.1.2)
2010 was the European year of 'combating poverty and social exclusion', the theme that the European Commission decided to keep among the priorities of the EU policies and, in the renewal of the impetus to combat all forms of poverty, the Europe 2020 strategy is aimed at reducing the number of people at risk of poverty or social exclusion by at least 20 million before 2020.
The progress in achieving this goal is measured by Eurostat by using three indicators: the risk of poverty, understood as the share of population that has an income lower than the poverty threshold, the rate of severe material deprivation, which refers to the impossibility of accessing certain goods and services considered common and ordinary or perceived as necessary for the standards of the society in which we live, and the percentage of people who belong to a household with very low work intensity or without work.
The combination of these three indicators results in a fourth summary indicator, used to monitor the European objective and obtained as a percentage of people who experience at least one of the three conditions identified by the individual indicators (Note 8).
This approach reflects the multiplicity of factors underlying poverty and social exclusion, considering the various dimensions of quality of life and understanding, in addition to the lack of income and material resources to live in dignity measured by the risk of poverty, also forms of exclusion not necessarily linked to income, such as the inability to access basic services, or job insecurity.
The deprivation index examines 9 aspects, among which: not being able to afford a meal with meat or protein regularly, a holiday of at least a week away from home during the year, to not be able to pay bills, the rent or mortgage loans, to not be able to afford to adequately heat the home, face unexpected expenses or have certain durable goods, such as a telephone, a television, a washing machine and a car. It is considered as a state of material deprivation if a family cannot afford at least three of the goods and services described above and it is defined as a serious situation in which four or more are lacking.
It is therefore a non-monetary measure which takes into account the effects and final living conditions of people rather than the potential satisfaction of these needs, i.e. the lack of resources to obtain a certain well-being. Compared to the more traditional measures on poverty based on income, the new approach has the merit of adding important information, because material deprivation can be understood as the output of poverty in monetary terms when it persists over time. For example, think of a sick person who has to face large expenses for medical care which are then subtracted from money which would have been used for purchasing goods and services considered essential, although this person has a good income: his/her discomfort cannot be captured only by monetary income.
The two types of measures, monetary poverty and material deprivation, express different concepts, but they are complete and can be used together to analyse different aspects of living conditions of individuals and of families. Both, among other things, meet the definition of poverty defined by the Council of Ministers of the European Union in 1985, based on the consideration that the poor are those who have limited 'material, cultural and social' resources, so much as to not be able to ensure an acceptable living standard.
Finally, the 'very low work intensity' index takes into account another dimension of social exclusion, that of the labour market. Independently from the level of household income and serious material deprivation, it expresses the percentage of people who are under 60 years old who live in households where the adults work less than 20% of their potential.
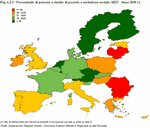
Italy is found in an intermediate situation with 24.5% of the population at risk of poverty or social exclusion, a similar value to that of 2009; there are almost 15 million people in this situation, i.e. 13% of the EU27. Incidence values close to those of Italy are found in the United Kingdom (23.1%), Spain (25.3%) and Portugal (25.5%), whereas in France (19.3%) and Germany (19.7%) the difficulties are fewer. (Figure 6.2.1)
16.4% of the European population are exposed to the risk of poverty, 8.1% are found in conditions of serious material deprivation, whereas 10% live in a household of low work intensity. All three of the conditions are connected (1.5% of the EU27 population), i.e. all those who are at risk of poverty live in conditions of serious material deprivation.
Within the European Union, the percentage of people who live in a state of serious material deprivation varies greatly (from 0.5% of Luxembourg to 35% of Bulgaria) compared to the risk of poverty (9% in the Czech Republic, 21.3% in Latvia) and Countries which experience high levels of economic poverty are not necessarily the same as those with high deprivation rates.
On the other hand, because of the considerations set out above, the two indicators highlight different aspects of discomfort. The Eurostat indicator of poverty, defining the risk of poverty of those who live in families with income lower than 60% of the average national income, is a measure of relative poverty, which takes into account the distribution of income in each Country and identifies the conditions of poverty in the disadvantage of some people compared to all the others. It is based, therefore, on the level of inequality between incomes, with the result that an average rich Country which however has strong imbalances in the distribution of wealth may have a high risk of poverty, due to the high number of people with incomes far from the average, perhaps even more pronounced than what occurs in a Country which is overall poorer but with less inequality.
The measure of material deprivation, however, captures the difficulties of daily living through the ability of the household to access determined goods and services, and does not depend on the characteristics of the distribution of income. The goods and services considered are the same for all European Union Countries, independently from various living standards achieved in various social contexts, therefore deprivation can be understood as a measure of absolute poverty. For example, Spain shows a risk of poverty (20.7%) higher than the European average; this is associated, however, to a contained rate of serious material deprivation (4%), signalling on one hand by a marked inequality in the distribution of income and on the other that the living conditions are acceptable for the large part of the population, even for those who have a low income. Conversely, in Hungary and Slovakia, despite a poverty rate that is relatively contained or anyway lower than Europe, the majority of the population is subject to limitations and sacrifices.
The most vulnerable Countries, recording the highest percentages of both indicators, are Latvia, Romania and Bulgaria. (Figure 6.2.2)
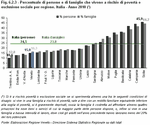
However, 15% of the population suffer discomfort in Veneto (16.3% of households), with a slight percentage increase compared to the previous year (14.1%), although the incidence is below the national average (24.5%) and is one of the lowest among the Italian regions, after Trentino Alto Adige, Emilia Romagna and the Aosta Valley; there are anyway 732 thousand people (over 331 thousand households) in difficulty, i.e. who do not live according to the standards of the current society and who, in the most serious cases, fail to meet the basic needs of life. (Figure 6.2.3)
There is a slight disadvantage for women, whereas the effect of age in Veneto highlights a greater risk for children and the elderly, contrary to that which is observed at a national and European level, where the incidence follows a profile which decreases with age. The central range, corresponding with working age, is however the least vulnerable because it is protected by greater incomes from work.
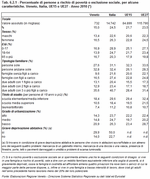
More at risk are the people who live alone, especially if elderly, the families with dependent children, especially large families with three or more dependent children, and people who have low educational qualifications. Investment in education represents an effective strategy of contraction, so much so that the percent of people at risk of poverty or social exclusion is reduced significantly with the increase of qualification.
In Veneto and in the whole of Italy, living in a highly or averagely urbanised area does not determine significant differences in the diffusion of social exclusion, whereas those who live in poorly urbanised areas experience more difficult conditions, as they are more isolated and are not reached by all services.
The risk of poverty and social exclusion is frequently associated with housing deprivation: families living in housing discomfort, due to lack of space or the presence of structural defects of various kinds, usually have to face other difficulties and limitations in daily life.
Comparison at the European level shows that the most disadvantaged are the families with dependent children, especially if children are three or more, and the elderly who live alone. Furthermore, on average in Europe less disparity is felt among different types of households, as shown by the lowest variability of the indicator. (Table 6.2.1)
The progress in achieving this goal is measured by Eurostat by using three indicators: the risk of poverty, understood as the share of population that has an income lower than the poverty threshold, the rate of severe material deprivation, which refers to the impossibility of accessing certain goods and services considered common and ordinary or perceived as necessary for the standards of the society in which we live, and the percentage of people who belong to a household with very low work intensity or without work.
The combination of these three indicators results in a fourth summary indicator, used to monitor the European objective and obtained as a percentage of people who experience at least one of the three conditions identified by the individual indicators (Note 8).
This approach reflects the multiplicity of factors underlying poverty and social exclusion, considering the various dimensions of quality of life and understanding, in addition to the lack of income and material resources to live in dignity measured by the risk of poverty, also forms of exclusion not necessarily linked to income, such as the inability to access basic services, or job insecurity.
The deprivation index examines 9 aspects, among which: not being able to afford a meal with meat or protein regularly, a holiday of at least a week away from home during the year, to not be able to pay bills, the rent or mortgage loans, to not be able to afford to adequately heat the home, face unexpected expenses or have certain durable goods, such as a telephone, a television, a washing machine and a car. It is considered as a state of material deprivation if a family cannot afford at least three of the goods and services described above and it is defined as a serious situation in which four or more are lacking.
It is therefore a non-monetary measure which takes into account the effects and final living conditions of people rather than the potential satisfaction of these needs, i.e. the lack of resources to obtain a certain well-being. Compared to the more traditional measures on poverty based on income, the new approach has the merit of adding important information, because material deprivation can be understood as the output of poverty in monetary terms when it persists over time. For example, think of a sick person who has to face large expenses for medical care which are then subtracted from money which would have been used for purchasing goods and services considered essential, although this person has a good income: his/her discomfort cannot be captured only by monetary income.
The two types of measures, monetary poverty and material deprivation, express different concepts, but they are complete and can be used together to analyse different aspects of living conditions of individuals and of families. Both, among other things, meet the definition of poverty defined by the Council of Ministers of the European Union in 1985, based on the consideration that the poor are those who have limited 'material, cultural and social' resources, so much as to not be able to ensure an acceptable living standard.
Finally, the 'very low work intensity' index takes into account another dimension of social exclusion, that of the labour market. Independently from the level of household income and serious material deprivation, it expresses the percentage of people who are under 60 years old who live in households where the adults work less than 20% of their potential.
Social exclusion in Europe
By considering the Eurostat definition, in 2010 in 27 European Union Countries, it is estimated that almost 116 million people were at risk of poverty or social exclusion and among these, 70 million lived in one of the 17 Eurozone Countries. They represent 23.5% of the overall population, a substantially stable percentage compared to the previous year, which hides significant differences between the Countries. If the Czech Republic, Austria and Countries of the North record the lowest percentages, lower than 18%, the most critical situations are observed in Lithuania, Latvia, Romania and Bulgaria, where over a third of the population live in discomfort. Italy is found in an intermediate situation with 24.5% of the population at risk of poverty or social exclusion, a similar value to that of 2009; there are almost 15 million people in this situation, i.e. 13% of the EU27. Incidence values close to those of Italy are found in the United Kingdom (23.1%), Spain (25.3%) and Portugal (25.5%), whereas in France (19.3%) and Germany (19.7%) the difficulties are fewer. (Figure 6.2.1)
16.4% of the European population are exposed to the risk of poverty, 8.1% are found in conditions of serious material deprivation, whereas 10% live in a household of low work intensity. All three of the conditions are connected (1.5% of the EU27 population), i.e. all those who are at risk of poverty live in conditions of serious material deprivation.
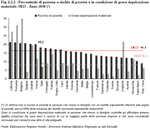
Within the European Union, the percentage of people who live in a state of serious material deprivation varies greatly (from 0.5% of Luxembourg to 35% of Bulgaria) compared to the risk of poverty (9% in the Czech Republic, 21.3% in Latvia) and Countries which experience high levels of economic poverty are not necessarily the same as those with high deprivation rates.
On the other hand, because of the considerations set out above, the two indicators highlight different aspects of discomfort. The Eurostat indicator of poverty, defining the risk of poverty of those who live in families with income lower than 60% of the average national income, is a measure of relative poverty, which takes into account the distribution of income in each Country and identifies the conditions of poverty in the disadvantage of some people compared to all the others. It is based, therefore, on the level of inequality between incomes, with the result that an average rich Country which however has strong imbalances in the distribution of wealth may have a high risk of poverty, due to the high number of people with incomes far from the average, perhaps even more pronounced than what occurs in a Country which is overall poorer but with less inequality.
The measure of material deprivation, however, captures the difficulties of daily living through the ability of the household to access determined goods and services, and does not depend on the characteristics of the distribution of income. The goods and services considered are the same for all European Union Countries, independently from various living standards achieved in various social contexts, therefore deprivation can be understood as a measure of absolute poverty. For example, Spain shows a risk of poverty (20.7%) higher than the European average; this is associated, however, to a contained rate of serious material deprivation (4%), signalling on one hand by a marked inequality in the distribution of income and on the other that the living conditions are acceptable for the large part of the population, even for those who have a low income. Conversely, in Hungary and Slovakia, despite a poverty rate that is relatively contained or anyway lower than Europe, the majority of the population is subject to limitations and sacrifices.
The most vulnerable Countries, recording the highest percentages of both indicators, are Latvia, Romania and Bulgaria. (Figure 6.2.2)
Less sacrifices in Veneto
In Italy, a regional analysis shows the usual framework of territorial disparity, with very worrying indicators in the Southern regions: in particular, 4 out of 10 people are at risk of poverty or social exclusion in Calabria and almost half in Campania and Sicily. However, 15% of the population suffer discomfort in Veneto (16.3% of households), with a slight percentage increase compared to the previous year (14.1%), although the incidence is below the national average (24.5%) and is one of the lowest among the Italian regions, after Trentino Alto Adige, Emilia Romagna and the Aosta Valley; there are anyway 732 thousand people (over 331 thousand households) in difficulty, i.e. who do not live according to the standards of the current society and who, in the most serious cases, fail to meet the basic needs of life. (Figure 6.2.3)
The most fragile households
But who are the people forced to live in this discomfort? So far, social exclusion has been analysed in aggregated terms, but some categories are undoubtedly more vulnerable than others. There is a slight disadvantage for women, whereas the effect of age in Veneto highlights a greater risk for children and the elderly, contrary to that which is observed at a national and European level, where the incidence follows a profile which decreases with age. The central range, corresponding with working age, is however the least vulnerable because it is protected by greater incomes from work.
More at risk are the people who live alone, especially if elderly, the families with dependent children, especially large families with three or more dependent children, and people who have low educational qualifications. Investment in education represents an effective strategy of contraction, so much so that the percent of people at risk of poverty or social exclusion is reduced significantly with the increase of qualification.
In Veneto and in the whole of Italy, living in a highly or averagely urbanised area does not determine significant differences in the diffusion of social exclusion, whereas those who live in poorly urbanised areas experience more difficult conditions, as they are more isolated and are not reached by all services.
The risk of poverty and social exclusion is frequently associated with housing deprivation: families living in housing discomfort, due to lack of space or the presence of structural defects of various kinds, usually have to face other difficulties and limitations in daily life.
Comparison at the European level shows that the most disadvantaged are the families with dependent children, especially if children are three or more, and the elderly who live alone. Furthermore, on average in Europe less disparity is felt among different types of households, as shown by the lowest variability of the indicator. (Table 6.2.1)
A focus on three separate indicators, risk of poverty, serious material deprivation and low work intensity, allows to distinguish different situations of hardship, also in order to better target policies aimed at combating social exclusion. As part of the Europe 2020 strategy, in fact, each Country can choose how to intervene and on which form of discomfort to focus in order to reach their objective. In this context, Italy intends to contribute by reducing of about 2.2 millions the number of people at risk of poverty or social exclusion, signalling the intention to focus attention on the people in conditions of material deprivation and on those coming from households with low work intensity, on whom the impact of the crisis is stronger (Note 9).
Italy is different to the European average especially because of the greater presence of people at risk of poverty (18% of the elderly population16% of the EU27), whereas in terms of material deprivation (6.9%) the situation is more favourable if the comparison is extended to the total of 27 European Countries (8.1%), but not if comparison is limited to the EU15 (5.2%). However, significant differences in the share of people living in households of low work intensity (around 10% both for Italy and Europe) are not observed.
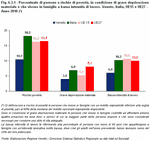
For Veneto all the indicators show a situation relatively less worrying compared to the Italian and European context, both for diffusion and for level of discomfort: if at a national level 27.3% of people at risk of poverty or social exclusion experiences at least two out of the three conditions of discomfort considered, this percentage falls to 21.5% for Veneto. The most widespread symptom is the risk of poverty, which in general is not associated to neither of the other two. However, if the comparison is positive, the extent of the phenomenon in terms of citizens involved should not be overlooked: the risk of poverty involves 10.5% of residents in Veneto, serious material deprivation 3.9% and low work intensity 6% of the population under 60.
Like at the national level, both the risk of poverty and the rate of serious material deprivation have remained substantially stable in the last two years, whereas the number of those who live in households of low work intensity has increased (4% in Veneto and 8.8% in Italy in 2009). (Figure 6.3.1)
Although for the moment the Eurostat indicator does not consider all the dimensions of life, omitting some aspects which are indeed very important such as for example education, the diagram below has tried to associate the 9 deprivations considered by Eurostat to the areas to which the needs mentioned above with reference to the quality of life belong. It should be noted that the ratio between the type of need and the index value is not always 1 to 1. For example, the ability to pay the bills for domestic appliances, rent and the mortgage loans regards the entire area of physical needs in general: it is true that it mostly refers to the home, therefore, the need to protect oneself from weather conditions can also fit into this, and also other survival needs can be associated such as to defend oneself from hunger and illness. Consider water, it is the basis of our nutrition and is also essential to maintain good personal hygiene, avoiding any negative effects on the state of health and on physical well-being of the person. In the same way, being able to keep the house sufficiently warm does not satisfy only the need to protect oneself from the elements, but also to prevent illness; whereas being able to eat food which is high in protein refers to the need to feed oneself and contributes to good health.
At the heart of each area there are needs that are considered primary because they are linked to survival and needs of a higher level; they can vary also based on the society of reference and the average living standards achieved. For example, possessing certain tangible goods, such as a washing machine or a dishwasher, which are not essential to survive but are considered as important and almost essential for daily life according to certain standards recognised as normal, can fall into the category of higher level needs.
Being able to afford a holiday of at least one week in a year helps to regenerate oneself and free oneself from fatigue, whereas being able to face unexpected costs refers to ability to save, intended as a guarantee and source of peace of mind for the future. (Figure 6.3.2)
By exploring the individual hardships which constitute the Eurostat indicator, interesting differences are observed that are signs of less favourable living conditions in some areas.
Possessing tangible goods, such as a television, a washing machine, a telephone and a car, is now a widespread situation, even if the car is not always taken into account in all European Countries. In general, difficulties of an economic nature are the most common: 12.5% of Italians accumulated arrears in the payment of rent, mortgage loans or bills, 11% are not able to adequately heat their home and 7% cannot afford a regular protein meal. Moving on to the higher level of needs, not strictly essential to survive but important for an acceptable lifestyle, 40% are not able to cope adequately with the need to 'defend themselves from fatigue', going on holiday of at least one week a year at least, and a third declare to not be able to cope with unexpected expenses, thereby making themselves insecure about being able to ensure a certain future for their children. In the South, discomfort linked to the home is more pronounced, due to not being able to adequately heat the home or to comfortably support household expenses, and the difficulty of having added resources with respect to those necessary for ordinary and daily expenses is especially high.
For the inhabitants of Veneto, sacrifices are less, although some forms of sacrifice are widespread that indicate living conditions below the standard: 5% find it difficult to heat their home and to have a regular meal with meat or protein, 10% cannot keep up with bills and expenses for the home, 27% think that they would not be able to cope with an unexpected expense and 32% cannot go on holiday for at least one week a year. (Table 6.3.1)
The individual levels of deprivation are the lowest in Europe, except for the difficulty to provide adequate nutrition or to cope with unexpected costs, but the greatest share is that of those who suffer from different types of discomfort, i.e. three or even more. For example, in Italy the percentage of people in situations of material deprivation, or who are forced to have at least three deprivations, is equal to 16%, compared to an European average of 17.5%. Among those who bear the hardship more, the gap is 6.9 against 8.1.
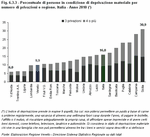
At the territorial level, in addition to the diffusion of the problem, its intensity is also diverse, as shown from the exam of the average number of defects suffered by households in various regions. In Sicily, for example, almost a third of the population lives in a state of material deprivation and 16% have four or more deficiencies, i.e. live in the most disadvantaged of the severe deprivation situations. In the regions of the North of Italy, the area of greater discomfort is notably reduced and in Veneto concerns less than 4% of residents. (Figure 6.3.3)
The calculation of the household index takes into account the individuals of working age: it counts the overall number of hours they worked in the previous year and compare such number with the work potential of the household, simulating that all the working age individuals have worked stably full time all year long. (Note 11).
In Europe, 10% of the population under 60 years of age who were resident in the EU27 in 2010 lived in households of low working intensity, having worked in the previous year less than their potential. The results were practically identical (10.6%) when considering the EU15. There is a moderate variability between European Countries, registering shares higher than 20% in Ireland, down to 6% in Cyprus, Luxembourg and Sweden. Italy is in line with the European average, with a percentage equal to 10.2%, near to the shares of Spain, France, Denmark and Germany.
Recognising the effect of the economic crisis on the labour market, it should be noted that the percentage of people in low working intensity households has grown in a year by 11% in Europe and 16% in Italy.
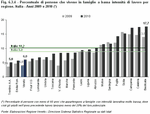
Obviously, the situation varies widely in the different regions: the Northern regions experience the problem less intensely, with a share lower than half of the national average, whereas Southern regions confirm a greater coexistence with the phenomenon, with percentages that are a lot higher than the average (17.4% in Calabria and 17.7% in Basilicata), reflecting high levels of unemployment. The above mentioned increase of the indicator occurred last year in Italy is reflected in the regional data: with the exception of Sardinia and Sicily; all the other regions witnessed a resurgence of the phenomenon. In Veneto, where the situation remains less worrying (6%), last year the problem increased to an extent that is not to be neglected, recording a variation of 50% with regards to the 'very low work intensity' index of 2009 (4%). (Figure 6.3.4)
Italy is different to the European average especially because of the greater presence of people at risk of poverty (18% of the elderly population16% of the EU27), whereas in terms of material deprivation (6.9%) the situation is more favourable if the comparison is extended to the total of 27 European Countries (8.1%), but not if comparison is limited to the EU15 (5.2%). However, significant differences in the share of people living in households of low work intensity (around 10% both for Italy and Europe) are not observed.
For Veneto all the indicators show a situation relatively less worrying compared to the Italian and European context, both for diffusion and for level of discomfort: if at a national level 27.3% of people at risk of poverty or social exclusion experiences at least two out of the three conditions of discomfort considered, this percentage falls to 21.5% for Veneto. The most widespread symptom is the risk of poverty, which in general is not associated to neither of the other two. However, if the comparison is positive, the extent of the phenomenon in terms of citizens involved should not be overlooked: the risk of poverty involves 10.5% of residents in Veneto, serious material deprivation 3.9% and low work intensity 6% of the population under 60.
Like at the national level, both the risk of poverty and the rate of serious material deprivation have remained substantially stable in the last two years, whereas the number of those who live in households of low work intensity has increased (4% in Veneto and 8.8% in Italy in 2009). (Figure 6.3.1)
The needs of the human being and material deprivation
Quality of life is a complex and multidimensional phenomenon, which regards different contexts of well-being: it refers to the satisfaction of physical needs and also social and cultural needs; furthermore, in an advanced society, in addition to basic needs, whose satisfaction ensures a dignified live, also higher level needs are valued. Protection from the weather conditions, hunger and illness have always been crucial for the human being, but it is also important not to feel scared with regards to physical, psychological and material violence which can be inflicted or not to feel overwhelmed by uncertainty for the future and the concern of not being able to live at least according to minimum living standards with adequate care and assistance. In addition, keeping oneself from fatigue and ignorance are basic needs, as well as all those rights which must be guaranteed to all human beings; not to enjoy free time of good quality, as well as adequate education and training, limits personal freedom and can trigger mechanisms of exclusion and isolation. Although for the moment the Eurostat indicator does not consider all the dimensions of life, omitting some aspects which are indeed very important such as for example education, the diagram below has tried to associate the 9 deprivations considered by Eurostat to the areas to which the needs mentioned above with reference to the quality of life belong. It should be noted that the ratio between the type of need and the index value is not always 1 to 1. For example, the ability to pay the bills for domestic appliances, rent and the mortgage loans regards the entire area of physical needs in general: it is true that it mostly refers to the home, therefore, the need to protect oneself from weather conditions can also fit into this, and also other survival needs can be associated such as to defend oneself from hunger and illness. Consider water, it is the basis of our nutrition and is also essential to maintain good personal hygiene, avoiding any negative effects on the state of health and on physical well-being of the person. In the same way, being able to keep the house sufficiently warm does not satisfy only the need to protect oneself from the elements, but also to prevent illness; whereas being able to eat food which is high in protein refers to the need to feed oneself and contributes to good health.
At the heart of each area there are needs that are considered primary because they are linked to survival and needs of a higher level; they can vary also based on the society of reference and the average living standards achieved. For example, possessing certain tangible goods, such as a washing machine or a dishwasher, which are not essential to survive but are considered as important and almost essential for daily life according to certain standards recognised as normal, can fall into the category of higher level needs.
Being able to afford a holiday of at least one week in a year helps to regenerate oneself and free oneself from fatigue, whereas being able to face unexpected costs refers to ability to save, intended as a guarantee and source of peace of mind for the future. (Figure 6.3.2)
By exploring the individual hardships which constitute the Eurostat indicator, interesting differences are observed that are signs of less favourable living conditions in some areas.
Possessing tangible goods, such as a television, a washing machine, a telephone and a car, is now a widespread situation, even if the car is not always taken into account in all European Countries. In general, difficulties of an economic nature are the most common: 12.5% of Italians accumulated arrears in the payment of rent, mortgage loans or bills, 11% are not able to adequately heat their home and 7% cannot afford a regular protein meal. Moving on to the higher level of needs, not strictly essential to survive but important for an acceptable lifestyle, 40% are not able to cope adequately with the need to 'defend themselves from fatigue', going on holiday of at least one week a year at least, and a third declare to not be able to cope with unexpected expenses, thereby making themselves insecure about being able to ensure a certain future for their children. In the South, discomfort linked to the home is more pronounced, due to not being able to adequately heat the home or to comfortably support household expenses, and the difficulty of having added resources with respect to those necessary for ordinary and daily expenses is especially high.
For the inhabitants of Veneto, sacrifices are less, although some forms of sacrifice are widespread that indicate living conditions below the standard: 5% find it difficult to heat their home and to have a regular meal with meat or protein, 10% cannot keep up with bills and expenses for the home, 27% think that they would not be able to cope with an unexpected expense and 32% cannot go on holiday for at least one week a year. (Table 6.3.1)
The individual levels of deprivation are the lowest in Europe, except for the difficulty to provide adequate nutrition or to cope with unexpected costs, but the greatest share is that of those who suffer from different types of discomfort, i.e. three or even more. For example, in Italy the percentage of people in situations of material deprivation, or who are forced to have at least three deprivations, is equal to 16%, compared to an European average of 17.5%. Among those who bear the hardship more, the gap is 6.9 against 8.1.
At the territorial level, in addition to the diffusion of the problem, its intensity is also diverse, as shown from the exam of the average number of defects suffered by households in various regions. In Sicily, for example, almost a third of the population lives in a state of material deprivation and 16% have four or more deficiencies, i.e. live in the most disadvantaged of the severe deprivation situations. In the regions of the North of Italy, the area of greater discomfort is notably reduced and in Veneto concerns less than 4% of residents. (Figure 6.3.3)
The problem of low work intensity
The third indicator which defines the risk of poverty or social exclusion, more strictly refers to the labour market and can be considered in the same way as a measure of deprivation not of material goods but of work. In essence, it assumes that those who live in a household in which only a few people have work, or people are underemployed or do not have work, are at risk of poverty and social exclusion, even when their income is above the poverty threshold and they do not suffer from material deprivation. It is also true that the situation of low work intensity is a discomfort which in general is associated with other forms of disadvantage and therefore it worsens the household situation. Those who undergo intermittent exclusion from the labour market, perhaps even alternating periods of employment with others of inactivity, or work reduced hours, are most often subject to the risk of poverty and social exclusion. Eurostat showed the significance of this indicator and that the risk of poverty or social exclusion decreases proportionally to the increase in work intensity (Note 10). For example, in Italy in 2010 splitting work intensity into 4 levels from the 'almost-jobless', who work for at least 20% of the potential, up to 'almost job-full', who work for over 75% of the potential, 59% of people who live in families at the lowest level of work intensity were at risk of poverty or social exclusion, whereas among those who worked more, but still under 50% of the potential, this risk of poverty reduced to 34%. Among the 'almost job-full' the risk was equal to 14.6%.The calculation of the household index takes into account the individuals of working age: it counts the overall number of hours they worked in the previous year and compare such number with the work potential of the household, simulating that all the working age individuals have worked stably full time all year long. (Note 11).
In Europe, 10% of the population under 60 years of age who were resident in the EU27 in 2010 lived in households of low working intensity, having worked in the previous year less than their potential. The results were practically identical (10.6%) when considering the EU15. There is a moderate variability between European Countries, registering shares higher than 20% in Ireland, down to 6% in Cyprus, Luxembourg and Sweden. Italy is in line with the European average, with a percentage equal to 10.2%, near to the shares of Spain, France, Denmark and Germany.
Recognising the effect of the economic crisis on the labour market, it should be noted that the percentage of people in low working intensity households has grown in a year by 11% in Europe and 16% in Italy.
Obviously, the situation varies widely in the different regions: the Northern regions experience the problem less intensely, with a share lower than half of the national average, whereas Southern regions confirm a greater coexistence with the phenomenon, with percentages that are a lot higher than the average (17.4% in Calabria and 17.7% in Basilicata), reflecting high levels of unemployment. The above mentioned increase of the indicator occurred last year in Italy is reflected in the regional data: with the exception of Sardinia and Sicily; all the other regions witnessed a resurgence of the phenomenon. In Veneto, where the situation remains less worrying (6%), last year the problem increased to an extent that is not to be neglected, recording a variation of 50% with regards to the 'very low work intensity' index of 2009 (4%). (Figure 6.3.4)


