-
Statistical department’s site
Home page
Our publications
Labour sustainability: a multi-faceted story
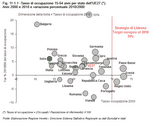
What has happened in the last ten years? Although still far from the Lisbon 2010 benchmarks, many European countries in the last decade have improved their initial conditions, nearing the countries which were already performing better and reducing the gap that separates them from the European average. At the forefront was Bulgaria, which in ten years moved from a 50.4% labour participation of its population aged 15 to 64 in 2000 to 59.7% in 2010. Though still among the countries with the lowest employment levels, Italy had significant growth (6%) in its employment rate between 2000 and 2010.
In 2010 seven EU Member States achieved the Lisbon objective of a 70% employment rate. Holland came first with 74.7%, two points higher than its 2000 percentage. Denmark followed with 73.4%, though this was lower than in 2000 (76.3%). Germany's position is remarkable as it increased its employment rate by more than 5 percentage points in ten years to overtake the EU target, as 71% of its population were employed. By contrast, some Member States had employment rates that were over 10 points under the target. Among them was also Italy with a rate of 56.9%.
In terms of objectives relating to women and older people, Member States performed better. As for women, the 60% objective was met or exceeded in 12 countries, while nine countries had at least 50% of the population aged 55 to 64 employed. (Figure 11.1.1)
The performance of Italian regions
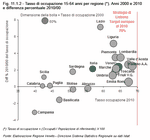
Bearing in mind that the employment cycle lags a little behind the production cycle timewise, the crisis again caused the Italian employment rate to fall in 2010, down 0.6% on 2009, casting it even further adrift of the European target.Lazio is the region that has made the best progress in ten years as its employment rate increased by over 7 points compared to its initial percentage. Liguria came second with a 5% increase. Veneto started off in a better position and had the seventh highest increase, 2.4% in ten years, in the regional ranking. In 2010 it also had the fifth highest employment rate, i.e. 64.5%. Southern Italian regions curbed Italian growth. In 2000 they had the lowest labour market participation, and today they have lower or at best identical employment rates. The worst performing region is Campania: in 2010 not even 40% of its population were regularly employed. This figure is lower than the 43% one of ten years ago.
The best performer is Trentino Alto Adige where 68.5% of people, up 2.5% on 2000, are employed. Emilia Romagna comes second with 67.4%. It is the only Italian region that has managed to come close the EU objective in the last few years and that exceeded it in 2007 and 2008. (Figure 11.1.2)
In Veneto the situation was better as the number of people employed was the same as the previous year. In particular, though the number of women in the labour market decreased slightly, the labour market participation of men, with an employment rate of 75.3%, increased, the second highest value among Italian regions. By contrast, the employment rate among women, 53.3%, down from 53.9% in the previous year, is the tenth highest and misses the EU objective by 6.7%.
The most significant reductions in the employment rate were those of Basilicata, Calabria and Molise at 2.8%, 2.2% and 2% respectively. The region that seems to be suffering from the crisis the least is Trentino Alto Adige, where the number of employed continues to rise regardless and few people are unemployed.
In line with the national trend, the economic sector that was most affected by the crisis in Veneto was the industrial sector, where the number of employed people decreased by over 5%, especially in industry in the narrow sense where it was down 7.3%, while employment increased in agriculture, up 13%, and in the service sector, up 3%.
Veneto: fatigued but not demoralised
Unemployment is probably the most appropriate variable to consider in order to grasp the social consequences of the recession and the consequent threat to socio-economic sustainability.Since late 2008, unemployment has risen everywhere and in 2010 the unemployment rate in EU27 was 9% compared to 8.9% in 2009. The countries which experienced the greatest difficulty were Spain and the Baltic States: the unemployment rate in the former hit 20.1%, up almost nine percentage points on figures for 2008 and two on figures for 2009; while in the latter it stood at between 17% and 19%.
Italy performed better and was among the group of countries whose increases in unemployment rate were on average lower, considering how serious the recession was. A total of 8.4% of the labour force were looking for a job in 2010, up from 7.8% in 2009.
Veneto figures were constantly below the average Italian levels: 5.8% compared to 4.8% in 2009. This is the highest figure in the last decade. When compared with other Italian regions, Veneto still performed well as its rate was the seventh lowest and few tenths below the best performing regions, with the exception of Trentino Alto Adige and Valle d'Aosta, which have a rate of 3.5% and 4.4% respectively. The worst performers were Southern Italian regions. Sicilia came last and had a rate of 14.7%, up almost one percentage point from 2009.
Over and above figures, features of unemployment should also be considered, in particular with regard to the process by which people are expelled from the labour market. The possibility to find new employment and the speed of business cycle recovery depend on the way people are expelled. The issue is deciding whether expulsion creates a group of underprivileged workers who tend not to enter the labour market again once they have left it, or whether spending a prolonged period of time looking for a job, workers become demoralised and decide to leave the labour market altogether because they have little confidence that they will be able to find a job in the future.
Becoming inactive workers is even worse than being unemployed. Indeed, those who leave the labour market have fewer chances to get back into it compared to those who keep looking for a job.
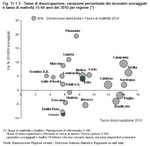
In 2010 in Italy the number of inactive workers rose by 136,000, up almost one percentage point on 2009. The inactivity rate of people aged 15 to 64 was almost 37.8%, up 0.2% from 2009, while in Southern Italy it was as high as 49.2% and nearly 63.7% for women. The number of people who were not actively looking for a job rose considerably, up 7.7% from 2009; those who were waiting for the outcomes of their previous job hunting rose by 17.6%, and those who were not even looking for a job because they believe they will not be able to find one, i.e. the demoralised workers, rose by 10.6%. The situation in Campania is highly demoralising and difficult to sustain socially: 53.6% of the population aged 15 to 64 were inactive-the highest among Italian regions-and in one year alone the region saw a 9.5% increase in the number of people that are not looking for a job but state they are prepared to work.
In Veneto the situation is different: although the number of unemployed people, and hence of people looking for a job, rose, the number of inactive workers fell, especially among demoralised inactive workers who are not looking for a job. The inactivity rate in Veneto is 31.6%, 0.5 percentage points lower than in the previous year. Finally, though it has the lowest inactivity rate, Piemonte is the region with the strongest growth, in one year only, among people aged between 15 and 64 that have no faith in the market and are not looking for a job, though they are prepared to work. (Figure 11.1.3)
In short, Veneto is among the regional leaders for social sustainability; results were characterised principally by a low rate of unemployment, a high employment rate and a low share of inactive individuals.
Support from the Wages Guarantee Fund
Besides unemployed people and demoralised inactive individuals, there are also people on the Wages Guarantee Fund (CIG) (Note 1) who are involuntarily inactive.Over these crisis years, the Wages Guarantee Fund has played an ever increasing role in supporting workers and enterprises, as it guarantees income to people who are made redundant or work on the basis of a lower number of hours. In this way, the companies' professional know-how is safeguarded and depressive effects on consumption are avoided.
In 2009 the Wages Guarantee Fund, which was extended to enterprises and workers that were normally excluded (Extended Wages Guarantee Fund - CIG/D) as an anti-crisis measure, enabled the Italian labour market to absorb, at least partly, the shock of the production crisis.
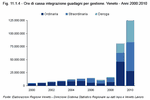
In 2010, the Wages Guarantee Fund scored a new negative record. A total of 1.2 billion hours were authorised in Italy, approximately 32% more than the previous year and the highest number in Italian history. In Veneto almost 125 million Wages Guarantee Fund hours were authorised, 54.3% more than the number granted in 2009. This result was the worst since the early 1990s. In 2010 Veneto used 10.4% of the total Italian Wages Guarantee Fund hours compared to 8.8% in 2009.
In line with national data, the hardest hit sector was the mechanical industry, which used 47% of the total number of Veneto's CIG hours.
Differently from data relating to 2008 and 2009, in both Veneto and Italy, the demand for the Ordinary Wages Guarantee Fund (CIG/O) decreased sharply, while the Special Wages Guarantee Fund (CIG/S) accelerated as expected, partly because many companies moved from the former to the latter. In particular, the CIG/S authorised 55 million hours in 2010, over three times the number in 2009; the CIG/D authorised almost 42 million hours, more than twice the number in the previous year; and the CIG/O authorised about 28 million hours, 39.5% less than in 2009. (Figure 11.1.4)
If the CIG hours are turned into equivalent workers, that is, assuming that the amount of hours each person works in a year is 1,650 (Note 2), in 2010 in Italy there were almost 730,000 equivalent workers and in Veneto there were over 75,000, the third highest value among Italian regions. The region granted the highest number of hours was Lombardia with 26.1% of the Italian total, followed by Piemonte with 15.4%. The figure for Emilia Romagna is also remarkable as the region had the second highest employment rate, but took up 10% of Italian CIG hours and had the second largest variation compared to the previous year.
In the provincial rankings, Vicenza recorded the highest number of employees whose work was suspended completely over the year (20.9% of the Veneto total); Treviso and Padova followed with 20.5% and 20.1% of the regional total respectively. The highest rise, however, was in Verona where the number of equivalent workers was over twice that of the previous year; Rovigo was next with an increase of nearly double.
It should be noted, however, that a large amount of the hours requested is not actually used. This indicates that it is a precautionary action by the companies. It is clear that the hours authorised can be used and accounted for quite some time from the moment when they were authorised. However, we should note the difference in the rate of use in Italy in the last few years. Data relating to the CIG in 2010 show that real use amounted to 48.2% of the hours requested by companies (580 million hours), compared to 65.4% in 2009 (about 598 million) and 76.5% in 2008 (174 million).
There is no doubt that the Wages Guarantee Fund, like other forms of social security, is an essential tool to support many families and keeps people in the labour market. It is equally true, however, that the money in the monthly pay-packet for a family is much less and the situation is hardly sustainable in the long run.
In 2010 Veneto's employment rate for 20-to-64-year-olds was 68.7%, therefore fulfilling the target set by the Lisbon Strategy, which calls for an employment rate of 69% for the European Union by 2010. Italy, however, was distant, as it recorded a rate of 62%, more than seven percentage points below the EU27 figure.
Considering these figures, the Italian government, faced with a new European objective for 2020, set a more realistic target for Italy, between 67% and 69%; Veneto has already reached this level and can thus attempt to achieve the European target.
The main objective of EU programmes is to foster the increase in employment and better jobs, thus promoting an inclusive and 'secure' society and create the necessary conditions for lasting growth. An improvement in the labour market would promote a stronger macroeconomic recovery. It is clear that to do so disparity between area, gender, citizenship and age needs to be removed.
This objective could not have come at a better time than in the year Italy celebrates the 150th anniversary of its unification. Once again it is clear that eliminating inequalities is the key response for collective growth, especially in a country like Italy, which has changed over time and is now an important crossroads for migrants, where foreign workers arrive and grow in numbers as they are joined by their families.
Recognising that we are a national community and at the same time European citizens is an opportunity for Italy to rediscover its identity and grow constantly.
Low female employment is linked with family support policies. The employment rate of Italian women is behind much of Europe due to a traditional lack of services for young children, and women often give up looking for a job or find it difficult to keep one because it is hard for them to reconcile family and work.
In 2010 in Italy the employment rate among women was 46.1%, 12 percentage points lower than the EU27 average and almost 14 percentage points lower than the Lisbon objective of 60% by 2010. This marks a major gap compared to the EU and Lisbon benchmarks and is largely due to the low employment rate among women in Southern Italian regions. A total of 12 countries out of 27 met the European target: first was Denmark with a rate of over 71%, followed by Sweden with 70.3% and the Netherlands with 69.3%.
Overall, the gender employment gap is much wider in Italy compared to almost all other EU countries, with the exception of Malta and Greece. The employment rate among men in Italy is nearly 22 percentage points above that among women, compared to a 12 percentage point difference in EU27. By contrast, the lowest employment gaps can be found in the Baltic countries.
The labour market participation of women in Veneto is better, since in 2010 the employment rate was 53.3%, though down from 53.9% in 2009 and still a long way from the men's rate of 75.3%. The best-performing regions are Valle d'Aosta, Trentino Alto Adige and Emilia Romagna with an employment rate among women of around 60%. These are the only regions that meet the EU target. Moreover, Valle d'Aosta also registers the lowest gender employment gap, 14 percentage points, among Italian regions.
As is the case for Italy, the gender employment gap clearly widens with age. While in the younger age bracket (15-to-24-year-olds) it was less than 11 percentage points in Veneto in 2010, it grew with age and is 29% in the 45-to-54-year-old bracket. Furthermore, it is clear that the employment rate among women over 55 years old is quite low both in Veneto and in Italy. This suggests that in terms of Italian employment policies, more attention should be given to active ageing with a view to a more sustainable and inclusive society.
However, it should be emphasised that in the last few years both in Veneto and in Italy overall, the gender employment gap has been closing. (Table 11.2.1)
Promoting women's talents for a more sustainable economy
In 2010 over 856,000 women were employed, 9.3% of the total of employed women in Italy compared to over 1,255,000 employed men.Processing data for the first three quarters in 2010 from the ISTAT Labour Force Survey, we can see that over 84% of women are employees. On the one hand less than 16% of women in Veneto are self-employed, the second lowest percentage among Italian regions, compared to 30% of the men; on the other hand almost 88% of women work on open-ended contracts (against 91% of men), the third highest percentage among Italian regions.
However, the number of women in managerial positions is low. In Veneto, 2.1% of men are employed in managerial positions and 4.5% are middle managers compared to 0.9% and 3.3% of women. If we sum up the last two figures, Veneto has the lowest percentage of female managers among all Italian regions. There are few self-employed women in Veneto, as low as 2.4%, over three percentage points lower than the percentage among men. Too many women are employed in unskilled jobs: 12.1% against 5.5% of men.
What is also discriminating is salary. With reference to full-time employees, it is estimated that in 2010 over 18% of female workers in Veneto had a monthly salary of less than 1,000 euro, more than twice the estimated number for men. Fortunately this figure is lower than the average Italian level of 22%. Only 19.3% of women in Veneto have salaries over 1,500 euro (23.9% in Italy) against 34.5% of men (33.5% in Italy).
If women are to play a more important role in supporting economic growth and prosperity, their talents clearly need to be fully promoted. Women account for over 60% of graduates, but they are still underrepresented in economic decision-making and are paid less than men.
Part-time: a female story
When talking about economic prosperity, which can only be achieved through full employment and a supply of suitable jobs, within the more general framework of the EU Strategy the issue of part-time work cannot be avoided. Part-time work is regarded as an important means to increase employment participation and to reconcile professional life with personal and family requirements.In general, in the last decade part-time work has increased in Europe with the exception of some Eastern European countries. In 2009 in EU27 almost one worker out of five has a part-time work contract. The country where it is most widespread is the Netherlands, where 48.3% of employed people work part-time, but it is in Austria that the highest increase (over 16 percentage points) was recorded from 2000 to 2009.
Though Italy is below the European average, part-time work is growing. From 8.4% in 2000 it rose to 14.3% in 2009. In Veneto the rate was slightly higher as in 2009 it grew to 14.9%, almost five percentage points above the percentage in 2000.
Part-time work is strongly gender-oriented since it is used to allow many women, who would otherwise be inactive, to stay in the labour market, and often to offset a lack of care services. A key factor accounting for the different distribution of part-time work in different countries is the access to childcare facilities and assistance for the elderly. Account should also be taken of cultural differences with reference to preferences for working hours, different legislation and the incidence of fixed costs and tax breaks which make part-time work more or less convenient for employers.
In 2009 the percentage of employed women on part-time contracts in EU27 was 31.4%, or 3% lower than in 2000, compared to 8.3% for men. The highest percentage of women on part-time contracts is in Northern Europe, whereas 15% of women in Eastern Europe are employed part-time. In particular, percentages range from that of the Netherlands, where three women out of four work part-time (Netherlands also has the highest employment rate among women in EU27) and that of Bulgaria, where less than 3% of women are employed on part-time contracts and their employment rate is 58.3%.
In Italy part-time employment among women has grown in the last nine years. In 2009, 28% of women were employed part-time: over 11 percentage points more than in 2000. By contrast, men in part-time work account for as little as 5.1%.
The gender gap in Veneto is wider: 31.1% of women work part-time compared to 20.7% in 2000. This is the fourth highest percentage among Italian regions. At 3.7%, Veneto has lowest percentage in Italy of men working part-time. The record for women in part-time work is held by Trentino Alto Adige with 36.4%. (Figure 11.2.1)
Are women forced to work part-time or do they choose to?
Working part-time, however, is not always a matter of choice.If we look more closely at employment figures for women, a fair share of women are unable to find a full-time job; these women accounted for about 12% of all employed Italian women in 2009. Veneto was in a better situation where less than 10% of women worked part-time because they were unable to find a full-time job; this is the fifth lowest figure among Italian regions, although it did rise on 2005 (6.4%). Trentino Alto Adige stands out as the Italian region with the lowest percentage of women employed part-time due to a shortage of full-time jobs (7.8%) and has the highest percentage of women who choose to work part-time (28.6%).
Once again, the area worst off is Southern Italy with a much higher percentage of women who do not want to work on part-time contracts but are forced to and hence earn less.
In Veneto over 21% of women choose to work part-time. As hinted at earlier, their main reason is to look after their children or other people in their families, partly because care services are sometimes inadequate. Indeed, a small percentage of women complain about the lack of such services, but it is higher than the percentage at national level. (Figure 11.2.2) and (Table 11.2.2)
In search of a new balance
The population is getting older. This is definitely a consequence of the constant improvement in the quality of life, but it leads to a re-assessment of generation balance and a re-thinking of the processes with which people exit the labour market. To this end, the Lisbon Strategy had set a 50% target for the employment rate of people aged 55 to 64. In 2010 this target was achieved by nine out of twenty-seven EU countries: first was Sweden (71%), then Germany and Denmark (58%), and the United Kingdom (57%). In Italy the percentage was 36.6% and in Veneto 35.4%. However, it should be pointed out that all EU countries, including Italy, have made considerable progress. The EU27 employment rate rose from 37% in 2000 to 46% in 2010. Though starting off from lower levels of employment, Italy succeeded in growing by 9%, from 28% to 37%, and Veneto by 10%, from 25% to 35%. If figures for the last two years alone are compared, the employment rate of the active population (15-to-64-year-olds) has decreased as a consequence of the crisis, but for people aged 55 to 64 it has continued to grow. In particular, EU countries showed some common trends. A report by Italy's National Council for Economics and Labour (CNEL) (Note 4) revealed a higher growth in employment rates in the countries that initially had lower ones. This is a sign that trends in the EU are slowly converging. (Figure 11.2.3)Looking for a job
Young people are in a more worrying position. According to Eurostat, the youth unemployment rate for people aged 15 to 24 is twice, three times and, in some countries, even four times higher than that of people aged 25 or over.It is clear that young people have difficulty finding jobs in a labour market that is striving to overcome the crisis. In 2010, Italian unemployment rose, and more than one quarter of the youth labour force was unemployed. In Southern Italy the situation was even more worrying as in some cases unemployment was over 40%. Though it suffered a 5% increase in youth unemployment compared to 2009, Veneto was among the Italian regions with the lowest youth unemployment rate, 19.1%. (Figure 11.2.4)
One also has to make do with one's pay. If full-time employees' incomes are considered, it emerges that in 2009 in Veneto 70% of young people aged 15 to 19 earned less than 1,000 euro a month. This percentage was as low as 45% for people aged 20 to 24 and half as high for older people: 20% for 25-to-29-year- olds and 12% for 30-to-34-year-olds.
Young people in Veneto are more settled
The first encounter with the labour market is not easy for young people. The percentage of young people who are unemployed or accept jobs below their qualifications is higher and their incomes are lower. But it is not only this: the type of job and the length of contract are also critical.In 2009 in Veneto the youngest workers were mainly employees (92%); most of them were blue-collar workers (53%) and the percentage of people on fixed-term contracts, though mainly over one year, was four times higher than the average for the population (41%).
As young people grow older and obtain higher educational and professional qualifications, their situation improves. The percentage of independent and self-employed workers increases, the number of blue-collar workers goes down and more people find a job as white-collar workers. In short, up to 30 years of age, young people are at a disadvantage compared to the rest of the population. Only when they reach 30-to-34-years old do their employment patterns become more similar to those of older people, though they need to be over 35 to bridge the gap. Between 30 and 34 years old, the percentage of blue-collar and self-employed workers comes closer to the average for the population, but there are still differences in terms of the percentage of self-employed and top-level jobs, i.e. top managers, middle managers and entrepreneurs.
Moreover, as they grow older, young people become more settled in the labour market. In Veneto fixed-term contracts ranged from 38.5% for 20-to-24-year-olds to 8% for 30-to-34-year-olds.
In particular, Veneto was the second-placed region in terms of the lowest percentage of 15-to-34-year-olds on fixed-term contracts (20.3%). Only Lombardia with 17.6% preceded it. This is no doubt a good result, but the trend and the effects of the crisis in the last few years should not be overlooked. In 2005 young people on fixed-term contracts accounted for slightly over 16% of employed persons in Veneto and 20% in Italy. In four years, fixed-term contracts increased by 4% in Veneto and nearly by 3% in Italy. Estimates for 2010 indicated a further increase, with figures reaching 21.2% in Veneto and 23.8% in Italy. (Figure 11.2.5)
On the other hand, a fixed-term job is better than being unemployed. Compared to the rigid labour market, which in the past put heavy pressure on employers, flexible contracts, if they are used well, allow young people to be unemployed for a short time, especially in the current crisis.
Studying or working? Neither
The crisis has no doubt made it more difficult for young people to enter the labour market. This leads us to consider a phenomenon which used to be insignificant but has now come to the forefront, that of the NEETs, or young people Not in Employment, Education or Training. According to the ISTAT Labour Force Survey, in 2009 in Veneto 59% of young people aged 15 to 24 were studying or training, while 30% worked. NEETs make up 11% of young people in Veneto, a lower percentage than at national level, where it is almost 18% (Note 5).Veneto is the Italian region with the third lowest percentage of young people that are not studying or working, only preceded by Emilia Romagna with 10.9% and Trentino Alto Adige with 8.8%.
NEETs: who are they? Some of them are young people who had a job, but lost it and are looking for a new one (unemployed, formerly employed people), others have just finished studying and are looking for their first job (unemployed looking for their first job); others have actively started to look for a job after being unemployed for a while (formerly inactive unemployed).
However, the highest number consists of young people who are out of a job and are not looking for one. In Veneto they accounted for almost 7% of young people aged 15 to 24, while in Italy this figure was over 11%.
It would be simplistic to define them mummies' boys and girls. What we need to do is understand the personal and social implications, but above all investigate the causes. From the above it is clear that the problem of NEETs is associated with inactivity more than unemployment. This means that NEETs are only partly affected by the employment crisis which has hit Italy in the last few years and that in actual fact they are an intrinsic problem. (Figure 11.2.6)
There is also a major difference between Italians and foreigners: in Veneto, in 2009, the percentage of NEETs was below 8% among young Italians, but it was almost four times this among young non-nationals. At national level differences are not as marked, but still clear. The percentage of NEETs ranged between 16.8% of Italians and 27.5% of non-nationals. Indeed, Veneto, together with Friuli Venezia Giulia, is one of the Italian regions where the problem of NEETs is more closely linked to nationality and where the widest gaps are to be found.
The different percentages of NEETs were also a consequence of the non-nationals limited inclination to continue studying. In the 15-to-24-year-old bracket the percentage of working youngsters is higher among foreigners (37% against 29% in Veneto), while it was definitely lower in terms of students (32% versus 63%).
At national level cooperation among the different tiers of government is essential to making the integration of migrants into society easier, thus preventing marginalisation and illegal immigration, while favouring access to citizenship and family reunion. This is meant to ensure sustainability of inflows in terms of society's intake capacity and labour-market requirements at national level.
Veneto is among the leading Italian regions in terms of number of foreigners. It was fourth with 98 foreigners per 1,000 inhabitants in 2009. The top region was Emilia Romagna with 105 foreigners per 1,000 inhabitants. As a consequence, Veneto is also one of the leading Italian regions for number of foreign workers out of the total number of employed people. In 2009 Veneto had over 223,000 foreign workers or almost 12% of migrant workers in Italy. This number amounted to 10.6% of employed people residing in Veneto and was 4% higher than the 2005 figure.
Once again, the North-South divide is quite clear. Southern Italian regions are clearly not so attractive when it comes to work. Foreign employees account for as little as 2% to 4% of the total number of workers compared to 8% to 11% in the Northern Italian regions.
Though the last few years have witnessed a higher increase in employment among foreign women, also as a result of family reunion, 63.2% of legal migrant workers in Veneto were male. The province which attracted most foreign workers was Verona with 63,500, accounting for 15.5% of the labour force in the province. Second was Treviso with 13.7% while the lowest percentage was that of Padova with 4.5%. In line with national data, foreign workers were mainly Romanian (25.7% of total foreigners employed in Veneto), Albanian (11.4%) and Moroccan (9.1%).
Different jobs for foreigners
Considering the imbalance in the active-age population in Italy and the importance of the foreign workforce in the Italian, as well as in the Veneto labour market, job opportunities for migrants should be investigated.Most foreigners, about 200,000 people, worked as employees in Veneto in 2009. Only a small percentage (10.4%), compared to 23% of Italians, was self-employed. This gap was the same in almost all Italian regions with the exception of Sicilia and Sardegna.
In Veneto the number of migrant workers on open-ended contracts was lower (84.3%) than that of native workers (90%). Fixed-term contracts are also different: Italians were mainly offered short-term contracts, with 33.6% of employed persons having contracts lasting a maximum of six months. Employers mostly offered foreigners 7-to-12-month contracts: 38.2% of the foreigners employed on fixed-term contracts against 32.8% of Italians. Finally, 30.4% of Italian workers had fixed-term contracts lasting more than one year compared to 27.3% of foreigners.
In a comparison between regions, data stand out for Calabria, where nearly 40% of migrants against 20.3% of natives are employed on fixed-term contracts. This is the highest percentage for Italians too in all regions. By contrast, the region with the lowest percentage of foreigners employed on fixed-term contracts is Lazio (7.3%).
Foreigners are mostly employed in position below their educational qualifications and their skills. They are mainly blue-collar workers often employed in hard labour, traditional but still essential jobs that require little qualification and are not so attractive to Italians. In 2009 in Veneto a percentage as high as 84.1% of legal migrants were employed as blue-collar workers (77.1% in Italy) compared to 35.5% of Italians (31.3% in Italy). An increasingly higher percentage is employed in industry and especially in the construction sector. In Veneto 38.2% of all foreigners are employed in industry compared to 29.2% of Italians; 14.4% of foreigners work in the construction sector, about double the figure for Italians.
Foreigners are hardest hit by the crisis
In short, the gap between foreigners and Italians in the labour marked was analysed by means of summary indices of participation given by the employment and unemployment rates. While in 2009 in Veneto the 64.7% employment rate of foreigners aged 15 to 64 was similar to that of Italians (64.6%), this was not the case in many Italian regions. Average employment rates for foreigners at national level are higher than those for Italians, 64.5% compared to 56.9%.The unemployment rate among foreigners, however, is definitely higher both at regional and at national level. In Veneto it was 11.5% for migrants and 3.9% for Italians, the third highest gap in the regional ranking; in Italy it was as high as 11.2% for foreigners and 7.5% for Italians.
Imbalances between Italians and foreigners are clear if North and South are compared. In the Southern regions there were fewer foreigners, but it was clear that those who stayed in those regions only did so on the basis of job opportunities. If there are no job opportunities, foreigners are more likely than natives to choose different destinations and move elsewhere, where the demand for labour is higher.
In Southern Italy, employment rates among foreigners are higher than ones for Italians and their unemployment rates are lower. In particular, the widest gaps were found in Sardegna. The difference in employment rates was almost 25% and in unemployment rates it was nearly 9%. To be more precise, in the regional ranking Sardegna is the region with the highest foreigner employment rate (75.3%) and the lowest foreigner unemployment rate (4.8%). (Figure 11.2.7)
As a consequence of the crisis nationality-related imbalances are clearer. It should be emphasised that the crisis has considerably widened already existing gaps between natives and foreigners. The negative impact on employment was greater on migrants than on Italians and in Northern than in Southern regions.
In one year, in Veneto as in Italy, employment rates among foreigners decreased more significantly as the number of unemployed grew considerably. (Table 11.2.3)
Salaries are lower, but in Veneto the gap is more sustainable
Foreigners mainly work in the lowest skilled jobs and this is reflected in their salaries. As for full-time work as employees, in 2009 in Italy a foreigner's average monthly pay was lower than an Italian's by 220 euro. Foreigners working in Northern Italy were better paid than their counterparts in the South. Monthly pay ranged between 1,170 euro in Trentino Alto Adige and 700 euro in Basilicata.Veneto is the region where the gap between foreigners' and Italians' salaries was lowest: 150 euro against 500 euro in Basilicata. Moreover, the percentage of people earning less than 1,000 euro a month was lower: 27.6% of foreigners and 12% of Italians. Both figures were the third lowest among Italian regions. Trentino Alto Adige and Lombardia were the regions with the lowest percentages of employees earning less than 1,000 euro a month.
Figures for many Southern regions are worrying, as over 80% of foreigners employed full-time were paid between 20% and 30% less than local workers. (Figure 11.2.8)
However, studying is expensive. It costs in terms of direct expenses (fees, materials, books etc.) and in terms of a lack of earnings as one studies. This disadvantage has to be subsequently overcome. Studying also has to offer advantages in the form of higher income, greater employment opportunities and better jobs. Studying is an investment and as such needs to give tangible results.
It is clear that growth and development in a society are sustainable if the connection between education and work is strong, that is as long as people have an incentive to continue studying.
According to a study by the Bank of Italy based on OECD data (Note 6), in most developed countries people with higher qualifications earn at least twice as much as people with school-leaving certificates. In OECD countries the employment rate of graduates is on average 10% higher than that of people with school-leaving certificates. In Italy the trends are similar, though with differences between men and women and among regions. The gap in employment rate is as high as 15% for women but down to 7% for men. Moreover, the advantages for graduates are clearer in Southern regions, where employment rates are on average lower.
Still, over the years the tendency to underuse human capital in labour forces risks unhinging the connection between study and work. People work below their qualifications if they have formal qualifications that are higher than those required to do that job.
Based on the ISTAT Labour Force Survey, this trend can be measured by comparing a worker's education level with his/her job. Jobs are ranked according to ISTAT's Classification of Occupations 2001 (Note 7). The classification is based on competence, defined as the ability to carry out the tasks required in a job and the approximate formal qualifications (formal education) that would be expected. It turns out, for example, that in order to go into professions, especially highly qualified ones, Master's degrees or post-graduate courses are necessary. To do technical jobs, however, school-leaving certificates, vocational courses or even three-year degrees are enough.
According to an estimate of the first three quarters in 2010, in Veneto almost 73% of employed people had jobs in line with their qualifications, while 7% were working above their qualifications. The remaining 20% were employed below their qualifications. This percentage is lower than the Italian average, but up compared to 2005 (+5%, +0.5% on 2009). (Table 11.2.4)
At national level, 20.7% of workers perform a job that is below their qualifications; at regional level, Trentino Alto Adige has the lowest share with 14% and the Umbria the highest with almost 30%. Veneto has the eighth lowest percentage of people working below their qualifications in the regional ranking.
If analysis is limited to the pre-crisis period, the constant increase in the employment rate was matched by an equally constant growth in the percentage of people working below their qualifications. This was a sign that job quality was worsening and threatened sustainability in the labour market. Subsequently, in 2009 conditions worsened again. The employment rate was back at 2005 levels and the percentage of people working below their qualifications soared by 0.5% in Veneto and by 1% in Italy. (Figure 11.2.9)
In Veneto people work more and better
A closer look at the connection between employment rates and the percentage of people working below their qualifications showed that Veneto is one of the regions where the conditions in the labour market were not so serious. On the basis of average national estimates for the first three quarters in 2010, Italian regions could be divided into four groups. The first group had employment rates above the Italian average and lower percentages of people working below their qualifications; this included Trentino Alto Adige, Lombardia, Piemonte and Valle d'Aosta considered as one region, and Veneto. Those regions struck a good balance between high employment and high-quality employment, here meant as the connection between a person's education and job, as their citizens were given good opportunities not only to find a job, but also to find one in line with their qualifications. The case of Trentino Alto Adige is remarkable as it was the region with the highest employment rate and the lowest percentage of people working below their qualifications.At the other end were Abruzzo, Molise, Basilicata and Calabria with low employment rates and high percentages of people working below their qualifications. People had difficulty finding jobs and when they did they had to make do with jobs requiring lower qualifications than they would have liked. There were also intermediate positions of regions with employment rates above the Italian average, but with high percentages of people working below their qualifications, an extreme case was that of Umbria. Some regions had low employment rates and low percentages of people working below their qualifications. (Figure 11.2.10)
Profile of overqualified workers: young graduates working as employees on fixed-term contracts
In Veneto people working below their qualifications tend to be young. Their conditions, however, do change as they grow older. According to estimates for the first three quarters in 2010, in Veneto one third of employed people aged 15 to 24 had jobs that did not require the qualification they had. That was in line with the Italian average of 10% and higher than the 2005 percentage. It was only for over 35s that a significant decrease was found.In terms of formal education, nearly half of graduates aged 15 to 34 had a job for which they did not need a degree, and 37% of people with school-leaving certificates did not need them.
Conditions differ widely depending on the kind of degree or school-leaving certificate. Considering all age brackets, more than six out of ten people with degrees in politics, social sciences or areas typically leading to a career in teaching had jobs for which they did not need a degree. The same applied to five people out of ten with degrees in economics, statistics and science. Graduates who had less trouble finding jobs in line with their qualifications were doctors (7% of people were overqualified in Veneto), chemists (13%) and architects (18%). As for people with school-leaving certificates, people who attended vocational schools had jobs below their qualifications (55%) followed by people who attended lyceums (40%). A total of 30% of people with technical school-leaving certificates had jobs below their qualifications compared to 9% of people with a two- or three-year vocational qualification.
Gender differences needed to be taken into account together with formal education. For people with school-leaving certificates, working below their qualifications was mainly a problem for men, whereas for people with degrees it was mostly a problem for women.
Finally, as for features of employment, the percentage of people working below their qualifications was higher among those who worked as employees or had fixed-term contracts, though in this latter case the longer the contract the lower the percentage. (Table 11.2.5)
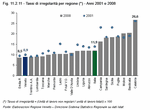
Conditions in the Veneto labour market were not as serious as in the whole of Italy. In 2008 in Italy 12 people out of 100 were undeclared workers (undeclared work rate), while in Veneto the number of undeclared workers was 9 out of 100, the second lowest figure in the regional ranking on a par with Trentino Alto Adige.
The most serious problems were in Southern Italy where undeclared work concerned 18.3% of workers against 8.9% in North East Italy. The worst position was that of Calabria, where over one quarter of workers were undeclared, while Emilia Romagna had the lowest percentage (8.5%).
Compared to the early 2000s, in almost all Italian regions undeclared work is not as common as it used to be and has decreased by nearly two percentage points. Improvements were clear especially in Campania, Lazio and Sicilia, where the percentage of undeclared workers decreased by 6.7%, 4.8% and 4.6% respectively between 2001 and 2008. Even in Veneto the measures taken to solve the problem have been successful and in seven years undeclared work had decreased by 1%. By contrast, there were four regions where undeclared workers increased. In particular, the three regions with the highest percentages of undeclared workers in 2008 showed an increase.
It is clear that in Italy there are regions where undeclared work only tends to provide a small part of incomes, while there are other areas where it plays a major role. (Figure 11.2.11)
The most affected sector is agriculture: at national level, the percentage of undeclared workers is almost one quarter of the total.
At the moment, however, more recent regional data are not available; therefore changes in undeclared work as a consequence of the crisis in the last two years cannot be traced. Still, at national level, in 2009 no dramatic differences compared to 2008 were noted: the percentage of undeclared work increased, but only by 0.3%.
Table 11.2.1

Figure 11.2.1
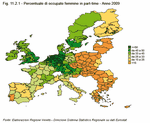
Figure 11.2.2
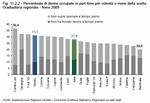
Table 11.2.2

Figure 11.2.3
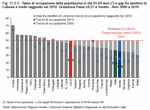
Figure 11.2.4
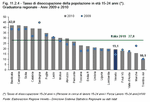
Figure 11.2.5
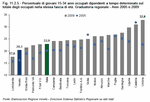
Figure 11.2.6
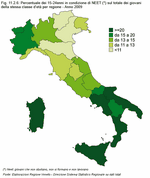
Figure 11.2.7
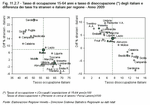
Table 11.2.3

Figure 11.2.8
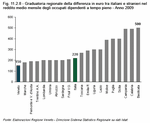
Table 11.2.4

Figure 11.2.9
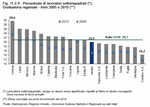
Figure 11.2.10
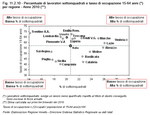
Table 11.2.5

Figure 11.2.11
The aim is a more flexible, inclusive labour market which strikes a right balance between flexibility and security so that flexibility is more sustainable thanks to more effective protection at work and consequent lower vulnerability to risks that can emerge in the market. All this is geared towards making contracts permanent. More flexible work contracts should not be sources of fixed-term employment for a long time, but should rather be regarded as launching pads for work, especially for workers such as youth and women, who are more often at risk of being marginalised.
Jobs that do not provide open-ended work contracts for employees are called atypical jobs. Contracts for these jobs include fixed-term, part-time, intermittent, temporary, employer-coordinated freelance work, including project work, occasional work, apprenticeships and on-the-job training.
Fixed-term contracts: opportunities or loopholes?
Generally speaking, fixed-term work is the main category of atypical job. It is more common among women than men, and especially among young people.In 2009 in Italy about 2.1 million people, or 12.5% of employees, worked on fixed-term contracts. In Veneto they accounted for 176,000 people, 10.7% of employees. Both fixed-term employment rose progressively in Veneto and in Italy for a number of years. Then in 2009, as a consequence of the production crisis, the trend reversed: there were 170,000 fewer people in Italy working on fixed-term contracts and 22,000 fewer in Veneto. This amounted to almost half the decline in employment in 2009: 45% in Italy and 47% in Veneto.
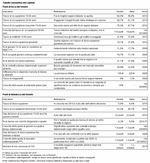
Workers are offered longer-term contracts. In particular, in 2009 in Veneto 30% of fixed-term employees had contracts for over one year compared to 21.4% in 2005. In Italy the percentage was 22.5%, nearly 3 points above the percentage in 2005. Moreover, both in Veneto and in Italy 50% of fixed-term employees had ten-month contracts at least. By contrast, people in Southern Italy are mainly offered short-term contracts. (Table 11.3.1)
The increase in work flexibility is the result of a policy which has tried over time to dismantle an excessively rigid labour market, which in many cases imposed highly restrictive obligations on employers and employees. Increasing contract flexibility, i.e. fixed-term contracts, can be an advantage. As employment costs are lower, employers are encouraged to offer new jobs, thus creating more employment.
In this respect, it is interesting to note that, apart from 2009 when the effects of the crisis were clear, from 2005 to 2008 the general increase in fixed-term employees was matched by a relative decline in long-term unemployment rates, i.e. in the percentage of the labour force looking for a job for over 12 months.
What is important is that fixed-term contracts are used properly by employers, and that they are a real advantage to workers too. However, in some cases in the Italian labour market, these atypical contracts have often been used above all to have labour forces available on a temporary basis and as a result have been a preferable alternative for employers than open-ended contracts. For this reason, especially from young people's perspective, a fixed-term contract is better than staying at home while unemployed as long as it does not turn into a source of long-term job instability and uncertainty about their future.
In view of future job stability, however, it is worth underlining that in 2009 Veneto had the third highest percentage among Italian regions of employees working on open-ended contracts: 89.3%; first came Lombardia with 91% of employees.
Employer-coordinated freelance work and occasional work contracts
Two atypical job contracts are also used: one for employer-coordinated freelance work (known in Italy as 'co.co.co') and one for occasional work (Note 8).Processing data from the ISTAT Labour Force Survey showed that in 2009 in Italy over 395,000 people were employed on one of these contracts. Over 306,000 people worked on employer-coordinated freelance work contracts and 89,000 on occasional work contracts.
Considering workers employed on either of these contracts, the highest percentage (2.9% of all employed persons) was found in Lazio, followed by Abruzzo (2.7%). Veneto, with 1.2%, was one of the regions where these contracts were not so popular.
What emerged quite clearly was that these contracts boomed in the early 2000s and that the labour market reform, as a consequence of the so-called 'Biagi law', profoundly altered norms concerning employer-coordinated freelance work contracts, also because 'project work' was introduced; since 2007, however, the two types of contracts, and especially employer-coordinated freelance work ones, have not been so frequently used. Both in Italy and in Veneto fewer people were employed on either of these contracts between 2005 and 2009, although the overall employment rate had increased. Finally, according to estimates for the first three quarters in 2010, use of the two contracts increased slightly and in Veneto work on employer-coordinated freelance contracts grew by 23% on the previous year.
As with fixed-term contracts, employer-coordinated freelance work contracts and occasional work contracts were more common among women and young people, especially graduates. Contracts also tended to be longer than they used to. (Table 11.3.2)
As is the case with fixed-term employment, these contracts, if they are used properly, can be regarded as one more opportunity to enter and remain in the labour market instead of being unemployed. It is important, however, that employment on this basis does not extend over such long periods of time that it becomes unsustainable, especially for young people who want to leave their homes, lead independent lives and form families.
Finally, as for changes in the use of short-term contracts, which are important ways to increase participation and employment and a means to strike a balance between professional life and personal and family commitments, readers are referred to the section on the employment of women.
The green economy is not an emerging industry, but rather a new market model which involves innovation in production processes and new products. It is also a new lifestyle which will change people's habits and will also improve their quality of life.
The European Union is promoting a new model of economic development. With its Europe 2020 Strategy it aims to lead EU countries to overcome the crisis by promoting a more resource-efficient, competitive and greener economy.
However, there is no satisfactory and shared definition of green economy. The term covers areas such as energy efficiency, production and distribution of renewable energy, sustainable transport, organic farming, soil protection, promotion of water, protected areas and sustainable tourism, and integrated management of municipal waste. It also includes companies using resources and smart technology efficiently, complying with regulations on emission and consumption reduction.
It is quite clear how the green economy influences the labour market. A transition towards a new economy creates new jobs and professions, changes already existing ones and displaces other ones. This is how green jobs originate; they are new professions that can contribute to promote and protect the environment. People in these new professions have or will have suitable competencies to meet the requirements of sustainable development. In the renewable energy sector alone, EU projections suggest that one million new jobs will be created in the next decade.
It is worth underlining that workers can be green even if they do not work in green sectors. For this reason, it is difficult to estimate their actual number accurately. Moreover, current classifications of sectors and professions cannot cover these jobs yet.
Although there is a worrying lack of shared definitions for green jobs and the green economy, with ensuing problems of classification, figures help to outline the changes currently underway.
Italian potential
At national level, a major source of data is research department Ifolamb, part of the Isfol information system for professional training and guidance in the environmental protection sector.By using data from ISTAT's Labour Force Survey, Isfol extracted the professions that are strictly connected with environmental protection and divided them into eight macro-areas: waste, renewable energies and energy saving, workplace and environment health and safety, green tourism, water, forest resources and soil protection, urban planning, basic and applied research, and finally environmental protection, control and clean-up.
According to Isfol, in Italy green laboratories are mainly used in agricultural and forest resources (36% of the total), waste (24%) and green tourism (14.5%). In the last fifteen years the number of employed persons has increased (+41%), but what they do has also changed. There are now more people working in de-pollution, up from 3% in 1993 to 8% in 2008, and in green tourism, up from 4% to 14%, while there are fewer people in health and safety, and waste management.
Green jobs are typically male jobs. Three green workers out of four are male, though female workers are constantly growing in number. Women play an important role especially in green tourism.
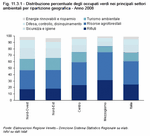
Work breakdown varies across Italy. In Southern Italy agricultural and forest resources account for 43% of green workers, against as little as 29% in the North East; in the North West green workers are used in greater numbers in tourism, health and safety, and de-pollution. Data relating to renewable energy and energy saving are also interesting. In the North East of Italy, 6% of green workers were employed in these sectors. This is 3% more than a decade before and higher than in other sectors. (Figure 11.3.1)
Veneto's potential
Veneto's companies are slowly going economically green. According to the Green Economy Index (GEI) developed by small business research institute Fondazione Impresa, which estimates the sustainability of Italian regions and how 'green' they are, Veneto is among the greenest regions in Italy. Trentino Alto Adige ranks first. Considering the importance of the green economy in Veneto, a method was developed for ad hoc analysis based on available ISTAT data. To begin with, the literature was searched for existing criteria to identify green sectors and professions. Two studies were used as starting points, which were then reworked and supplemented to estimate green jobs in Veneto.To identify the green sectors, the model by regional chamber of commerce association Unioncamere was followed; this model had been used in the Green Italy survey (Note 9) to identify sectors that were green in the narrow sense. At a later stage, these sectors were combined with energy-related activities, energy efficiency, water treatment and waste management (Note 10).
Green sectors and their employees were identified and divided into four macro-areas: pollution management, clean technologies and products, resource management, and sustainable energy.
Green professions were then identified starting from an empirical study by Italy's Institute for Economic and Social Research (IRES) (Note 11) carried out on a group of experts in renewable energy sources. Interviews allowed researchers to outline green professions associated with existing job profiles which could become green with suitable training in the sector.
Professions identified on the basis of the IRES study were only in the energy sector. They were then combined with other professions in the control and safeguard of environmental quality.
Finally, cross-referencing the economic sector and profession yielded an estimate of green jobs in Veneto. This is an overestimate of the actual number of green workers and has to be regarded as an estimate of the green job potential in Veneto. Although the absolute values are to be treated with due caution, they are still useful for analysing the 'green potential' of Veneto's provinces and of some segments of the population, also over time.
Note that unfortunately this analysis was not able to include the green professions linked to the agriculture and forestry industry, in particular those working in the agriculture, fishing and sustainable forest sectors, as it was impossible to extrapolate them from the wider primary sector. We should now look at some primary sector figures: in 2010 Veneto had 68,000 people working in the primary sector, 3.2% of its total employed; they accounted for 8% in the province of Rovigo.
Estimated figures reveal that between 2005 and 2009, the number of green sector employees in Veneto rose by almost 5%. Its composition changed slightly: in four years, the number of employees in the pollution management and resources management sectors rose in particular, to the detriment of employees in clean products and technologies. The pollution management sector remains the largest and in 2009 it accounted for 57.6% of employees in Veneto's green sector. Looking in more detail, this sector includes air-pollution control, sewage treatment, solid waste management and land reclamation. Next comes the energy sector, which accounts for almost one quarter of the green sector employees (Note 12).
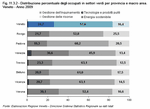
Figures for the provinces are also interesting: Venezia has the highest proportion of green sector employees, 37%, which is higher than the regional average, followed by Verona (30%); Treviso and Vicenza seem to be more involved in pollution management. Padova and Rovigo, however, are involved in resource management (recycling, water supply and treatment, and energy saving). (Figure 11.3.2)
If we look at the professions, figures reveal that almost one out of five Veneto employees was, or was potentially a green professional in 2009 (Note 13). This is a growing phenomenon: green professionals rose by almost 10% between 2005 and 2009 and, according to initial estimates, figures are destined to grow by a further 4% in 2010%. As regards the provinces, Treviso has the highest potential (24% of the province's total employees), followed by Belluno (22%) and Padova (21%). Venezia is bottom with 16%.
By cross-referencing green sector employees with green, or potentially green professions, we obtain an estimate of the number of employees who work directly or indirectly with the environment and who work in the green sector. It is estimated that overall Veneto has almost 109,000 green employees (excluding the primary sector), up more than 8% on 2005 and more than 5% of the total number of employees. The highest proportion of green jobs in 2009 was found in Belluno, which had 7.8%; then came Padova with 7%, which was also its highest growth since 2005. (Figure 11.3.3)
In line with the national figures from the Isfol report, green employees are almost exclusively men and in 2009 accounted for 8.5% of male employees, up 0.7% on 2005. Furthermore, these new professions are most common among young people: 6.4% of 15-to-29-year-olds and 5.5% of 30-to-39-year-olds work for the sustainable economy compared to 4.6% of the over 40s; this is a sign of the openness of the Veneto labour market and of its determination to create an increasingly sustainable economic system.
(Table 11.3.4)

