-
Statistical department’s site
Home page
Our publications
Chapter 4
Research and innovation for responsible development
"The Stone Age didn't end because we ran out of stones, the Iron Age because we ran out of iron [...]. They ended because humans came up with something new, something better [...]" wrote Indian economist Indur Goklany (Note 1). The history of humanity has always been marked by progress, innovation that has changed every feature of society, from population trends to economic cycles and culture.
At this point in history, innovation is a key strategy that will launch mature economies towards a recovery so that they can leave behind the difficult times that have marred investments and competitiveness once and for all. In order to launch a new cycle of growth, however, it is vital that innovation policies are based on sustainability; they must be supported by adequate resources that have been designed to last long-term. In the Europe 2020 Strategy, 'smart growth' promotes knowledge and innovation as the driving forces behind future growth. The EU promotes innovation and knowledge transfer throughout Europe, the optimal use of Information and Communication Technologies (ICT), and the transformation of innovative ideas into new products and services. It is well-known that to face future challenges, such as energy efficiency and population changes, today's society will have to invest more in research and innovation so that it can ensure a more efficient and sustainable future, both for society and the planet.
At this point in history, innovation is a key strategy that will launch mature economies towards a recovery so that they can leave behind the difficult times that have marred investments and competitiveness once and for all. In order to launch a new cycle of growth, however, it is vital that innovation policies are based on sustainability; they must be supported by adequate resources that have been designed to last long-term. In the Europe 2020 Strategy, 'smart growth' promotes knowledge and innovation as the driving forces behind future growth. The EU promotes innovation and knowledge transfer throughout Europe, the optimal use of Information and Communication Technologies (ICT), and the transformation of innovative ideas into new products and services. It is well-known that to face future challenges, such as energy efficiency and population changes, today's society will have to invest more in research and innovation so that it can ensure a more efficient and sustainable future, both for society and the planet.
One of the objectives proposed in the Europe 2020 Strategy to achieve smart growth is that 3% of the EU's GDP be invested in research and development (R&D). EU27 expenditure on R&D was equal to 2% of its GDP in 2009, a slight increase on the previous year. This not very robust trend was led by the performance of several countries in Northern Europe; Finland, Sweden and Denmark, strengthened by their significant presence in high-technology industries, have already achieved the threshold of 3% set as the target for 2020. For Italy, the draft of the National Reform Programme has set a target of 1.53% to be achieved by 2020. In 2009 the expenditure on R&D as a portion of GDP in Italy was equal to 1.27%, while for Veneto it was 1.05% in 2008, a figure lower than the national level, but one that had nearly doubled over the last 3 years.
EU investments, however, are still lower than the US and Japan, which spent 2.8% and 3.4% respectively of their GDP on R&D in the last year.
Currently China also spends about 1.4% of its GDP on R&D and, by the next decade, predicts the US's prestigious Georgia Institute of Technology, will overtake the US in its capacity to transform research into goods and services. China is already second only to the US in terms of scientific publications (120,000 articles versus 350,000) and has more students (25 million) registered at institutes and universities than any other country. Furthermore it has as many researchers as the US, 1.4 million, and its expenditure on research has increased annually by 18%, on average, in the last 10 years (Note 2).
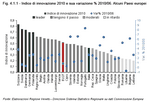
The Innovation Union Scoreboard 2010 was published on 1st February 2011; this is a comparative assessment of the Innovation Index of the EU27 countries and their main international competitors, including not only the US and Japan, but also China and Brazil. The aim of this tool is to monitor the development and implementation of the Europe 2020 Innovation Union flagship initiative in the various Member States and identify the relative strengths and weaknesses of their research and innovation systems. The Innovation Union Scoreboard is based on 25 indicators grouped into 3 main categories: "Enablers", i.e. the basic building blocks which allow innovation to take place (human resources, finance and support, open, excellent and attractive research systems); "Firm activities" which show how innovative Europe's firms are (firm investments, linkages & entrepreneurship, intellectual assets); and "Outputs" which show how this translates into benefits for the economy as a whole (innovators, economic effects).
On the basis of the results (Note 3) European countries are put into the following four groups based on their approach to innovation:
Comparing the indicators for EU27, the US and Japan, it is apparent that the EU cannot bridge the gap between its innovation performance and that of its main competitors.
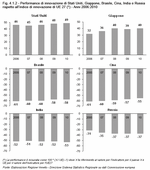
The report cited includes a summary indicator to compare the EU's innovation performance with that of its main competitors (Note 4) and the results can be seen in the following graphs. The values in the graphs indicate, as a percentage, how much a country's innovation performance is better (if positive) or worse (if negative) compared to the entire EU27. For example in 2010 the US held a 49% performance lead over EU27, Japan 40%. The EU27 as a whole was holding its lead over India and Russia, but was losing ground to Brazil and above all China, whose deficit in terms of performance is quickly narrowing. (Figure 4.1.2)
The greatest differences between the EU and the US lie in Public-private co-publications and Business R&D expenditure. With respect to Japan the main difference lies in Patents. These data seem to suggest that Europe's shortcomings in innovation are mainly due to the private sector.
The gap is particularly wide and rapidly increasing as regards Licence and patent revenues from abroad. This is a key indicator of economic dynamism and highlights that improvements must be made in the EU's economic model and the workings of the protected internal market for knowledge. It also shows that the EU produces fewer high impact patents (which generate significant revenues from third countries) than the US and Japan, and that it does not reach a high enough position in the sectors of high global growth. Yet in the last five years the greatest growth in the EU27's innovation indicators was in the Open, Excellent, Attractive Research Systems (international scientific co-publications, high impact publications, non-EU doctorate students) and Intellectual Assets (Patent Cooperation Treaty (PCT) applications, community trademarks, community designs).
Though still noteworthy, the gap regarding the population completing tertiary education is getting smaller, and this number in the EU is growing considerably.
EU27, however, performs better than the US in terms of public R&D expenditure and Knowledge-Intensive Services exports.
Reading the individual indicators in the Report helps to clarify Italy's position which is, on the whole, mediocre. However, not all of Italy's values are below the EU average. While Italian universities are not attracting non-EU doctorate students, there are 14% more new doctorate graduates than the European average. Italy does not appear in the Top 10% most cited scientific publications worldwide, but it is 56% above the European average of International scientific co-publications. R&D expenditure is lower than the EU average, but SMEs innovating in-house is 12% above the EU average. Italian PCT applications are not high but Community trademarks and designs presented in relation to GDP are 44% above average. To conclude, we can state that there is no lack of innovation, but it is a type of innovation which lies in the country's economic tradition. On the one hand is innovation that leads to greater efficiency in production processes, on the other is innovation in the typical sectors of the Italian system, such as design and creativity.
There is little investment in the hydroelectricity sector and little scope for future developments, and the geothermal sector is only present on small local rather than global levels. The greatest investment is in solar energy, particularly to increase the daily productivity of panels. Wind is stable, with the greatest investments in Germany, the UK, and Denmark where off-shore wind farms are spreading. Italy is concentrating on solar energy, while it is interesting to observe Spain's performance as it is focusing on the creation of renewable energy plants, but is leaving leadership in the development phase to other countries. (Figure 4.1.4)
When talking about sustainability and innovation it is also important to ask what is being done to reduce the problem at the source. It is not only the investments to obtain clean energy which need to be analysed, but also investments aimed at reducing energy use and making it more efficient.
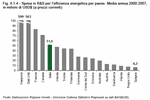
Here again, the US and Japan are leaders. The difference between the EU and the two leading countries is even clearer here. Japan's investment between 2000 and 2007 was six times that of France, the third-ranking country in terms of expenditure. In these rankings Italy's performance is good, and it stands among the top five countries. Investment in smart meters by ENEL, Italy's largest power company, certainly contributed to this result, making Italy the country with the most widespread use of smart meters in the world.
EU investments, however, are still lower than the US and Japan, which spent 2.8% and 3.4% respectively of their GDP on R&D in the last year.
Currently China also spends about 1.4% of its GDP on R&D and, by the next decade, predicts the US's prestigious Georgia Institute of Technology, will overtake the US in its capacity to transform research into goods and services. China is already second only to the US in terms of scientific publications (120,000 articles versus 350,000) and has more students (25 million) registered at institutes and universities than any other country. Furthermore it has as many researchers as the US, 1.4 million, and its expenditure on research has increased annually by 18%, on average, in the last 10 years (Note 2).
The Innovation Union Scoreboard 2010 was published on 1st February 2011; this is a comparative assessment of the Innovation Index of the EU27 countries and their main international competitors, including not only the US and Japan, but also China and Brazil. The aim of this tool is to monitor the development and implementation of the Europe 2020 Innovation Union flagship initiative in the various Member States and identify the relative strengths and weaknesses of their research and innovation systems. The Innovation Union Scoreboard is based on 25 indicators grouped into 3 main categories: "Enablers", i.e. the basic building blocks which allow innovation to take place (human resources, finance and support, open, excellent and attractive research systems); "Firm activities" which show how innovative Europe's firms are (firm investments, linkages & entrepreneurship, intellectual assets); and "Outputs" which show how this translates into benefits for the economy as a whole (innovators, economic effects).
On the basis of the results (Note 3) European countries are put into the following four groups based on their approach to innovation:
- Innovation Leaders: Denmark, Finland, Germany, Sweden all show a performance well above that of the EU27 average.
- Innovation Followers: Austria, Belgium, Cyprus, Estonia, France, Ireland, Luxembourg, Netherlands, Slovenia and the UK all show a performance close to that of the EU27 average.
- Moderate innovators: the performance of the Czech Republic, Greece, Hungary, Italy, Malta, Poland, Portugal, Slovakia and Spain is below that of the EU27 average.
- Modest Innovators: the performance of Bulgaria, Latvia, Lithuania and Romania is well below that of the EU27 average.
Comparing the indicators for EU27, the US and Japan, it is apparent that the EU cannot bridge the gap between its innovation performance and that of its main competitors.
The report cited includes a summary indicator to compare the EU's innovation performance with that of its main competitors (Note 4) and the results can be seen in the following graphs. The values in the graphs indicate, as a percentage, how much a country's innovation performance is better (if positive) or worse (if negative) compared to the entire EU27. For example in 2010 the US held a 49% performance lead over EU27, Japan 40%. The EU27 as a whole was holding its lead over India and Russia, but was losing ground to Brazil and above all China, whose deficit in terms of performance is quickly narrowing. (Figure 4.1.2)
The greatest differences between the EU and the US lie in Public-private co-publications and Business R&D expenditure. With respect to Japan the main difference lies in Patents. These data seem to suggest that Europe's shortcomings in innovation are mainly due to the private sector.
The gap is particularly wide and rapidly increasing as regards Licence and patent revenues from abroad. This is a key indicator of economic dynamism and highlights that improvements must be made in the EU's economic model and the workings of the protected internal market for knowledge. It also shows that the EU produces fewer high impact patents (which generate significant revenues from third countries) than the US and Japan, and that it does not reach a high enough position in the sectors of high global growth. Yet in the last five years the greatest growth in the EU27's innovation indicators was in the Open, Excellent, Attractive Research Systems (international scientific co-publications, high impact publications, non-EU doctorate students) and Intellectual Assets (Patent Cooperation Treaty (PCT) applications, community trademarks, community designs).
Though still noteworthy, the gap regarding the population completing tertiary education is getting smaller, and this number in the EU is growing considerably.
EU27, however, performs better than the US in terms of public R&D expenditure and Knowledge-Intensive Services exports.
Reading the individual indicators in the Report helps to clarify Italy's position which is, on the whole, mediocre. However, not all of Italy's values are below the EU average. While Italian universities are not attracting non-EU doctorate students, there are 14% more new doctorate graduates than the European average. Italy does not appear in the Top 10% most cited scientific publications worldwide, but it is 56% above the European average of International scientific co-publications. R&D expenditure is lower than the EU average, but SMEs innovating in-house is 12% above the EU average. Italian PCT applications are not high but Community trademarks and designs presented in relation to GDP are 44% above average. To conclude, we can state that there is no lack of innovation, but it is a type of innovation which lies in the country's economic tradition. On the one hand is innovation that leads to greater efficiency in production processes, on the other is innovation in the typical sectors of the Italian system, such as design and creativity.
Research in the "green" sector (Note 5)
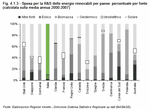
An analysis of R&D expenditure on renewable energy alone reveals that each country has its own characteristics and specialisations. Italy is focusing strongly on R&D in renewable energy with a total expenditure of nearly 70 million dollars of annual investment. This ranks Italy fourth worldwide, after the United States, Japan, and Germany, world leaders in the field. Italy and Germany have clearly aimed at solar energy, the United Kingdom and Denmark on wind power, Sweden and Finland on biomass, while countries like Spain and the US are trying to keep a more varied range of investments to respond to the opportunities their countries offer. (Figure 4.1.3)There is little investment in the hydroelectricity sector and little scope for future developments, and the geothermal sector is only present on small local rather than global levels. The greatest investment is in solar energy, particularly to increase the daily productivity of panels. Wind is stable, with the greatest investments in Germany, the UK, and Denmark where off-shore wind farms are spreading. Italy is concentrating on solar energy, while it is interesting to observe Spain's performance as it is focusing on the creation of renewable energy plants, but is leaving leadership in the development phase to other countries. (Figure 4.1.4)
When talking about sustainability and innovation it is also important to ask what is being done to reduce the problem at the source. It is not only the investments to obtain clean energy which need to be analysed, but also investments aimed at reducing energy use and making it more efficient.
Here again, the US and Japan are leaders. The difference between the EU and the two leading countries is even clearer here. Japan's investment between 2000 and 2007 was six times that of France, the third-ranking country in terms of expenditure. In these rankings Italy's performance is good, and it stands among the top five countries. Investment in smart meters by ENEL, Italy's largest power company, certainly contributed to this result, making Italy the country with the most widespread use of smart meters in the world.
In 2008, Veneto's expenditure on Research and Development amounted to 1,542 million euro, which placed it in fifth place in Italy's regional rankings behind Lombardia, Lazio, Piemonte and Emilia Romagna. Veneto's R&D expenditure, however, did increase by 24.1% on 2007 compared to a national growth of 5.9%. The annual increase of Veneto's expenditure is second only to that of Valle D'Aosta, whose absolute values are, however, much lower. Widespread investment in R&D, even by Small and Medium-sized Enterprises (SMEs), contributed to an increase in overall R&D expenditure, especially in situations where SMEs were at the heart of Veneto's production industry; the highly promising trend in Veneto's overall expenditure was indeed fuelled by the major contribution of its business activity, which grew by 36.4% in the last year. (Table 4.2.1) and (Figure 4.2.1)
This sharp rise in enterprise investment has brought Veneto closer to the other Lisbon Strategy objective: the condition that two thirds of the expenditure be sustained by businesses. Indeed, Veneto businesses invested 64.6% of total R&D spending in 2008. Universities follow with a 25.1% share of the expenditure and public and private institutions and NGOs the remaining 10.2%. Distribution of R&D workers by institution is similar: 66.2% of research workers (calculated as the full-time equivalent) are employed by Veneto businesses, 25.3% by universities and the remaining 8.5% by public administrations and non-profit organisations. There are 23,884 research workers in Veneto, 4.9 for every 1,000 inhabitants compared to the national average of 4. (Figure 4.2.2)
Veneto's total R&D expenditure in 2008 was 1.05% of the regional GDP, lower than the national figure, 1.23% in 2008 and 1.27% in 2009. If we focus on the performance of this indicator in recent years, Veneto is the Italian region which has recorded the greatest annual growth, with more than half a percentage point of the GDP from 2000 to 2008. R&D expenditure in Veneto has indeed more than doubled in these 8 years, going from 0.51% to 1.05% of GDP, while growth on a national level in the same timeframe was 17.7%. (Figure 4.2.3) and (Figure 4.2.4)
Enterprises both from Veneto and outside which invest most, over seven tenths of R&D expenditure, are those in the manufacturing sector, followed by those in trade, i.e. retail and wholesale. It may seem odd that trade businesses are interested in R&D, i.e. not just innovation but "the creative work undertaken systematically to increase knowledge, including knowledge of humanity, culture and society, and the use of knowledge for new applications" (Note 6). In actual fact, almost 15% of R&D expenditure is carried out by enterprises classified as being in trade since they engage in both production and distribution, but since their turnover is higher for the latter, they are classified as trade. Other relevant economic categories include information and communication services and professional, scientific and technical activity. (Figure 4.2.7) and (Figure 4.2.8)
We have looked more closely at R&D in the manufacturing sector since it is the most interested in improving its technological content to keep its competitive advantage.
A total of 26.7% of R&D expenditure in this sector comes from mechanical companies, followed by the textile, clothes, leather and accessories sector, optics and electronics, chemicals-rubber-plastics, and metals, with expenditures which range from 11.1% to nearly 15%. There are also traditional Veneto activities, such as the jewellery, wood and furniture, sports items and food industries.
With the globalisation of goods, it is the rate of technological innovation which determines the competitiveness of products, processes and companies. On the one hand this leads to the growing introduction of intangible resources in the supply chain of traditional sectors, and on the other to manufacturing specialisations in advanced countries moving to more hi-tech sectors.
Even more important than the economic sector of businesses carrying out research in Veneto is understanding the type of products or services the research and experimentation concentrate on. Over 90% of companies prefer not to disperse this type of activity but concentrate on a single group of products, and these account for 90% of the total R&D expenditure in Veneto.
Of the total spent on developing or improving products or production processes (Note 7) 12.3% is spent on products in the pharmaceutical industry, 7.4% on textiles, 6.4% on electrical goods, 4.9% on machines for general use, 4.6% on packaging, 4.1% on the food industry, 4.0% on chemicals, 3.7% on metallurgy, and 3.5% on products, services and processes related to the distribution of electricity, gas and water. The other industries with lower percentages of investment are Veneto's traditional manufacturing industries, but this shows that even the traditional sectors, considered by many to have "mature technology", are carrying out research and development in order to make continuously evolving and improved products.
Amongst services, 2.4% of expenditure goes on the development or improvement of software, IT consultancy and related activities, 2.1% on development or improvement of any other service offered to companies or families and related technology, and 2.0% on products, services and processes related to financial and insurance services. (Figure 4.2.9)
Research workers in Veneto make up the equivalent of nearly 16,000 full-time workers and over 90% are employed by Veneto companies. Nearly 82% are male and over 78% are doing research for manufacturing industries.
A total of 51.1% of investments come from companies with a turnover of over 50 million euro, 25.5% from companies with turnover of between 10 and 50 million euro, and 10.4% from those with turnovers of between 5 and 10 million euro. (Figure 4.2.10)
A total of 98% of expenditure by Veneto companies comes from corporations and from ones with more than 250 employees. Clearly the amount of investment is proportional to size and turnover, but we cannot fail to mention that 85% of Veneto companies investing in R&D belong to the category of Small and Medium-sized Enterprises (Note 8). (Figure 4.2.11)
In 2008 Veneto companies invested over 50 million euro in the energy sector, that is nearly 6% of total R&D expenditure. The largest sum was spent on research into energy efficiency (nearly 20 million euro), renewable energy sources (nearly 10 million euro) and technology for the conversion, transmission, distribution and storage of energy (over 6 million euro).
Research into biotechnology and nanotechnology, however, is still a niche sector in Veneto. Nearly 6 million euro was spent in 2008 on research into biotechnology (mainly on the use of cells and tissues and engineering of application processes in the biotechnology field) and the same amount on nanotechnology, above all on its application in the medical-health and life sciences sectors, and on nanomaterials.
The data mentioned until now regard intra-muros research, that is carried out directly by the companies in their own facilities and with their own staff. Besides this, Veneto companies spend about 68 million euro on research which is outsourced (extra-muros expenditure). It is mainly other Italian companies, 49%, which are involved in extra-muros expenditure; 16% is accounted for by Italian companies of the same group, 9.7% by foreign companies, 9.3% by Italian research centres and private laboratories, and 7.5% by foreign companies of the same group. It is surprising that only 6.9% of enterprises' extra-muros expenditure goes to universities and 1.4% to research centres, laboratories or public institutions (e.g. Italy's National Research Council (CNR), or National Agency for New Technologies, Energy and Sustainable Economic Development (ENEA) etc.).
This sharp rise in enterprise investment has brought Veneto closer to the other Lisbon Strategy objective: the condition that two thirds of the expenditure be sustained by businesses. Indeed, Veneto businesses invested 64.6% of total R&D spending in 2008. Universities follow with a 25.1% share of the expenditure and public and private institutions and NGOs the remaining 10.2%. Distribution of R&D workers by institution is similar: 66.2% of research workers (calculated as the full-time equivalent) are employed by Veneto businesses, 25.3% by universities and the remaining 8.5% by public administrations and non-profit organisations. There are 23,884 research workers in Veneto, 4.9 for every 1,000 inhabitants compared to the national average of 4. (Figure 4.2.2)
Veneto's total R&D expenditure in 2008 was 1.05% of the regional GDP, lower than the national figure, 1.23% in 2008 and 1.27% in 2009. If we focus on the performance of this indicator in recent years, Veneto is the Italian region which has recorded the greatest annual growth, with more than half a percentage point of the GDP from 2000 to 2008. R&D expenditure in Veneto has indeed more than doubled in these 8 years, going from 0.51% to 1.05% of GDP, while growth on a national level in the same timeframe was 17.7%. (Figure 4.2.3) and (Figure 4.2.4)
Enterprises which invest in Veneto
A total of 87.3% of all business expenditure in Veneto, which comes to almost 1 billion euro, stems from enterprises with registered offices in the region, and 12.7% from enterprises registered outside it, but which carry out research at production units in Veneto. Over half of business R&D investments from outside Veneto are from enterprises in Central and Southern Italy, probably because head offices of large groups are concentrated in the capital, while one third of expenditure is by enterprises with head office in the North West, mainly in Lombardia. (Figure 4.2.5) and (Figure 4.2.6)Enterprises both from Veneto and outside which invest most, over seven tenths of R&D expenditure, are those in the manufacturing sector, followed by those in trade, i.e. retail and wholesale. It may seem odd that trade businesses are interested in R&D, i.e. not just innovation but "the creative work undertaken systematically to increase knowledge, including knowledge of humanity, culture and society, and the use of knowledge for new applications" (Note 6). In actual fact, almost 15% of R&D expenditure is carried out by enterprises classified as being in trade since they engage in both production and distribution, but since their turnover is higher for the latter, they are classified as trade. Other relevant economic categories include information and communication services and professional, scientific and technical activity. (Figure 4.2.7) and (Figure 4.2.8)
We have looked more closely at R&D in the manufacturing sector since it is the most interested in improving its technological content to keep its competitive advantage.
A total of 26.7% of R&D expenditure in this sector comes from mechanical companies, followed by the textile, clothes, leather and accessories sector, optics and electronics, chemicals-rubber-plastics, and metals, with expenditures which range from 11.1% to nearly 15%. There are also traditional Veneto activities, such as the jewellery, wood and furniture, sports items and food industries.
With the globalisation of goods, it is the rate of technological innovation which determines the competitiveness of products, processes and companies. On the one hand this leads to the growing introduction of intangible resources in the supply chain of traditional sectors, and on the other to manufacturing specialisations in advanced countries moving to more hi-tech sectors.
Even more important than the economic sector of businesses carrying out research in Veneto is understanding the type of products or services the research and experimentation concentrate on. Over 90% of companies prefer not to disperse this type of activity but concentrate on a single group of products, and these account for 90% of the total R&D expenditure in Veneto.
Of the total spent on developing or improving products or production processes (Note 7) 12.3% is spent on products in the pharmaceutical industry, 7.4% on textiles, 6.4% on electrical goods, 4.9% on machines for general use, 4.6% on packaging, 4.1% on the food industry, 4.0% on chemicals, 3.7% on metallurgy, and 3.5% on products, services and processes related to the distribution of electricity, gas and water. The other industries with lower percentages of investment are Veneto's traditional manufacturing industries, but this shows that even the traditional sectors, considered by many to have "mature technology", are carrying out research and development in order to make continuously evolving and improved products.
Amongst services, 2.4% of expenditure goes on the development or improvement of software, IT consultancy and related activities, 2.1% on development or improvement of any other service offered to companies or families and related technology, and 2.0% on products, services and processes related to financial and insurance services. (Figure 4.2.9)
Research workers in Veneto make up the equivalent of nearly 16,000 full-time workers and over 90% are employed by Veneto companies. Nearly 82% are male and over 78% are doing research for manufacturing industries.
An identikit of a Veneto company which carries out research
In 2008 companies with registered offices in Veneto invested 910 million euro in R&D, over 870 million of which in Veneto itself.A total of 51.1% of investments come from companies with a turnover of over 50 million euro, 25.5% from companies with turnover of between 10 and 50 million euro, and 10.4% from those with turnovers of between 5 and 10 million euro. (Figure 4.2.10)
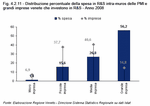
A total of 98% of expenditure by Veneto companies comes from corporations and from ones with more than 250 employees. Clearly the amount of investment is proportional to size and turnover, but we cannot fail to mention that 85% of Veneto companies investing in R&D belong to the category of Small and Medium-sized Enterprises (Note 8). (Figure 4.2.11)
In 2008 Veneto companies invested over 50 million euro in the energy sector, that is nearly 6% of total R&D expenditure. The largest sum was spent on research into energy efficiency (nearly 20 million euro), renewable energy sources (nearly 10 million euro) and technology for the conversion, transmission, distribution and storage of energy (over 6 million euro).
Research into biotechnology and nanotechnology, however, is still a niche sector in Veneto. Nearly 6 million euro was spent in 2008 on research into biotechnology (mainly on the use of cells and tissues and engineering of application processes in the biotechnology field) and the same amount on nanotechnology, above all on its application in the medical-health and life sciences sectors, and on nanomaterials.
The data mentioned until now regard intra-muros research, that is carried out directly by the companies in their own facilities and with their own staff. Besides this, Veneto companies spend about 68 million euro on research which is outsourced (extra-muros expenditure). It is mainly other Italian companies, 49%, which are involved in extra-muros expenditure; 16% is accounted for by Italian companies of the same group, 9.7% by foreign companies, 9.3% by Italian research centres and private laboratories, and 7.5% by foreign companies of the same group. It is surprising that only 6.9% of enterprises' extra-muros expenditure goes to universities and 1.4% to research centres, laboratories or public institutions (e.g. Italy's National Research Council (CNR), or National Agency for New Technologies, Energy and Sustainable Economic Development (ENEA) etc.).
Table 4.2.1

Figure 4.2.1

Figure 4.2.2

Figure 4.2.3
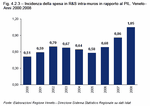
Figure 4.2.4
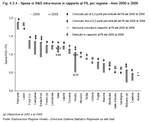
Figure 4.2.5

Figure 4.2.6

Figure 4.2.7

Figure 4.2.8

Figure 4.2.9
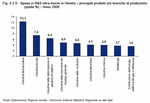
Figure 4.2.10

Figure 4.2.11
Patent intensity is a key indicator of innovation. This monitors the number of inventions, the level of knowledge sharing in technology areas and the level of internationalisation of innovative activity in countries, regions, technologies, enterprises, etc. The importance of patents was underlined by the president of the European Patent Office, Benoit Battistelli: "Patents play a key role in providing information about existing technologies, the level of their development and geographic spread".
In short, the main advantages derived from analysing this indicator are that patents have a strong link with invention and they cover a broad range of technologies on which there are no other data sources. Yet it is important to bear in mind that the distribution of the value of patents is distorted: a lot of patents do not have industrial applications, consequently they are of little value to society; inventions are often not patented because they cannot be or because their inventors have other ways of protecting the secrets of their inventions; and the propensity to patent differs considerably between countries and industry sectors.
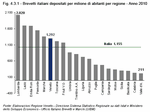
With 6,348 patent applications in 2010, Veneto has 9.1% of the national total and ranks fifth of all the regions for patent applications. A total of 1,292 patent applications were made per one million inhabitants in 2010 (1,155 in Italy) and 13.9 patents for every 1,000 enterprises (13.2 in Italy). (Figure 4.3.1)
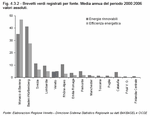
On a European level we looked at data on the number of patent applications from 2000-2006 relating the two main areas of the "green economy": renewable energy and energy efficiency. Once again the German regions are absolute leaders with results that are three or four times those of Sweden and Lombardia, and ten times that of Veneto. German hegemony is further consolidated if we compare the data with those of 20 EU countries: two regions, Baden Würtemberg and Munich, recorded almost 10% of all European patents for green products between 2000-2006. (Figure 4.3.2)
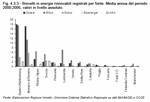
Performance for patents on renewable energies can be divided into the various research areas: solar, waste, wind and bioenergy. Here too, the German regions are at the cutting edge. Italian regions have a median position compared to the reference sample, and it is concentrated on patent applications for the re-use of waste in energy production. Lombardia is the best performing region in Italy, while Veneto's position is good even though it confirms the need to strengthen research activity if the aim is to compete with the main European regions. (Figure 4.3.3)
Over the last few years, the drive towards innovation has also involved Italy's Public Administration (PA), which is attempting to slash the red tape involved in public services and processes.
In this context, Italy's new Code for Digital Administration (CAD), approved with Legislative Decree DL no. 235/2010, is based on the premise that digitalising the public administration can lead to efficiency and savings. Article 3, in particular, establishes that citizens and enterprises have the right to request and obtain the use of IT in communication with public administrations and with public service providers; the possibility to present or sign documents and to have clarification or information via Internet has thus become a right for citizens and enterprises and, at the same time, a duty for the public administrations, which will no longer expect people to physically go to the offices. To reward the efforts required to enforce this right and to favour a fast switch to digitalisation, Article 15 declares that savings made by implementing the new CAD will be used for staff incentives and new project funding.
The digitalisation of the Public Administration, which is envisaged for 2012, is not only a move towards reducing administrative costs and to enhancing public sector efficiency, but is also a means for social inclusion and spreading technology in order to develop the entire country. The spread of Information and Communication Technology (ICT) allows citizens to overcome some barriers in dealing with public administrations, for instance saving time by using online services or simply requesting information. But the most important result is including weaker citizens, such as people with disabilities, in the country's social life. Yet citizens who are not familiar with technology and Internet need to be supported if we are to prevent the spread of these new tools becoming a barrier to access rather than an aid.
A new digital administration can thus act as a driving force for the digitalisation of families and enterprises: sustainable development in this period of economic crisis cannot be achieved without increasing competences and citizens' online literacy. Among the initiatives of the Europe 2020 Strategy is the Digital Agenda for Europe, which aims to guarantee everyone access to broadband by 2013 and ensure that 50% of European families have a high speed broadband connection. Only by training people to use new technologies can Italy keep up with the development of other European countries.
Basic IT facilities are today commonplace at all levels of Italy's Public Administration: Regions, Provinces, Municipalities and Mountain Communities. In 2009, almost 100% were equipped with Internet, 98% had an email system and 91% had a website. In Veneto the situation is even better: 100% of its administrations had Internet, 99% had email and 98% a website.
The extent of intranets, however, which allow for a faster and more direct information exchange within administrations, is more variable. On a national level only 42% of Italian public structures have a local network, but this varies from 41% of Municipalities to 95% of Regions. The size and complexity of the structure is a discriminating factor; within Municipalities it varies from 33% of those with less than 5,000 inhabitants to 96% among those with more than 60,000. In Veneto not only is the share of administrations with an intranet higher (95%), but the gap between type of body is also less visible. On a local level it goes from 93% of the smaller Municipalities to 100% of larger ones. All in all, Veneto ranks second for regions with Municipalities with local internal networks.
Municipalities offer good levels of online services for paying waste-collection bills and declaring the start of new production businesses (65% and 64% respectively). Not so good, however, are sections on registry office certificates, the one-stop shop for enterprises and the management of specialist medical appointments. Interactivity levels in Veneto are on average higher than the national values, above all when it comes to the council property tax and declaration of new production businesses.
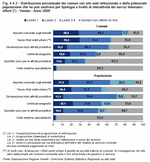
As has already been said, interactivity levels depend on the size of the local authority and it is the larger Municipalities which have more interactive websites. If Municipalities' provision of online services is cross-referenced with their size, the share of Veneto's population which access services through their Municipality's website can be estimated. From this it would appear that nearly 90% of Veneto's residents can obtain information about council tax from their Municipality's website and 26% can submit forms or even make payments online. Furthermore, between 10% and 13% of the population can have access to interactive services regarding registry office certificates, declaration of new production businesses and the one-stop shop for enterprises. (Figure 4.4.2)
In 2010, 55% of Veneto families had access to Internet, a figure above the national average (52%) and in constant growth in recent years: 16% in 2000, 38% in 2005 and 50% in 2009. Furthermore, slightly less than half of Veneto's population say they have used Internet in the last three months (48%), above all for study, work, or finding information on products and services. Apart from these reasons, 28% say they have used it to find information on PA websites, which is slightly lower than the national average (29%) and above all less than many other regions in the North (35% Valle d'Aosta, 34% Friuli Venezia Giulia and Trentino Alto Adige). This percentage declines if we consider the more complex operations: only 19% downloaded forms and 8% sent them after compilation.
In order to meet the objectives of efficiency and cost-cutting, the process of digitalising public services must not forget the citizens. It has to be a shared process, where one should not dash ahead of the other.
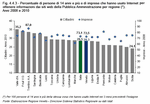
Enterprises' use of ICT however is greater. In 2008 73% of Veneto enterprises used Internet to obtain information from the PA and download forms, while over 40% completed a whole procedure online. Yet in comparison with other reasons Veneto is not doing so well. It comes twelfth in the rankings for regions with enterprises using Internet to communicate with the PA to get information, and sixteenth for completing procedures online. (Figure 4.4.3)
In this context, Italy's new Code for Digital Administration (CAD), approved with Legislative Decree DL no. 235/2010, is based on the premise that digitalising the public administration can lead to efficiency and savings. Article 3, in particular, establishes that citizens and enterprises have the right to request and obtain the use of IT in communication with public administrations and with public service providers; the possibility to present or sign documents and to have clarification or information via Internet has thus become a right for citizens and enterprises and, at the same time, a duty for the public administrations, which will no longer expect people to physically go to the offices. To reward the efforts required to enforce this right and to favour a fast switch to digitalisation, Article 15 declares that savings made by implementing the new CAD will be used for staff incentives and new project funding.
The digitalisation of the Public Administration, which is envisaged for 2012, is not only a move towards reducing administrative costs and to enhancing public sector efficiency, but is also a means for social inclusion and spreading technology in order to develop the entire country. The spread of Information and Communication Technology (ICT) allows citizens to overcome some barriers in dealing with public administrations, for instance saving time by using online services or simply requesting information. But the most important result is including weaker citizens, such as people with disabilities, in the country's social life. Yet citizens who are not familiar with technology and Internet need to be supported if we are to prevent the spread of these new tools becoming a barrier to access rather than an aid.
A new digital administration can thus act as a driving force for the digitalisation of families and enterprises: sustainable development in this period of economic crisis cannot be achieved without increasing competences and citizens' online literacy. Among the initiatives of the Europe 2020 Strategy is the Digital Agenda for Europe, which aims to guarantee everyone access to broadband by 2013 and ensure that 50% of European families have a high speed broadband connection. Only by training people to use new technologies can Italy keep up with the development of other European countries.
More interactive public administrations
Italy's Public Administration is one of Europe's best equipped in terms of ICT. Eurostat has calculated how many of 20 key public services are available completely online for each Member State; in 2010 Italy reached 100% together with Sweden, Portugal, Austria, Ireland and Malta. Furthermore, the changes in the last decade have been extremely positive. In 2001 only 15% of services were available online, in 2004 it was 54.4% and in 2009 68.3%. (Figure 4.4.1)Basic IT facilities are today commonplace at all levels of Italy's Public Administration: Regions, Provinces, Municipalities and Mountain Communities. In 2009, almost 100% were equipped with Internet, 98% had an email system and 91% had a website. In Veneto the situation is even better: 100% of its administrations had Internet, 99% had email and 98% a website.
The extent of intranets, however, which allow for a faster and more direct information exchange within administrations, is more variable. On a national level only 42% of Italian public structures have a local network, but this varies from 41% of Municipalities to 95% of Regions. The size and complexity of the structure is a discriminating factor; within Municipalities it varies from 33% of those with less than 5,000 inhabitants to 96% among those with more than 60,000. In Veneto not only is the share of administrations with an intranet higher (95%), but the gap between type of body is also less visible. On a local level it goes from 93% of the smaller Municipalities to 100% of larger ones. All in all, Veneto ranks second for regions with Municipalities with local internal networks.
Online services: from offer ...
In 2009 in Veneto the most widespread online service was the payment of council property tax. A total of 85% of local authorities have a section of their websites dedicated to this, with different levels of interactivity however. A total of 28% of Municipalities simply provide information (Interactivity Level 1), while 48% also allow people to download the necessary forms (Level 2). The remaining 8% provide higher levels of interactivity, such as online submission of documentation and payment. Municipalities offer good levels of online services for paying waste-collection bills and declaring the start of new production businesses (65% and 64% respectively). Not so good, however, are sections on registry office certificates, the one-stop shop for enterprises and the management of specialist medical appointments. Interactivity levels in Veneto are on average higher than the national values, above all when it comes to the council property tax and declaration of new production businesses.
As has already been said, interactivity levels depend on the size of the local authority and it is the larger Municipalities which have more interactive websites. If Municipalities' provision of online services is cross-referenced with their size, the share of Veneto's population which access services through their Municipality's website can be estimated. From this it would appear that nearly 90% of Veneto's residents can obtain information about council tax from their Municipality's website and 26% can submit forms or even make payments online. Furthermore, between 10% and 13% of the population can have access to interactive services regarding registry office certificates, declaration of new production businesses and the one-stop shop for enterprises. (Figure 4.4.2)
...to citizens' requests
Veneto's public administration thus offers its citizens and enterprises good ICT tools which help reduce barriers to public services. However, the population's ability to use these new technologies and to make the most of the innovation that the public sector is implementing remains to be seen.In 2010, 55% of Veneto families had access to Internet, a figure above the national average (52%) and in constant growth in recent years: 16% in 2000, 38% in 2005 and 50% in 2009. Furthermore, slightly less than half of Veneto's population say they have used Internet in the last three months (48%), above all for study, work, or finding information on products and services. Apart from these reasons, 28% say they have used it to find information on PA websites, which is slightly lower than the national average (29%) and above all less than many other regions in the North (35% Valle d'Aosta, 34% Friuli Venezia Giulia and Trentino Alto Adige). This percentage declines if we consider the more complex operations: only 19% downloaded forms and 8% sent them after compilation.
In order to meet the objectives of efficiency and cost-cutting, the process of digitalising public services must not forget the citizens. It has to be a shared process, where one should not dash ahead of the other.
Enterprises' use of ICT however is greater. In 2008 73% of Veneto enterprises used Internet to obtain information from the PA and download forms, while over 40% completed a whole procedure online. Yet in comparison with other reasons Veneto is not doing so well. It comes twelfth in the rankings for regions with enterprises using Internet to communicate with the PA to get information, and sixteenth for completing procedures online. (Figure 4.4.3)

