-
Statistical department’s site
Home page
Our publications
Travelling is good, sustainable travelling is better
The expression "sustainable mobility" is used to refer to an urban transport system which, while it guarantees everyone the right to move around and provides an adequate transport service, does not cause too much harm to the environment, meaning that atmospheric and noise pollution, as well as traffic congestion, can be kept under control. This includes using vehicles which respect the environment as much as possible, as well as greater use by citizens of public transport instead of privately-owned vehicles wherever possible.
Europe sees the transport sector as a priority. On 28th March 2011 the European Commission adopted the new European White Paper on Transport, which contains strategies to make transport in the Member States more sustainable and efficient. The new White Paper recognises the fact that "Transport is fundamental to our economy and society. Mobility is vital for the internal market and for the quality of life of citizens as they enjoy their freedom to travel. Transport enables economic growth and job creation: it must be sustainable in the light of the new challenges we face. Transport is global, so effective action requires strong international cooperation." (Note 1) It is clear that the current transport system is not sustainable: "Looking 40 years ahead, it is clear that transport cannot develop along the same path. If we stick to the business-as-usual approach, the oil dependence of transport might still be little below 90%, with renewable energy sources only marginally exceeding the 10% target set for 2020. CO2 emissions from transport would remain one third higher than their 1990 level by 2050. Congestion costs will increase by about 50% by 2050. The accessibility gap between central and peripheral areas will widen. The social costs of accidents and noise would continue to increase. [...] the paramount goal of European transport policy is to help establish a system that underpins European economic progress, enhances competitiveness and offers high quality mobility services while using resources more efficiently." (nnnn 1) Special consideration is given to aspects regarding safety, quality, accessibility and reliability of transport services.
The new White Paper sets out 40 concrete initiatives to be implemented in the next few years: the ambitious aim is to create a modern and competitive transport system that will stimulate economic growth and job creation. The plan also aims to reduce European dependence on oil and to cut CO2 emissions (a 60% reduction by 2050 in polluting emissions in the transport sector). The strategic aims include:
- gradual phasing out of conventionally-fuelled vehicles from the urban environment, to achieve essentially CO2-free city logistics in major urban centres by 2030;
- shifting most medium-distance passenger transport over to rail;
- connecting all core network airports to the rail network;
- reaching an excellent level of provision of information on intermodal solutions;
- applying "user pays" and "polluter pays" principles;
- gradual shifting to a competitive regulated system;
- adopting smart transport management systems;
- promoting competitiveness and global energy and climate goals;
- attaining zero fatalities in road traffic accidents.
From 2008 to 2010, the average number of daily commutes, the distance travelled and the time dedicated to travelling decreased each year; however, most journeys continued to be undertaken in motor vehicles. Every day, in 2010, the average person travelled 36.4 km (43 in 2008) and spent 62 minutes travelling (67 in 2008). (Figure 15.1.1) and (Figure 15.1.2)
If the aim is to incentivate reasonable changes in daily habits and alternatives to the car, then the public transport system needs to be high quality and competitive.
In what condition is the local public transport network?
For many years now Italy's Ministry of Infrastructure and Transport has carried out a census on the businesses providing local public transport for road passengers in the region (not including transport linking more than two regions). Figures 15.1.3 and 15.1.4 show indicators on local public transport supply provided by companies: if we look at the indicator on seats/km (Note 2), which gives us the real transport supply, in 2008, the most recent year for which data is available, we can see that Veneto stands out for the service provided outside of cities; it is second out of the Italian regions, after Lombardia. Veneto is in last place amongst its competitors, however, as far as the service within the cities is concerned. It can be seen in particular that, after an upward trend both in transport within and outside of the cities up until 2006, there was a slowdown in 2007, which then was overcome again in 2008 when the supply both within and outside of the cities picked up.
The increase in supply of public transport within the cities is certainly positive considering the stiff competition from cars and motorcycles, which seem to be better adapted to the individual's mobility needs, especially if we think about the so-called "city-users" (commuters, workers or students living outside the city, tourists etc.) who do not live in the city but who use its resources, thus increasing pressure on the city's services. The revitalisation in public transport outside of the cities is even more positive, especially considering that Veneto's urban sprawl means there is more need for people to move over medium to long distances, above all from the outskirts into the main centres to reach places of production, services and consumerism. The trend in the number of passengers travelling on services outside of cities, which represents the demand for mobility, is keeping up with the supply. (Figure 15.1.3), (Figure 15.1.4), (Figure 15.1.5), (Figure 15.1.6) and (Figure 15.1.7)
In terms of demand for privately-owned vehicles on the other hand, figures from 2009 seem to suggest that state incentives towards buying new vehicles have had some positive effects on the environment. As a matter of fact, on the one hand we can see a slight decrease in the overall motorisation rate compared to the previous year, on the other hand the number of less-polluting vehicles has increased.
In 2009, the most recent year for which data is available, the vehicle stock dropped slightly (-0.3%) for the first time in years: there were just under 3,800,000 vehicles, 77% of which were cars (+0.8%).
The unstoppable increase in the use of motorcycles continues however: in 2009, 86 out of every 1,000 inhabitants (4 more than in 2008) owned one, adding up to 420,000 motorcycles overall (+5.5% compared to 2008). (Table 15.1.1), (Figure 15.1.8), (Figure 15.1.9) and (Figure 15.1.10).
An analysis of vehicles on the roads shows that in Veneto in 2009 35% of cars met the "Euro4" and "Euro5" standards on polluting emissions, and 49% belonged to the "Euro2" and "Euro3" categories. These figures place Veneto ahead of the Italian average in terms of modernisation of vehicle stock. The "Euro0" standard is met by 13% of cars on the roads in Italy, whereas in Veneto this figure has been reduced to just 9%. (Figure 15.1.11)
The emissions standard categories for industrial vehicles differ slightly from the figures for cars however. "Euro0" vehicles still account for 24% in Italy and 18% in Veneto, a much higher rate than for cars. Certainly, the differences between the two vehicle categories should be taken into account, especially as the average lifespan of industrial vehicles is longer than that of cars. Both in Italy and in Veneto the number of vehicles in the "Euro2" and "Euro3" categories is higher. It is worth pointing out, however, that compared to 2005 the number of industrial vehicles in the most-polluting categories has decreased significantly. (Figure 15.1.12)
The vehicle stock in Veneto includes mainly cars which run on petrol and diesel (55.0% and 36.7% of the total respectively); the former decreased by -9.7% and the latter increased by 334.5% between 1990 and 2009. The remainder are bi-fuel cars: LPG/petrol cars make up 5.8% of the total and methane/petrol 2.4%. For the same period, the latter increased by 110.5%, while LPG/petrol cars increased by just 4.8 percentage points.
Methane is drawn directly from the national network, which also supplies homes. Italy is one of the countries with the widest distribution network of methane, especially in the Pianura Padana area. It is not a coincidence then that Veneto stands in second place in the national ranking of the distribution network of methane as an automotive fuel.
In Veneto there are 595 cars per 1,000 inhabitants (the Italian average is 606): of these, 327 run on petrol, 219 on diesel, 35 on LPG/petrol and 14 on methane/petrol.
In 2008 Veneto's road network consisted of an overall total of just over 10,000 km, this includes regional and provincial roads, ex-state roads and motorways. This adds up to around 22 km per 10,000 inhabitants, 59 km per 100 km² of surface area and 37 km per 10,000 cars on the roads. (Figure 15.1.13)
The worldwide financial crisis has also affected port traffic, but to a different extent in each sector. On the one hand the total goods traffic decreased in 2009, as did, to an even greater extent, the number of ships arriving. On the other hand there was a continual increase in the moving of containers, and in the number of cruise ships and passenger ships. At any rate, 2010 did show some early signs of revitalisation. (Table 15.1.3), (Figure 15.1.14)
Venezia's Port Authority stands out for its series of initiatives regarding sustainability, in particular its promotion of projects to reduce the environmental impact of the port on the city and on the lagoon.
Within the "Green port" programme, activities fall into four categories: air, water, earth and energy.
As far as air is concerned, besides monitoring and studying the quality of air, projects were also set up enabling the reduction of harmful emissions and the use of alternative energy sources.
For water, new quays were built in Marghera to prevent contamination of the lagoon and aquifers, and in Marittima rain water is being collected and filtered before being recirculated.
In terms of earth, the Port Authorities are clearing up areas of Porto Marghera. In this way some industrial areas will be able to be converted into ports and used for logistics.
Lastly, to encourage energy-saving measures, in the autumn of 2010 LED technology was used to light up the port for passenger transit, with 23 metre-high light towers which save 70% more energy than conventional systems. During 2011 around 18,000 m2 of solar panels will be fitted on the roofs of port buildings; this will provide electricity to power the passenger terminal and, during periods when there are no cruise ships, will put back into the network the energy collected during peak times.
Furthermore, in order to develop the port in a sustainable way, the Venezia Port Authorities have decided to conform to the ISO 14001 standard on environmental responsibility, which gives indications on the requirements for the development of an Environmental Management System. Environmental certification confirms an organisation's commitment to environmental management. The aim is keep the impact on the environment under control and to continually improve performance.
The aim is to define the most convenient markets for each port system, to be identified based on certain strategic indicators: transport efficiency (transit time and consumption) and/or environmental sustainability and saving of energy (consumption and emissions).
The research enabled the identification, on the European continent, of isochronous, isoergon and isocarbon curves describing sea-rail intermodality, starting from the gateway with Asia in Port Said in order to define the most efficient multimodal routes to the various end destinations in terms of transport efficiency and environmental sustainability.
It was possible to determine the isochronous, isoergon and isocarbon curves using the data on the main vehicles used and on the condition of the network (railroads fit to transport shipping containers). (Figure 15.1.15)
Curves of equal accessibility time (isochronous)
Combining shipping times with rail transport times, calculated along different routes, enabled the identification of different isochrones for trade relations passing through different ports.Comparing and overlapping these curves then enabled the identification of areas of competition and areas of indifference amongst the different port systems. The former are areas which can only be reached conveniently through one specific port; the latter are areas which have the same transit times for intermodal routes passing through one or two ports.
These carefully drawn-up maps were compared in pairs in order to identify the European areas which can be reached in the same amount of time using different loading/unloading ports alternatively. (Figure 15.1.16) and (Figure 15.1.17)
Curves of equal energy consumption (isoergon)
Working out the overall consumption for each intermodal route enabled the creation of consumption curves (isoergon) for every alternative European port used.Overlapping the maps enabled the definition of areas of competition and of indifference. (Figure 15.1.18) and (Figure 15.1.19)
Curves of equal emissions (isocarbon)
The emissions generated by the different vehicles while in use are proportional to energy consumption and therefore to the journeys undertaken (km). Curves of equal emissions (isocarbon) were created and the areas of competition and of indifference were defined. (Figure 15.1.20) and (Figure 15.1.21)The predominance in terms of distribution of the ports of Northern Europe derives from certain conditions in the past which led to significant enhancements in the port equipment and in the overland distribution networks leading to the end markets.
The results confirm an imbalance in the use of different means of transport, bringing to the forefront opportunities for a more sustainable distribution of flows between EU ports.
The first result is quite obvious as it shows that, for the flows of goods passing through the Suez Canal, the greater lengths travelled by maritime traffic in order to reach the ports of Northern Europe in themselves make them much less competitive in terms of transit time, energy consumption and therefore of CO2 emissions (even though the northern ports could make up for some of the inefficiency through the management of the goods on land).
It was possible to identify the "most sustainable" influential areas and the areas of indifference for each port system:
- the first area is to be found on a North-South axis which includes Poland, Slovakia, Hungary and Bosnia-Herzegovina and is an equivalent area for shipments passing through Costanza or Venezia;
- the second is to be found towards the North West along an axis which reaches Belgium from North Italy by passing through Switzerland, for shipments arriving via Costanza or via Venezia;
- the third is to be found, heading North West again, almost on the French-Spanish border. It defines the areas which can be reached equally efficiently via Genova or via Costanza.
Figure 15.1.1

Figure 15.1.2
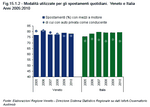
Figure 15.1.3
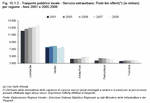
Figure 15.1.4
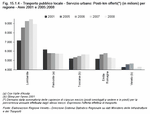
Figure 15.1.5

Figure 15.1.6
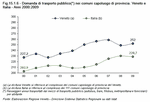
Figure 15.1.7
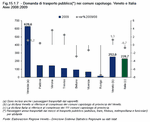
Table 15.1.1

Figure 15.1.8

Figure 15.1.9

Figure 15.1.10

Figure 15.1.11
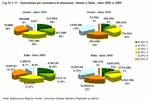
Figure 15.1.12
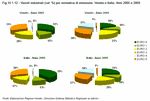
Figure 15.1.13
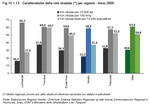
Table 15.1.2

Table 15.1.3

Figure 15.1.14

Figure 15.1.15

Figure 15.1.16

Figure 15.1.17

Figure 15.1.18

Figure 15.1.19

Figure 15.1.20

Figure 15.1.21

Figure 15.1.22

15.2 Veneto citizens' mobility styles and behaviour (Note 4)
What styles, what type of quality and what tendencies do Veneto citizens have with regards mobility?
We would like to take a look at the population aged between 14 and 80 years old, known as the "mobile population", to see how intensively different means of transport were used during the three months leading up to the interviews with the citizens, with the aim of comprehending the relationship between the individual and different means of transport over a relatively long period of time.
In 2009, as could have been predicted, the car proved to be the favoured form of transport amongst Veneto citizens; not just because almost everyone (96.5%) admitted having used it, even if infrequently, during the three months leading up to the interview, but mainly because an extremely large share (73.6%) of interviewees used their car regularly (at least 3-4 times a week). This kind of loyalty leaves all other forms of transport far behind: as a regular means of transport the bicycle comes up next (27.8%), followed slowly by the bus (8.7%) and the motorbike (6.9%). There is more variety in the data on occasional use of vehicles where the bicycle stands in first place (33%), followed by the car and the bus (both at just over 20%). Compared to 2004, the frequency of use for all of the means of transport under consideration increased. To be more precise, the total number of users (habitual and occasional) increased exponentially for regional trains (from 9.2% to 22.4%), it doubled for coaches (from 6 to 12%), and for bicycles it shot up from 45.6% to 60.9%. The results for cars, motorbikes and long-distance trains are also positive, although slightly more restrained. (Figure 15.2.1)
Percentages registered for different vehicles in Veneto seem to be fairly in line with those of other important regions such as Lombardia, Piemonte, Emilia Romagna and Toscana and with the national averages and the averages for the North of Italy, with one exception: the bicycle. In Veneto 60.9% of people use a bike, at least occasionally, which is almost double the national average (35%) and quite significantly higher than the average for the North of Italy (47.8%). Of the regions taken into consideration, only Emilia Romagna (57.6%) comes close to Veneto, further proof that the bicycle is quite a deep-rooted and popular phenomenon in Veneto.
The other, much slighter differences between Veneto and the other areas regard the use of the motorbike as the share of motorcyclists in Veneto is a little lower than the national average (but not for the North of Italy) and than regions such as Toscana (23.4%). There are also differences in the use of the bus, as in Veneto 30% of people take it whereas the national average is 34.3%; the average for the North of Italy is 36.7% and many regions are also higher e.g. Piemonte (41.9%). Furthermore, it should be mentioned that the railways also bring in much higher shares of passengers in regions such as Emilia Romagna and Toscana than in Veneto. This does not mean that the shares of people using this means of transport regularly are higher in these regions, as it is actually the occasional users who make the difference here.
Lastly, compared to 2004, data for the different areas looked at show that the use of all types of vehicles is increasing, especially public transport outside of cities (regional trains and coaches). (Figure 15.2.2)
Interviewees were asked to assign a score from 1 to 10 to their degree of satisfaction with the means of transport used, not just for individual journeys, during the three months leading up to the interview.
All of the individual vehicles (car, motorbike, bicycle) scored highly for satisfaction, with an average of over 8; the two-wheeled vehicles in particular, with and without engines, lead the rankings with a score of 8.3. Public transport follows fairly far behind, although all the types pass the test. Medium and long-distance trains (Eurostar, Intercity) score 7.2, buses (6.9) and coaches (6.9) received very decent scores whereas the regional trains just scrape the grade and bring up the rear with 6.3.
Satisfaction levels have remained stable or have increased since 2004 for all types of vehicles, with one important exception: the trains. Long-distance trains dropped from an average score of 7.6 in 2004 to 7.2, which is still a positive score, in 2009; likewise the regional trains slipped back from 6.9 to 6.3.
Compared with other Northern regions in 2009, satisfaction with transport in general was higher in Veneto. There was quite a difference between the satisfaction expressed by Veneto citizens for group transport (buses and trains) and that shown by citizens of other areas. Furthermore, the other regions have not seen as much improvement in general perceptions of transport systems as Veneto, with the railways being an exception, as has already been mentioned. (Figure 15.2.3)
If we look at the shares of satisfied transport users (Note 5), instead of at the average scores, other considerations emerge.
Firstly, the motorbike shoots to first place in the rankings for satisfaction, as 90.3% of users interviewed gave it a score of between 7 and 10 (in 2004 this figure was 85.7%). This is followed by the car (86.9%), also on the increase compared to 2004, while the bicycle seems to have slowed down since 2005, although satisfaction levels are still very high (84% compared to 86.6% in 2005).
Group transport also provides some interesting figures, with more variation between road and rail transport than was revealed through the indicator on average score. Buses started out with a very low share in 2004 (47.3% of users ascribing a score of 7-10) but they picked up enormously reaching 64.4% in 2009; this is one of the highest figures out of the regions looked at, just behind Emilia Romagna (67.7%) and substantially higher than the average for Northern regions (55%) and even more so than the Italian average (45.7%). In contrast, both regional and medium and long-distance trains have dropped a few places, although average scores on satisfaction remain much higher than the other areas Veneto was compared with. For regional trains, for example, the figure for Veneto, at 51.2% clearly breaks away from the averages for the North and for Italy, which stand at 41.8% and 42.9% respectively. It should be pointed out, once again, that in other regions the perception of the quality of local trains is fairly modest, from 45.6% in Toscana to 33.8% in Piemonte. (Figure 15.2.4)
In conclusion, it can be said that the population in Veneto is very happy overall with the different forms of available transport.
There are still large gaps between the excellent perceived performance of individual vehicles (motorcycles, cars and bicycles) and satisfaction with public transport services, with the former obviously out in the lead. If, however, we look at the trends for recent years and at comparisons with other regions, Veneto stands out for its (relatively) high approval of collective transport. The bus, in particular, boasts significantly higher degrees of satisfaction than in other areas, and the same is true of the train (national and local), even though, in this latter case, the general slide towards lower levels of satisfaction with rail services, especially on a regional level, can also be perceived in Veneto.
Citizens often have "good intentions" with regards public transport, however there is quite a difference between the declared inclination towards changing means of transport, which is often high, and actual practice, which almost never changes significantly (to match what has been declared).
A good 4 out of 10 interviewees in Veneto in 2009 stated that they would like to use more public transport in future, compared to 5.1% who would prefer to cut down and the majority, 54.7%, who had no intention of changing their transport habits. These figures are completely in line with the national and Northern average.
As far as cars are concerned, the ideas contrast almost completely those given on public transport: 35% of Veneto citizens would like to cut down on the use of the car, while just 4.2% would like to use it more and the majority (almost 60%) do not want to change the amount they use it. Once again the percentages are pretty much in line with the averages for the North and for Italy. Lastly, with regards the motorcycle, the large majority has no desire to change how much they use it (more than 80% of Veneto citizens). This confirms that motorcycles are not a choice for everyone, but those who do choose them are very loyal to them. (Figure 15.2.5)
A comparison with data from 2004 shows that the tendency is for a positive inclination towards public transport and, in contrast, a negative inclination towards the car. As a matter of fact, only 9% of the sample of Veneto citizens stated in 2004 that they would like to use public transport more, compared to 71.8% who were happy to stick to the same degree of use and just 10.9% expressed the (opposite and complementary) inclination to use the car less. It is clear that the desire for public transport, over the years, along with a tendency to dismiss the individual means of transport, the car in particular, has grown exponentially amongst the Italian population and, at the same pace, amongst the population of Veneto. This is probably due to a decrease in the perceived attractiveness of the car, e.g. increase in traffic, increase in petrol prices, and limitations on access to the city centres. (Figure 15.2.6)
What are the main reasons for not using public transport? (Note 6)
Factors such as the diffusion of public transport services, route frequency, journey speed and quality of service come into play; they are, and remain, the weak points as perceived by potential users of collective transport. In Veneto in particular the problems focus on accessibility of transport services rather than on the toss-up between taking public transport and using the car with regards the length and reliability of travelling times. This fits in with Veneto's urban sprawl: where there is a structured network of urban centres, local public transport has to find a way to serve a spread-out area with sufficient frequency. Amongst the reasons for not choosing public transport in Veneto, the quality of the public transport vehicles does not figure often, which on the one hand proves that Veneto citizens appreciate the services provided (as has already been seen in the section on satisfaction with services) and on the other hand shows that in places where the urban fabric is less concentrated the conditions of public transport can objectively be perceived as better (vehicles are less crowded, fewer commuters etc.). (Table 15.2.1)
Availability of services, i.e. the real observation, or simply the perception - as there sometimes may be a problem of misinformation - that "there is no public transport to get to my destination", plays a significant role (around 20% of comments cited this reason), but not a predominant one. It should also be highlighted that the figure for Veneto is perfectly in line with the national and Northern averages; in Piemonte and Emilia Romagna the figure is a little higher, while in Toscana it is a little lower (around 15%).
Accessibility/convenience is, instead, the main factor, cited in 80% of cases; this figure is higher in Veneto than in any of the other areas taken into account, except for Toscana (84%). This grouping brings together the reasons making public transport less practical than privately-owned means of transport; because the service is not easily accessible ("the stop is too far away", "the timetable doesn't tie in with my schedule") or because it is inconvenient in other ways ("I would have to take more than one means of transport and I don't want to", "the change-over is not smooth", "I have to travel elsewhere during the day").
Time is also another firm factor making public transport less competitive as 36.7% of indications pointed towards this (slightly fewer than the national average and the average for the Northern regions); the usual observations on journey time come out such as "it would take me too long, I can get there much more quickly with my own means of transport" or "I have to wait too long for it to arrive", as well as observations on the time taken by the journey itself.
Last of all, the other factors, including the quality of the journey (uncomfortable means of transport) and the subjective preferences for an individual vehicle ("I like driving", "I like being on my own in the car") equate to a very small share, around 12%; this figure is also lower than that registered in the other areas looked at.
As far as opinions on the liveability of the interviewee's home area are concerned, topics such as traffic intensity and pollution provoked negative responses; these appear to be the most urgent questions perceived by Veneto citizens. Cleanliness of roads, on the other hand, gained better results.
Compared to the answers given four years earlier, there was a significant drop in the average score awarded to traffic and pollution (both of them received an acceptable grade in 2004), but cleanliness of roads did improve slightly. (Table 15.2.2)
The opinions given on a series of measures to promote sustainable mobility can be summarised into three main groups:
- measures supporting collective transport which gained, overall, the highest degree of adherence and which involve "discounts for season tickets for public transport" (average score of 8.7 on a scale of 1-10, the highest score of all) and "an increase in preferential traffic lanes for public transport" (7.6);
- measures banning or limiting private vehicles from certain areas, these also scored very highly (8.7 for "preventing heavy vehicles from urban areas" and 7.3 for "banning cars from the city centre and other busy areas");
- measures introducing tolls, which Veneto citizens absolutely do not want, much like in the rest of the country: the score for park pricing is 4.9 (for non-locals only), and the score for road pricing is even lower at 4.5.
Compared to 2004, Veneto citizens are tending to adhere much more to policies on sustainable mobility. This is the case for all of the measures under scrutiny, and in particular for those supporting local public transport and banning heavy traffic in urban areas. (Figure 15.2.7).
As regards the efficiency of measures to reduce pollution, the reactions of Veneto citizens were completely negative. The only positive evaluation was for banning the most-polluting types of vehicles (old diesel engines and engines without catalytic converters). Furthermore, agreement with all of these measures has dropped significantly since 2004, in Veneto more so than in other regions. The set of measures aimed at reducing smog in urban areas is also provoking ever more scepticism. On the other hand, they are measures which are iterated every year, which contradicts the idea that they are designed to deal with emergencies and therefore should only be used occasionally. Citizens feel that the local governments are incapable of dealing with the traffic problems and pollution structurally by providing long-term answers to the serious problems affecting standard of living in many urban areas. The measures adopted are designed to relieve the problems but not cure them, therefore citizens find them more and more difficult to swallow. (Figure 15.2.8)
Lastly, citizens also spoke out on the possible policies for improving public transport, evaluating in particular each single measure's ability to encourage a greater use of public transport.
All of the measures looked at received medium-high scores from the people of Veneto. The intermodal solution in particular was well received, both in terms of integrating the car with public transport (for example creating park and rides) and of integrating bikes and public transport (for example providing secure parking or allowing bikes to be taken on public transport etc.). This was followed by the idea of reducing journey times of public transport vehicles and making them more regular. (Figure 15.2.9)
The methodology used by Isfort-Osservatorio "Audimob", a transport research institute, calculates the emissions produced by each individual during their daily journeys, from getting to work to going to the gym, from doing the shopping to taking the kids to school. This enables an empirical evaluation of the effects of changing means of transport, based on actual behaviour as reported by the interviewees. The analysis of the impact on polluting emissions regards two types of hypotheses: the first considers a situation in which all of the people who were not happy about using their cars, or who stated that they would be willing to increase their use of public transport actually carry out all their journeys using public transport; the second hypothesis considers a situation in which all journeys of under 15 minutes currently carried out in the car are actually undertaken on public transport.
The results of a recalculation of the emissions based on these two scenarios, compared with real data, show that it is possible to improve quality of life, finding the right balance between social policies and individual behaviour in order to find solutions towards a more efficient and effective transport system. (Figure 15.2.10)
Figure 15.2.1
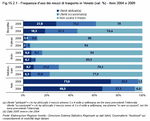
Figure 15.2.2
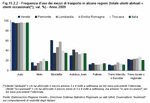
Figure 15.2.3
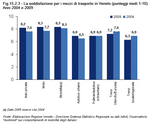
Figure 15.2.4
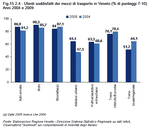
Figure 15.2.5

Figure 15.2.6

Table 15.2.1

Table 15.2.2

Figure 15.2.7
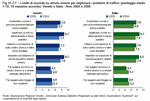
Figure 15.2.8
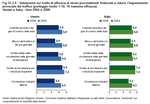
Figure 15.2.9

Figure 15.2.10

15.3 Journeys carried out by students and workers (Note 7)
In this paragraph we will only look at the journeys from home to school or to work which make up the biggest part of commuting.
Not all workers or students can really be considered commuters though: some of them say that they take different amounts of time to get to work or school which probably means that they are not always in the same place. This is especially common amongst workers: in Veneto a good 12.3% of workers are in this condition, lower than the national average (16.4%). Only a small share of students in Veneto (1.8% compared to 4.9% in Italy) take different amounts of time to get to school each day however. One explanation could be that it is mainly university students who have to face this question, and in Veneto this share is lower than in Italy on average.
Over the years society has become ever more frenetic and time is a precious resource which must not be wasted. Time taken for travelling could be used to do other things, therefore in order to improve people's quality of life, fast and efficient mobility is also essential.
On average workers in Veneto take 21.7 minutes to get from home to work. This is not an excessive amount of time if we take into account that the national average is 24.9 minutes and that more than 85% of workers (compared to 80.2% in Italy) take a maximum of 30 minutes. (Figure 15.3.1)
Students tend to take less time to get to their place of study than workers to work. The average time taken increases as the level of education increases. The primary and middle schools are well spread out in the region, the high schools are mainly to be found in the medium-large urban centres whereas the universities are only located in the large urban centres.
It follows, therefore, that most students take a shorter amount of time to get to school as university students make up a very small share of the group, and often they decide to move closer to the university so as not to take too long to get there. There are much fewer differences between Veneto and Italy when speaking of students as, in order to guarantee every citizen's right to study, schools are fairly well and evenly distributed across the whole of the country. The average time taken in Veneto to get from home to the place of study is actually 19.5 minutes, slightly lower than the 20.7 minutes taken by students in Italy on average and the distribution of the time taken for the journey is almost the same in each case. Both in Veneto and in Italy, 84.2% of students spend 30 minutes at the most travelling to school. (Figure 15.3.2)
One of the side effects of mobility is traffic congestion, meaning that the infrastructure is unable to guarantee citizens can travel freely and smoothly around the region. In cities especially there are often traffic queues and situations which, according to the European Commission, cost the EU 1% of its GDP. Within their daily lives, congestion causes people to waste time which could be used to do something else and it also raises stress levels.
Congestion is often caused by the fact that too many people have to travel at the same time. The infrastructure is not able to cope with the transport demands, especially at certain times of day.
A good 65.3% of students and 51.4% of workers in Veneto leave their homes between 7:30 and 8:30 a.m. to get to school or work. The difference is mainly due to the fact that the school day starts at practically the same time for all levels of education (except for university), whereas workers have different schedules, even though, however, most workers leave home between 7:30 and 8:30 a.m. Besides, seeing as workers tend to take longer to get to their place of work than students, even if they start at the same time they have to leave home earlier. (Figure 15.3.3) and (Figure 15.3.4)
In Veneto the peak time for workers to leave home in the morning is between 7:30 and 8:00 am, in Italy however, even though there is a peak at the same time, the distribution is also more evenly spread out between 7:00 and 8:30 am. Students in Veneto leave home earlier than on average in Italy: the peak time is between 7:30 and 8:00 whereas in Italy the peak is in the very next time block.
If the end purpose is to gain access to a certain good or service then it is not always necessary to make a trip. Thanks to new technologies the citizens can now get closer to service providers or places of work. Services such as the e-government, e-health, telework, and distance basic and continuing education are still not very common, neither in Italy nor in Veneto, but they could help towards finding a solution for congestion problems, reducing the number of journeys or allowing people to choose when to make their journeys.
Only 1.5% of employees in Italy and 1.8% in Veneto work from home, it should also be taken into account that most of these workers are self-employed and so their home is actually their place of work.
Therefore, it is plain to see that travelling in a car, even though it is still the main means of transport, has a much lower share, losing ground to public transport, the bicycle or going on foot. If we look in particular at the choices made by students, they tend to travel by coach, bus or school bus, and they walk a lot more or get lifts in cars more than workers. Workers, on the other hand, tend to drive their own cars. The use of the car is usually justified by the fact that public transport does not reach the place of work quickly or arrive everywhere and it does not provide the flexibility needed by a worker in order to permit them to also take care of their families' needs. Furthermore, workers often have to travel further than students making it impossible for many workers to cycle or go on foot. (Table 15.3.1)
Commuters in Veneto tend to use their own means of transport rather than more sustainable means. Workers in Veneto use public transport less than in Italy in general (6.6% compared to 9.8%), most use their own vehicles (75.1% compared to 74.3% in Italy), with a lower percentage of workers sharing a vehicle, and some did not specify which means of transport they use (4.8% and 2.4% in Italy). Of the students in Veneto who travel in a privately-owned vehicle (44.9%), most travel as car passengers, which also has an effect on the shares that choose to walk to school and that take public transport. It should be pointed out that both workers and students in Veneto use their bicycles more, but only amongst the workers does this share manage to counterbalance the lower share choosing to walk. The demographic structure of Veneto, where the population is relatively spread out throughout the region, and where quite a large share live in medium-small urban centres, may explain why many choose to travel in their own vehicles and why many students choose coaches over buses.
Within the context of sustainable mobility, it is worth taking a particularly close look at the transport system within the urban agglomerations. The high population density and the different attractions held by the cities (work, study, leisure time, shopping, etc.) lead to a high demand for mobility which cannot be provided for by the car alone. The most typical problems of urban areas are traffic congestion and pollution caused by overuse of cars. There are different ways to counteract these negative factors: taking as a starting point the high demand for transport it may be easier to reinforce the public transport system, to encourage journeys made on foot or by bicycle by making pedestrian crossings and cycle paths safer, and to make it easier to integrate different means of transport. As far as using a car is concerned, solutions such as car-sharing or car-pooling should be introduced, free parking within the cities discouraged, the creation of park and ride services outside of the city centres encouraged so that people can only reach the outskirts of the city centres by car and have to take public transport to travel further in. Furthermore, urban planning should take into account the continual expansion of the urban belts which must be accompanied by an equivalent extension of public transport services.
Even though it only provides us with a partial picture of the situation, it is interesting to take a look at the means of transport used by residents in urban areas compared to those in rural areas (Note 8).
More students from urban areas go to school on foot or by bicycle as they live closer to them than students living in rural areas. The significant increase in these clean means of transport chips away very little at the use of cars, as this latter is still the main means of transport, it appears rather to replace the use of public transport. The coach service outside of the cities does not constitute a valid option as the schools are mainly to be found in the centres and the school bus is practically non-existent, carrying out the function of a bus in rural areas for students. Workers also prefer to take their own vehicles, although to a different degree. For workers, public transport actually attracts higher shares amongst the residents of urban areas, more so than journeys carried out by bicycle or on foot, which do however increase a little. The distance between home and work is usually larger than between home and school, also the widespread service within the cities and the problems finding parking spaces mean that public transport is more attractive for workers. Lastly we cannot forget that the large urban areas are under pressure not only from their own residents but also from commuters travelling in from the rural areas. (Table 15.3.2) and (Table 15.3.3)
In Veneto the percentage of students from urban areas travelling in cars drops compared to the rural areas, although it is still the main means of transport, making up 41.7% of the total. The share of students deciding to walk or go by bicycle doubles (38.3%) while the share taking public transport decreases significantly, standing at around 19.9%. These trends are also true for Italy as a whole but they are less marked than in Veneto, in fact on a national level the use of the car is higher amongst students from urban areas than from rural areas. In Veneto, amongst workers living in urban areas the share of journeys carried out in cars, at 64%, is much lower than the Italian figure (69.6%). Compared to the national figure, using the car less is compensated for by a higher share of journeys carried out on foot or by bicycle (17.5%) and using other means (4.9%).
Veneto has positive results compared to Italy for the use of the bicycle amongst residents of urban areas; this share actually equals 14.6% of students (in Italy the figure is 2.3%).
Often different means of transport are used depending on the distance to be travelled or the time taken to reach a particular destination. To reduce the role of the car it is a good idea to encourage the use of the bicycle or walking for shorter distances, while public transport could provide a valid alternative for longer journeys in particular. (Figure 15.3.5), (Figure 15.3.6) and (Figure 15.3.7)
The most used means of transport in Veneto for trips taking under 15 minutes is the privately-owned vehicle, both amongst students (55.3%) and amongst workers (67.2%). Journeys carried out on foot or by bicycle make up a solid share, leaving public transport with a minor role, especially amongst workers. In a comparison between Veneto and Italy as a whole we can see that there are not any major differences with regards the distribution of means of transport amongst workers. In contrast, students use more public transport than in Italy in general: in rural areas, seeing as the traffic levels are not excessive, a lot of parents prefer to take their children to school by car, even if it is only a short distance away.
With regards trips of between 15 and 45 minutes, there are big contrasts between students and workers. The privately-owned vehicle is almost exclusively used by workers whereas students tend to use more public transport. There is a simple explanation: seeing as most students do not have a driving licence it is hard for them to find someone to give them a lift for medium-long journeys, especially if public transport is available. Whereas for workers, public transport does not provide any advantages in terms of saving time. These trends are more marked in Veneto than in Italy both for students, who use mostly public transport (46.9% compared to 43.8% in Italy) and for workers, who tend to use their own vehicles (86.2% compared to 83.1%). The percentage of journeys made by bicycle and on foot decrease considerably: in Veneto the share is lower than in Italy for students in particular (13.3% compared to 20.1%).
Also for trips of over 45 minutes, students tend to use more public transport and workers their own vehicles. For students the use of public transport increases until it almost completely dominates, whereas for workers, the use of the car, even though it is still the main means of transport, does decrease a little to be replaced by the use of public transport. Furthermore, for workers in Veneto who travel long distances to get to work, the use of the car is lower than in Italy (58% compared to 62.7%), whereas public transport (36.5% compared to 33.6%) and other, non-specified means (4.4% compared to 2.5%) take higher shares.
Public transport, as opposed to bicycles and walking, permits longer journeys, often with shorter travelling times, and also provides for the weaker members of the community who are not as physically able. It is for this precise reason that public transport should be considered as completely essential when planning a sustainable transport system.
The increase in the use of public transport, and therefore the decrease in the use of the car provides a series of environmental, social and financial benefits for all. Examples include reducing traffic congestion and air and noise pollution, ensuring older people, disabled people, students and all those who do not own a car can travel, cutting down on the risk of accidents, freeing people from driving duties leaving them free to do other things (reading, chatting, resting etc.), saving money for families by cutting down on the costs of buying and maintaining a car.
Almost half of the population aged 14 and over consider using public transport for their journeys. There is a slight difference between the percentages in Veneto, where 49.8% use public transport at least once a year, and in Italy (48.6%). If we look closer at daily journeys we can see that only 14.2% of Veneto citizens use public transport regularly; this is lower than the 18.3% declared in Italy. (Table 15.3.4)
If we look at the three main types of public transport, the train, the bus, and the coach, the train is the most popular in Veneto as 34.8% of the population aged 14 and over use it at least once a year. However, only 2.8% take a train more than once a week. The most regularly used public transport in Veneto is the bus: 8.3% of the population take it more than once a week and 21% at least once a year. This is followed by the coach (5.2% more than once a week and 18.1% at least once a year). It should be pointed out though that, in Veneto, 19.6% of the population aged 14 and over do not have access to a bus service in their home area. If we take into consideration only those citizens in Veneto who have access to a local bus, then 26.2% take the bus at least once a year (29.5% in Italy), whereas 10.4% use it regularly (14% in Italy).
Where public transport is having trouble proving itself as a valid option, the car is far and away the favourite means of transport among the Veneto population aged 18 and over. A good 76.4% (71.6% in Italy) state that they drive a car at least once a year, while 72.4% (67.1% in Italy) drive a car practically on a daily basis.
This is understandable if we take into account the disadvantages of public transport: the inflexibility of the timetables and travel times, stops which are often far from home or from the desired destination, the lack of integration of different means, overcrowding on certain routes, the dangerousness of certain stations at night, etc. Often, however, people use their cars excessivly, even when they could take public transport or go by bike or on foot. Of those in Veneto who drive a car at least once a year, just 17.2% also make regular use of a more sustainable means of transport, while in Italy this figure stands at 20.1%. The share increases greatly if we take into consideration those who, although they drive a car, also use an alternative means of transport at least once a year: in Veneto this comprises 52.7% of the population aged 18 and over, in Italy 50.8%. This means that citizens do not have anything against using other means rather than the car: if the public transport service was better and suited the population's needs more closely and if more attention was paid towards providing for pedestrians and cyclists, then more people would probably make more use of sustainable mobility.
In order, therefore, to check the results obtained by the enormous efforts made to organise a public transport system to compete with privately-owned vehicles, the user's perception of various aspects of the service is evaluated.
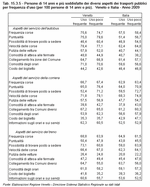
The features of the service can be subdivided into objective/structural aspects and more subjective factors that are more influenced by personal preferences and tastes. Some of the most important structural aspects include punctuality, route frequency, speed of service, convenient service times, cost of tickets and season tickets, overcrowding, link-ups to various destinations and availability of information on services and timetables. Punctuality is a feature of the reliability of a service and refers to a transport system's ability to stick to the planned schedules and to keep its journey times regular. Frequency is important because, the more routes there are, the more flexible the service and the shorter the waiting times at stops. Route speed cuts down on journey times and gives user the opportunity to do other things with their time, while link-ups with different destinations improves accessibility and allows users to reach certain facilities not only in their cars. Routes scheduled throughout the day are very important in order to provide for people outside of rush hours. Access to information, which may be made available both at the beginning of a journey and during it (on board or at the stops), improves the quality of the service and also makes it accessible to occasional users. Tickets have to be affordable for everyone, especially for the weaker members of society who cannot afford a car.
The subjective features, on the other hand, all refer to the comfort of the service, which depends on the types of users. Factors such as cleanliness, air-conditioning, lack of overcrowding on board, the availability of seats, low levels of noise and vibrations, lack of bad smells and comfort while waiting at stops all have an influence on overall comfort. (Figure 15.3.8), (Figure 15.3.9) and (Figure 15.3.10)
To summarise the information we have summary indicators which express the overall satisfaction of users with regards various aspects of the service provided by trains, buses and coaches. The indicators, which group together both objective and subjective factors, range from 0 to 100, where 0 is low quality of service and 100 high quality. Overall, the evaluation given by citizens in Veneto of the three main means of transport is in line with the Italian average, although none of the indicators reach particularly high values. The bus is the only indicator for which the Veneto figure (54 out of 100) is significantly higher than the Italian figure (48.1 out of 100). Of the three vehicles taken into consideration it is always the bus that is more successful overall in Veneto, whereas the train, even though the highest percentage of citizens take it at least once a year, has the lowest satisfaction indicator with 47.2.
The summary indicator on buses in Veneto is high thanks in particular to the good results gained regarding frequency, punctuality, speed of routes and the convenient timetables: more than 70% of citizens who make use of this service say that they are satisfied with all of these aspects, this percentage is much higher than the Italian average. There is, however, some bad feeling with regards ticket prices, even though more than 40% are actually satisfied with them. It is a relief to see that all of the main structural aspects are perceived as satisfactory by users: the bus is speedy, flexible and punctual, all of which are features to be made the most of in a marketing campaign to encourage its use. It also seems that there is not much difference in opinion between those who use the bus regularly and those who use it occasionally; overcrowding is the only factor which is perceived differently, but this is understandable as those who use it regularly probably do so during rush hour.
Coaches in Veneto, with a grade of 52.5 out of 100 in the summary index, received positive results for speed and punctuality of service in particular, more than 70% of users were satisfied with these aspects. Other features of the service were also favourable, for example route frequency and connections between different municipalities, both of which satisfied almost 70% of users. The only negative aspects were the comfort of waiting at stops and ticket prices. In Veneto the general appreciation of the coach service is higher than in Italy for most of the aspects taken into account, although the differences are often very slight. Compared to the bus, there is a much bigger difference between the opinions of occasional users and more regular users. Differences emerge especially with regards punctuality, the availability of seats, speed of routes and convenience of timetables: once again this is probably influenced by the needs of commuters who travel at specific times and by the fact that coaches do not have their own infrastructure and so have to deal with the same traffic problems as other vehicles.
The indicator for trains in Veneto (47.2 out of 100) is particularly low due to the evaluation given to cleanliness of carriages and, to a smaller extent, ticket prices. Things improve when we look at frequency and speed of routes as almost 70% of users are satisfied. There are differences in opinion on more than one aspect amongst people who use the service more or less frequently: the more regular users are generally more satisfied, perhaps because they are "used" to certain discomforts, but they make up a smaller share compared to the large group who take the train at least once a year.
On the whole, users seem to be satisfied with the public transport service, and this result should be made public. What remain to be understood are the reasons for which a considerable share of citizens do not consider using public transport for any journeys at all.
According to the fourth report on sustainability, presented by Euromobility at the end of 2010, Venezia is the most EcoMobile city in Italy. It moved up from sixth to first place thanks to an extremely well-performing public transport network and innovative mobility management involving Car Sharing and Bike Sharing, as well as a reduction in motorisation density and a significant increase in the number of cars running on LPG and methane.
Car pooling refers to a group of people sharing the use of a car, with the main aim of reducing transport costs. One or more of the group members put their car at the group's disposal, taking it in turns to use it, while the others contribute towards the cost of upkeep of the vehicle. This means of transport is common in work or university environments where different people who travel the same route at the same time spontaneously agree to travel together. This practice of sharing a car is very common in the North of Europe and in the United States where there are also specific associations to refer to. In Italy it is not very common at all. Only now some specific initiatives are starting to be brought about and are also being reported in the national press: in 2009 motorway authority Autostrade per l'Italia promoted an initiative to encourage car pooling which called for a reduction in motorway tolls on the A8 and A9 motorways.
It is well-known that cars often travel with just one person in them, the driver, even though they could fit 4 or 5. Car pooling would reduce the number of vehicles on the roads and would decrease traffic congestion without having to invest in new infrastructure, as well as saving on money per person on petrol, oil, tyres, tolls and parking, reducing pollution and improving social relationships between people.
Car sharing is a service enabling people to use a car by booking it, picking it up and dropping it back off in a car park near their home, paying based on the use made of it. This service, which is covered by the policies on sustainable mobility, makes it easier to move over from owning a car to just using one (therefore having access to mobility), enabling people not to have to own a car without losing the flexibility to deal with their mobility needs. In this way, the car is no longer a consumer good but a service. Car sharing is useful for people who only use a car occasionally (approximately those who travel less than 10,000 km/year). Families owning more than one car, and who actually use one of them occasionally, can combine owning fewer cars with having access to a car sharing service when the need arises.
Car sharing would reduce the number of cars parked in the streets and would encourage greater road safety. Cars which are shared are used more intensively and so are renewed more frequently than privately-owned cars, meaning that car sharers would be driving newer cars than the ones they would be driving otherwise. Since more recent cars also tend to be more technologically advanced, the environment would benefit in terms of emissions and consumption.
Due to the numerous benefits the urban community gains through this type of service, councils tend to encourage it through providing preferential traffic lanes and free access to restricted traffic areas, free parking in city centres and use of the roads even when traffic is being limited (i.e. partial traffic bans on cars based alternately on odd and even number plates, traffic bans when pollution levels have been exceeded etc.).
Unfortunately, however, car sharing and car pooling are still not very common at all.
Bike sharing is a service where bicycles are made available in certain places around a city. The bicycles are locked and so cannot be used by just anyone, but only by people who register to get a key or the right kind of card to unlock the bicycles. After its use the bicycle has to be taken back to the station it was taken from or it can be taken to another station. In general, for the first block of time, which may last half an hour or an hour, use is free, then the user has to pay to keep the bicycle and the longer they use it for the more they have to pay. These systems may allow monthly or annual season tickets and in smaller cities they may even be completely free. The service is limited to use during the day, but it could be made available 24 hours a day.
The evaluations of the tram's first years are certainly positive, and should also encourage other cities to develop tramlines: it seems that Verona will be the next city in Veneto to install a tram service.
After some initial criticism the local population seems to be satisfied with its new means of public transport, really embracing the tram.
A section on rail transport must include trains of course. Their use has increased in the last ten years but has been stable in recent years, both in Italy and in Veneto. The most favoured cities in this regard are Vicenza, Padova and Treviso.
From the statistics it can be seen that it is ever more commuters, both to work and to school, who make use of the regional railways: from 2009 to 2010 the number of travellers increased by 5% and the number of season ticket holders by a good 24%. Veneto is also in one of the top places in the national rankings of numbers of railway users.
There has been talk for quite a while of encouraging rail transport-to replace in part the use of the roads-by increasing vehicle frequency, in order to provide commuters with a more efficient service which will enable them to reach their destinations more quickly, without getting stuck in all the city traffic. Furthermore, running electric trains would help cut down on PM10 in the atmosphere. To this precise regard, for some time in Veneto there has been word of the Regional Metropolitan Railway System, a project which aims to create a metropolitan overground network with high frequency trains running between the four cities of Treviso, Venezia, Padova and Castelfranco Veneto. In this way the project would make it easier to travel by rail within the most inhabited area in the region. The aim is to increase the frequency of the service with more trains and more connections with other regional transport routes.
Apart from a radical and rational change to the transport habits from home to work, help in reducing traffic in cities can certainly also come from the companies themselves with the introduction of more flexible types of work, such as teleworking or working from home, or by setting up premises closer to their employees' homes, as well as by introducing more flexible work schedules to get rid of rush hour traffic. These could all provide employees with enormous benefits, meaning they do not have to face the stressful daily commute and cutting down on travel expenses. The benefits for companies include better quality of work and savings in offices and their maintenance.
Parking stalls have increased in number, both charged ones along the sides of roads (+2.9%) and park-and-rides, which aim to encourage the use of public transport within the city centres (+6.1%). The latter have increased in particular in Rovigo, and in Padova especially because of the new tram.
It should be mentioned that pedestrian areas have decreased in Veneto (-0.3%), in contrast with the national trend (+0.3%), whereas cycle paths have seen an above-average growth (+7.4%). Verona and Padova both encourage the use of the bicycle as an alternative means of getting around as cycle paths here have increased enormously.
Pedestrianisation is still one of the best strategies for improving urban mobility: it can reap both short and long-term benefits in terms of air quality, noise pollution and much more besides. Furthermore, increasing pedestrian areas improves road safety since it is in the urban centres where most road accidents occur. Whatever means of transport we use, we are all also pedestrians as we always have to walk at least a little. In the nation as a whole, the share of non-motorised journeys equals 21.6% of the total, and is on the increase in urban centres. Paradoxically however, there is still little regard for pedestrians, despite their numbers, with a national average of 34 m2 of pedestrian area per 100 inhabitants. Veneto does seem to have a good supply of pedestrian areas. Venezia has over 100 m2 per 100 inhabitants, but this is an exception because its historical centre is made up of one big pedestrian area. Padova has an above-average amount; the other cities in the region are less well-off. Rovigo is one of the worst-off cities in Italy in this regard. The lack of pedestrian areas there can, however, be justified by the fact that traffic in the city itself is much calmer.
Apart from the numerous environmental advantages a project of this type would bring about, we should also take into consideration the marvellous advertising opportunity for the city as a tourist destination.
The project aims to reduce the number of journeys made to transport goods through filling the vehicles up more. The vehicles themselves are extremely ecological as they mainly run on methane.
In the last two years 119,500 deliveries have been made in the Padova area, for a total of almost 705,000 parcels. In 2010 alone there were an average of around 29,500 per month, compared to 2009 the number of deliveries made decreased (-3.12%) but the number of parcels reaching their destination increased (+0.96%). This shows that there is a propensity towards rationalising transport, with vehicles travelling fully loaded, in this way reducing wastages of time and resources.
This provides therefore a new service for goods-transport operators, which should improve delivery flows and at the same time make the city more liveable.
This model has been regarded with enthusiasm by other local councils such as Mestre, Treviso and also Modena, Aosta and Como, which are now working towards adopting this service within their own cities.
Within the context of initiatives towards redistributing the use of different means of transport, last January Veneto's Regional Councillor for Mobility reapproved the agreement with the president of Sistemi Territoriali, the association which manages the waterways and railways in Veneto, which provides for reductions in fees for goods transport within Veneto if carried out by rail or on the water. This initiative, which has been running for around 5 years so far, has enabled the organisation of 1,565 goods trains overall along the routes of Venezia Porto Commerciale-Milano Certosa/Milano Melzo, Portogruaro-Pontelongo/Pontelagoscuro, for a total of 275,433 trains/km. On the waterways, at Rovigo's inland port around 178,226 tonnes of goods coming from or going to ports in Veneto were shifted.
There are a few elements which seem to indicate that sustainability in goods transport might be more difficult to achieve than in passenger transport or mobility of individuals. Indeed, as road transport is more economical than rail transport, it will continue to be the main means chosen, even though it is less environmentally friendly. Furthermore, the tendency towards favouring consumer products rather than large quantities leads to an increase in the volume of goods and, as a consequence, a greater number of journeys for a particular quantity and, since decisions about goods transport involve a lower number of persons, they are less homogeneous and the transition phases following on from policy variations are less linear.
Railways have always given priority to passenger transport compared to goods transport and innovations have always regarded passenger as opposed to goods transport. If, on the one hand, the EU rail-passenger market benefits from significant investments for the construction of high-speed routes, goods transport has not yet evolved in that direction.
Figure 15.3.1

Figure 15.3.2

Figure 15.3.3
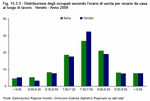
Figure 15.3.4
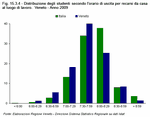
Table 15.3.1
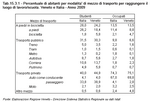
Table 15.3.2

Table 15.3.3

Figure 15.3.5

Figure 15.3.6

Figure 15.3.7

Table 15.3.4

Figure 15.3.8
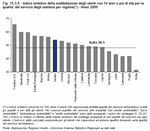
Figure 15.3.9
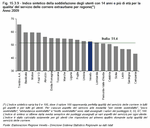
Figure 15.3.10
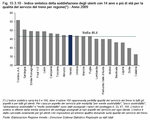
Table 15.3.5
