Chapter 12
The environment from the global to the local dimension: the ongoing transformations
The 18th Conference of the Parties to the UN Framework Convention on Climate Change (Unfccc) (Note 1) was held in Doha, Qatar in December 2012. This had some important objectives, including laying the foundations for the continuation of the Kyoto Protocol, the so-called second commitment period and consolidating the agreements on long-term cooperation and those relating to support to be given to the developing countries.
The first objective, the Kyoto Protocol, saw the adoption of a specific amendment for the institution of the second commitment period commencing from 1 January 2013. This amendment was signed by 37 countries (including almost all the members of the European Union) with legally binding commitments for an overall reduction of greenhouse gas emissions by 18%, compared to 1990 values, in the period from 1 January 2013 to 31 December 2020. The countries also confirmed the commitment of moving ahead with a global agreement on the climate changes that involve all, commencing from 2020, and to be already concluded by 2015. As much as support to developing countries is concerned, the industrialised countries confirmed their commitment to contribute financially so as to achieve an overall allocation of 100 billion dollars per annum for mitigation and adaption from 2020 onwards.
These results, though important, are alone insufficient and at this point concrete actions are also needed within a global planning framework, without which any activity runs the risk of remaining confined in its micro dimension, making too marginal improvements, if not almost irrelevant in some cases.
An important question still remains open: all the commitments made involve countries that, together, contribute only by 15% to the total greenhouse gas emissions, while the United States, China, India, Brazil and South Africa still remain out.
We will pass from the global to the European dimension, where the commitment to safeguarding the environment is particularly strong. On 29 November 2012, the European Commission adopted the proposal for a decision of the European Parliament and Council on the Seventh European Environment Action Programme, to 2020 which is called "Living well, within the limits of our planet." In this it is sought to work on several fronts, i.e. environmental sustainability, efficient use of resources and the economic opportunities deriving therefrom. A transformation of the economic system is still in place and it is fundamental to be successful in increasingly integrating this in a green context of protection and conservation of the planet's natural resources. There are multiple aspects characterising the interactions between civility and the environment: producing wealth requires energy, energy requires resources and, lastly, wealth produces waste. The actions undertaken by the European Union to that effect impact precisely on this process in a perspective of both reduction of the energy consumption and "waste." In parallel, the transformation of the production processes and supply of environmentally sustainable products is leading to improvements, still slow, with regard to the emissions of pollutants into the air, water and subsoil.
Another important trend being pursued is the reduction of waste, on the one hand thanks to greater efficiency in the production and on the other by reutilising the waste as a new resource. From the transformation of the economy to that of lifestyle and cities where we live is a short step. There are many actions undertaken in the environmental field, which involve a variety of aspects and players: from more systematic and precise monitoring of the territory where we live, of the water that we drink and of the air that we breath, to planning for reducing the environmental impacts of anthropic activities, both in response to EU directives and to the precise needs of the specific area. The framework so obtained appears slightly fragmentised as the environmental sector still suffers from a basic weakness with regard to planning at the national level, from which many actions derive that are not always interlinked, or in any event part of a single design and agreed among the various territorial authorities. The positive side, however, is the growing attention paid to what is already a real sector although not traditionally codified yet.
Turning our attention to the various issues characterising the environment, we will now define an overview on the air quality, as well the water quality and the situation relating to the production and management of waste in the Veneto Region. Finally, we shall provide a picture, though partial, of electricity consumption and the progress on the transformation process of the traditional energy production systems into environmentally sustainable systems through the use of renewable sources.
The environment that surrounds us depends on many factors that impact on our daily life. One of these is the air we breathe. The presence of pollutants in the air determines a decrease in the overall quality of the environment around us.
Assessment of air quality is carried out by comparing the concentration values of the pollutants with some reference limits and through the study of emission sources and their location within the territory, taking into account its specific characteristics.
As for the control of the air pollution, the Directive 2008/50/EC represents the bridgehead. This is based on the Sixth Community Environment Action Programme, which provides guidelines to the various Member States of the European Union for the creation of a common approach to the fight against pollution. The study of the location of the pollution sources allows the areas of a territory with a similar air condition and pressure levels to be identified. In this regard, in the preambles of the Directive it is indicated that it is appropriate to classify the territory of each Member State into zones or agglomerates that have common characteristics from the territory, environment and pressure point of view. Furthermore, "for zones and agglomerations where the conditions are particularly difficult, it should be possible to postpone the deadline for compliance with the air quality limit values in cases where, notwithstanding the implementation of appropriate pollution abatement measures, acute compliance problems exist in specific zones or agglomerations." In this perspective it is obvious that planning takes a fundamental role for the achievement of the pollution reduction targets.
Other EU regulations are aimed at the reduction of air pollutant emissions originating from specific sources, such as: transport, the industrial sector, production of paints and body shop products.
Specifically, with regard to transport, these are responsible for about a third of the total consumption of energy in the Member Countries and of more than a fifth of the greenhouse gas emissions. They are also responsible for a big portion of urban air pollution. On the one hand, the means of transport are increasingly efficient and less polluting, but despite this, on the other hand, there has been recorded such high growth of the transport means that has led to an overall increase both in energy consumption and in greenhouse gas emissions. Actually, if attention is focused on the main pollutants, it can be seen that the critical aspects have changed over the years. If, until 20 years ago carbon moNOxide represented one of the main problems to be faced in road transport, the introduction of catalytic silencers has progressively reduced this problem. Today, the largest problems are related to the emissions of very fine dust (particulate matter - PM10, PM2.5) and ozone for which the trend does not show any significant improvements since 1997.
The industrial sector, on its part, contributes particularly to the air pollution in Europe in terms of greenhouse gas emissions, acidifying substances, exhaust emissions and waste.
Definition of the specific objectives for pollutants reduction that each Member State must adopt with its own domestic laws is of fundamental importance. Italy, on its part, has defined these strategic objectives for air quality with Legislative Decree no.155 of 2010, implementing Directive 2008/50/EC, and the recent Legislative Decree no. 250/2012 as amendment and integration to the aforesaid 155/2010. In detail, these objectives regard:
The Veneto Region has started the updating the applicable Regional Air Protection and Recovery Plan so as to be in line with the new European Directive and related Legislative Decree 155/2010.
Alongside the strategic objectives, the sectors on which to operate and relating operation objectives have been identified. (Table 12.1.2)
What is the current situation of the air that we breathe in Veneto and the relative trend over the years?
Let us examine here some pollutants of particular interest and topicality, such as the very fine dust (PM10), ozone (O3) and greenhouse gases.
With regard to PM10, the first figure that we shall analyse is that of the annual averages in the traffic/industrial (Note 2) and background stations. (Note 3) A long-term reduction trend up to 2010 can be immediately observed, with the averages within the limit of 40µg/m3 since 2007 for the background stations and since 2009 for those in traffic or industrial zones. In both cases, 2011 has seen a worsening of the situation compared to 2010, especially in the case of the traffic/industrial stations for which the average returned to be above the target level. (Figure 12.1.1)
From the detail of some specific control units placed particularly in urban and urban traffic contexts, the overall averages can generally be confirmed, i.e. a downward trend until 2010 and then an upsurge of the average values of the PM10 concentrations in 2011. For the particular typology of the zones where these control units are located, i.e. where population, traffic and industrial densities are relatively high, greater criticalities are evident with average annual values often above the threshold of 40µg/m3 established by the Legislative Decree 155/2010 for the PM10. In 2011 the only two control units among those under examination with values within the limits are those of Belluno-city and Venezia-Parco Bissuola, respectively with PM10 concentrations of 23 and 39µg/m3. (Figure 12.1.2)
Lastly, we will look at the more critical aspect relating to very fine dust, i.e. the exceeding of the daily limit of 50µg/m3 during a year. According to Legislative Decree 155/2010 these excesses must not be more than 35. As can be seen from the trend, here also there was a long-term fall up to 2010 and then a new rise in 2011. Only the control unit placed in Belluno-city was almost constant and registered a number excesses below 35. (Figure 12.1.3)
In general, a worsening can be seen in the last year that interrupted the positive trend of the preceding five years. This phenomenon can be partially explained by taking into consideration that the problem of very fine dust, a part from the quantity that is emitted into the atmosphere, is also that of the stagnation thereof and this is strictly linked to the surrounding climate conditions.
The climate of the Po Valley favours the permanence of the PM10 particles in the air, and, in addition to this, there was a particular situation in 2011 that saw, contrary to the standard, a winter period characterised by the months of February, November and December with high pressure and rather stagnant air, which certainly did not favour the dispersion of the very fine dust.
As for the ozone (O3), this is present both in the ozonosphere, i.e. the lower part of the stratosphere at an altitude of about 25 km in which it acts as a filter for UV rays and, as polluting gas produced by anthropic activities, in the lower layers of the atmosphere. Containment of the O3 concentrations in these lower layers of the stratosphere is amongst the objectives for reduction of greenhouse gasses.
Legislative Decree 155/2010 fixed some thresholds for O3 concentration in the air for the protection of human health. Specifically, provided are an alarm threshold (240µg/m3), defined as the level over which there is already a risk to human health for a brief period of exposition, the information threshold (180µg/m3), defined as the level over which there is a risk to human health and for some particularly sensitive groups of the population, and the long-term objective that provides for a daily average over 8 hours not exceeding 120µg/m3, which represents the ozone concentration below which direct dangerous effects on human health or vegetation are considered improbable. The general situation appears rather up and down, though no exceeding of the alarm threshold was recorded during 2011.
The O3 concentrations are heavily influenced by the climate conditions. In summer, the strong solar radiation, high temperatures, presence of high pressure and low ventilation are all phenomena that favour stagnation and the accumulation of the pollutants that originate formation of O3. In light of these considerations, the aforesaid fluctuating trend can be better understood. Focusing on the information threshold and, specifically, on some control units located in context and urban traffic zone, it is noted that in 2011 there was a reduction trend of the number of the excesses of the 180µg/m3 value. This phenomenon is due to a favourable weather situation, which saw, in the typically more critical periods of June and July, the passing of diverse perturbations that mitigated the heat and therefore the favourable conditions for persistence of O3 concentrations. (Figure 12.1.4)
To this point the current situation has been investigated and most attention paid to the climatic factor. However, the other face of the coin, i.e. the quantity of substance emissions into the air, must also be considered. It is being sought to take action on this point to improve the overall situation. Certainly monitoring is a first step so as to always have the right perception of the current situation. At regional level an inventory of the emissions into the atmosphere was created (see INEMAR Veneto Arpav) presently populated with the estimates of the emissions for 2005.
Under examination here are the figures referring to very fine dust (PM10) and the precursors of ozone, or rather nitrogen oxides (NOx) and the organic compounds (COV).
With regard to PM10, though in the absence of a limit on emissions imposed by general regulations that include both laws and regulations, there are however some regulations on the overall emissions from production activities and road transport. An instrument for assessment of the situation is supplied by the INEMAR (Note 4) database in which the Veneto Region participates together with 7 other Italian regions (Note 5). Presently, 2005 is the only year for which monitoring is available and consequently it is not possible to study a trend. Nevertheless, how the various sectors contribute to the emissions of very fine dust can be delineated. It can immediately be seen that the greater part of PM10 is emitted into the atmosphere from the non-industrial combustion sector, with over 40% of the total, followed by road transport with 25%. (Table 12.1.3)
As for greenhouse gases in Italy the limits of emissions to be achieved by 2010 were defined by Legislative Decree 171/04, implementing the "National Emission Ceilings" Directive (2001/81/EC) (Note 6). In detail these are: 990 kilo tonnes (kt) per annum for NOx and 1,159 kt for COV. Instead, emission ceilings at regional level are not established by the applicable regulations. The situation sees the use of solvents as the major culprit in the release of the volatile organic compounds, with almost 35% of the total emissions, followed by agriculture with 18.8% and non-industrial combustion with 14.3%. Road transport is stabilised in fourth place with 13.7%.
Instead, nitrogen oxides are mainly from road transport with almost 45% of total emissions and, to follow, other mobile sources and machinery (14.5%), energy production and transformation of fuels (14.4%) and industrial combustion with 14.3%. (Table 12.1.4)
Assessment of air quality is carried out by comparing the concentration values of the pollutants with some reference limits and through the study of emission sources and their location within the territory, taking into account its specific characteristics.
As for the control of the air pollution, the Directive 2008/50/EC represents the bridgehead. This is based on the Sixth Community Environment Action Programme, which provides guidelines to the various Member States of the European Union for the creation of a common approach to the fight against pollution. The study of the location of the pollution sources allows the areas of a territory with a similar air condition and pressure levels to be identified. In this regard, in the preambles of the Directive it is indicated that it is appropriate to classify the territory of each Member State into zones or agglomerates that have common characteristics from the territory, environment and pressure point of view. Furthermore, "for zones and agglomerations where the conditions are particularly difficult, it should be possible to postpone the deadline for compliance with the air quality limit values in cases where, notwithstanding the implementation of appropriate pollution abatement measures, acute compliance problems exist in specific zones or agglomerations." In this perspective it is obvious that planning takes a fundamental role for the achievement of the pollution reduction targets.
Other EU regulations are aimed at the reduction of air pollutant emissions originating from specific sources, such as: transport, the industrial sector, production of paints and body shop products.
Specifically, with regard to transport, these are responsible for about a third of the total consumption of energy in the Member Countries and of more than a fifth of the greenhouse gas emissions. They are also responsible for a big portion of urban air pollution. On the one hand, the means of transport are increasingly efficient and less polluting, but despite this, on the other hand, there has been recorded such high growth of the transport means that has led to an overall increase both in energy consumption and in greenhouse gas emissions. Actually, if attention is focused on the main pollutants, it can be seen that the critical aspects have changed over the years. If, until 20 years ago carbon moNOxide represented one of the main problems to be faced in road transport, the introduction of catalytic silencers has progressively reduced this problem. Today, the largest problems are related to the emissions of very fine dust (particulate matter - PM10, PM2.5) and ozone for which the trend does not show any significant improvements since 1997.
The industrial sector, on its part, contributes particularly to the air pollution in Europe in terms of greenhouse gas emissions, acidifying substances, exhaust emissions and waste.
Definition of the specific objectives for pollutants reduction that each Member State must adopt with its own domestic laws is of fundamental importance. Italy, on its part, has defined these strategic objectives for air quality with Legislative Decree no.155 of 2010, implementing Directive 2008/50/EC, and the recent Legislative Decree no. 250/2012 as amendment and integration to the aforesaid 155/2010. In detail, these objectives regard:
- the achievement of the annual and daily limit value for PM10;
- the achievement of the annual limit value for PM2.5;
- the achievement of the annual limit value for nitrogen dioxide NO2;
- the attainment of the target value and long-term objective for ozone O3;
- the attainment of the target value for benzopyrene;
- the attainment of the national objective for reduction of greenhouse gas emissions.
The Veneto Region has started the updating the applicable Regional Air Protection and Recovery Plan so as to be in line with the new European Directive and related Legislative Decree 155/2010.
Alongside the strategic objectives, the sectors on which to operate and relating operation objectives have been identified. (Table 12.1.2)
What is the current situation of the air that we breathe in Veneto and the relative trend over the years?
Let us examine here some pollutants of particular interest and topicality, such as the very fine dust (PM10), ozone (O3) and greenhouse gases.
With regard to PM10, the first figure that we shall analyse is that of the annual averages in the traffic/industrial (Note 2) and background stations. (Note 3) A long-term reduction trend up to 2010 can be immediately observed, with the averages within the limit of 40µg/m3 since 2007 for the background stations and since 2009 for those in traffic or industrial zones. In both cases, 2011 has seen a worsening of the situation compared to 2010, especially in the case of the traffic/industrial stations for which the average returned to be above the target level. (Figure 12.1.1)
From the detail of some specific control units placed particularly in urban and urban traffic contexts, the overall averages can generally be confirmed, i.e. a downward trend until 2010 and then an upsurge of the average values of the PM10 concentrations in 2011. For the particular typology of the zones where these control units are located, i.e. where population, traffic and industrial densities are relatively high, greater criticalities are evident with average annual values often above the threshold of 40µg/m3 established by the Legislative Decree 155/2010 for the PM10. In 2011 the only two control units among those under examination with values within the limits are those of Belluno-city and Venezia-Parco Bissuola, respectively with PM10 concentrations of 23 and 39µg/m3. (Figure 12.1.2)
Lastly, we will look at the more critical aspect relating to very fine dust, i.e. the exceeding of the daily limit of 50µg/m3 during a year. According to Legislative Decree 155/2010 these excesses must not be more than 35. As can be seen from the trend, here also there was a long-term fall up to 2010 and then a new rise in 2011. Only the control unit placed in Belluno-city was almost constant and registered a number excesses below 35. (Figure 12.1.3)
In general, a worsening can be seen in the last year that interrupted the positive trend of the preceding five years. This phenomenon can be partially explained by taking into consideration that the problem of very fine dust, a part from the quantity that is emitted into the atmosphere, is also that of the stagnation thereof and this is strictly linked to the surrounding climate conditions.
The climate of the Po Valley favours the permanence of the PM10 particles in the air, and, in addition to this, there was a particular situation in 2011 that saw, contrary to the standard, a winter period characterised by the months of February, November and December with high pressure and rather stagnant air, which certainly did not favour the dispersion of the very fine dust.
As for the ozone (O3), this is present both in the ozonosphere, i.e. the lower part of the stratosphere at an altitude of about 25 km in which it acts as a filter for UV rays and, as polluting gas produced by anthropic activities, in the lower layers of the atmosphere. Containment of the O3 concentrations in these lower layers of the stratosphere is amongst the objectives for reduction of greenhouse gasses.
Legislative Decree 155/2010 fixed some thresholds for O3 concentration in the air for the protection of human health. Specifically, provided are an alarm threshold (240µg/m3), defined as the level over which there is already a risk to human health for a brief period of exposition, the information threshold (180µg/m3), defined as the level over which there is a risk to human health and for some particularly sensitive groups of the population, and the long-term objective that provides for a daily average over 8 hours not exceeding 120µg/m3, which represents the ozone concentration below which direct dangerous effects on human health or vegetation are considered improbable. The general situation appears rather up and down, though no exceeding of the alarm threshold was recorded during 2011.
The O3 concentrations are heavily influenced by the climate conditions. In summer, the strong solar radiation, high temperatures, presence of high pressure and low ventilation are all phenomena that favour stagnation and the accumulation of the pollutants that originate formation of O3. In light of these considerations, the aforesaid fluctuating trend can be better understood. Focusing on the information threshold and, specifically, on some control units located in context and urban traffic zone, it is noted that in 2011 there was a reduction trend of the number of the excesses of the 180µg/m3 value. This phenomenon is due to a favourable weather situation, which saw, in the typically more critical periods of June and July, the passing of diverse perturbations that mitigated the heat and therefore the favourable conditions for persistence of O3 concentrations. (Figure 12.1.4)
To this point the current situation has been investigated and most attention paid to the climatic factor. However, the other face of the coin, i.e. the quantity of substance emissions into the air, must also be considered. It is being sought to take action on this point to improve the overall situation. Certainly monitoring is a first step so as to always have the right perception of the current situation. At regional level an inventory of the emissions into the atmosphere was created (see INEMAR Veneto Arpav) presently populated with the estimates of the emissions for 2005.
Under examination here are the figures referring to very fine dust (PM10) and the precursors of ozone, or rather nitrogen oxides (NOx) and the organic compounds (COV).
With regard to PM10, though in the absence of a limit on emissions imposed by general regulations that include both laws and regulations, there are however some regulations on the overall emissions from production activities and road transport. An instrument for assessment of the situation is supplied by the INEMAR (Note 4) database in which the Veneto Region participates together with 7 other Italian regions (Note 5). Presently, 2005 is the only year for which monitoring is available and consequently it is not possible to study a trend. Nevertheless, how the various sectors contribute to the emissions of very fine dust can be delineated. It can immediately be seen that the greater part of PM10 is emitted into the atmosphere from the non-industrial combustion sector, with over 40% of the total, followed by road transport with 25%. (Table 12.1.3)
As for greenhouse gases in Italy the limits of emissions to be achieved by 2010 were defined by Legislative Decree 171/04, implementing the "National Emission Ceilings" Directive (2001/81/EC) (Note 6). In detail these are: 990 kilo tonnes (kt) per annum for NOx and 1,159 kt for COV. Instead, emission ceilings at regional level are not established by the applicable regulations. The situation sees the use of solvents as the major culprit in the release of the volatile organic compounds, with almost 35% of the total emissions, followed by agriculture with 18.8% and non-industrial combustion with 14.3%. Road transport is stabilised in fourth place with 13.7%.
Instead, nitrogen oxides are mainly from road transport with almost 45% of total emissions and, to follow, other mobile sources and machinery (14.5%), energy production and transformation of fuels (14.4%) and industrial combustion with 14.3%. (Table 12.1.4)
Table 12.1.1
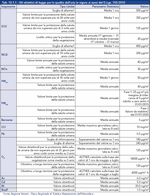
Table 12.1.2
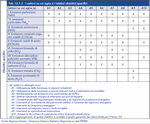
Figure 12.1.1
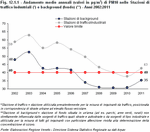
Figure 12.1.2
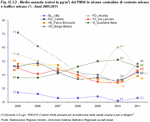
Figure 12.1.3
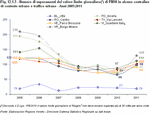
Figure 12.1.4
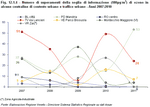
Table 12.1.3

Table 12.1.4

The other big environmental issue is water, that includes many different aspects:
from the availability of drinking water resources to the quality of the same, from the suitability of water bodies for swimming, to aquatic flora and fauna.
The sustainable use of these limited resources is becoming an increasingly pressing problem as the difference between demand and offer increases. This is due to many factors, in particular global population growth and therefore the increasing needs of said population, hydrogeological transformation caused by climate changes, and poor economic management of water resources where a low price encourages wastage. Something is changing though, especially in the way we are trying to deal with the problem at an international level. We are beginning to realise just how important more rational water management policies are, and the UN declared 2013 "international year of water cooperation.".
In the European Union, water policy was first discussed in the 1990's. This concerns two different but closely related themes: the adoption of a "common" environmental strategy at a European level and creating a single integrated market in the public services sector.
On this first theme, the core of water policy has been built on water as a natural resource to be preserved in a good ecological status (water quality), protecting it against hyper-exploitation and contamination by pollution. In 2000, the European Parliament and the Council approved the EU Water Directive Framework (the WDF 2000/60/EC - 23/10/2000), the main objective of which was to establish 2015 as the year in which all EU Members States are required to achieve a "good" status for their water resources. For this purpose, the Directive required States to present their «River basin management plans» by 2009. The Directive required the plans to be implemented by 2012 and, according to the deadlines established, progress made would be examined in 2013, also to find solutions for any obstacles that could prevent reaching the 2015 objective. Therefore, in November 2012, the European Commission drew up "The Blueprint to Safeguard Europe's Water resources", often called "The Water Blueprint". According to the studies done by the European Environment Agency, in 2010, only 43% of waters achieved a "good" status, and the estimate for 2015 is 53%.
To address the problem of water scarcity, the Commission proposes two series of responses/measures to adopt. First of all, implement price policies that encourage efficient water usage. The Plan should set the right price for water, also because not applying a price to a limited resource such as water is harmful for the environment. Secondly, promote technologies and practices for efficient water use, in line with the general water efficiency objective established in the framework of the "Europe 2020 Strategy."
Veneto has a wealth of water resources: lakes, rivers, springs and the Adriatic Sea. The vastness of this wealth also means great responsibility in terms of protection and control. In this document we will provide an albeit partial picture of the current condition of Veneto waters with particular reference to those suitable for swimming, the exploitation of water resources, drinking water use and management.
The monitoring of waters used for swimming shows a certainly positive situation, as most of the points where samples were taken can be classified as excellent. The few cases in which waters could not be classified as "excellent" are mostly somewhere between "good" and "excellent", and therefore in line with EEC objectives.
Another important aspect is the importance of drinking water control.
The Local Health Authorities have plans for controlling the entire water distribution network and declare whether the water is suitable for drinking or not.
One of the chemical parameters analysed in drinking water is the concentration of nitrates. In the natural state, these can be found in very low concentrations in water. Concentrations of over 9 mg/l for underground waters and 18 mg/l for surface waters usually indicate the presence of anthropic contamination, zoo-technical activities or the use of fertilizers for example. According to the legislation in force, Italian Legislative Decree 31/2001, the concentration of nitrates in tap water must be no higher than 50 mg/l.
Throughout the region the concentration average values were always lower than the threshold of 50 mg/l. Dividing the available data into 4 classes (Note 7) and analysing the trend in time of the percentage of municipalities in each class, we can see that the general situation is quite stable, with a slight increase in 2012 of the two best compared to 2007: the percentage of municipalities where concentrations are lower than 5 mg/l increases from 40.1 to 41.7% and municipalities where concentrations are from 5 to 15 mg/l increases from 35.2 to 36%. (Figure 12.2.1)
Going back to the theme of water as a resource and common asset to protect, as well as quality monitoring data, water resource management aspects are also of vital importance: from collection to supply, treatment and purification of waste water. Concerning the first two aspects, abstraction and supply, there are actually four separate stages, in other words collection, treatment to make the water potable if necessary, piping into the distribution network, and then supply to the final user. Data on this aspect is collected periodically through specific studies or surveys by Istat at the water services management organisations (Note 8). We currently have access to data on water resources from censuses in 1999 and 2008, and a survey in 2005. A census is currently being prepared for 2012 data.
In 2008, 9.1 billion cubic metres of drinking water were collected in Italy, a growing trend when compared to 1999 and 2005. The same trend can also be found in Veneto, with 678 million cubic meters collected in 1999 and 730 in 2008. The trend changes if we analyse abstraction per capita however. Here, there is a decreasing trend at a national level, with an up-and-down variation in Veneto: 150.3 cubic metres per capita in 1999 dropping to 148.2 in 2005 to settle at 149.4 in 2008. In all cases, the value per capita is just under the Italian average. But just how much weight does Veneto carry in terms of the national total? With reference to 2008, Veneto was the fourth region with greatest impact in terms of drinking water collection with an impact of 8%, and only Campania, Lazio and Lombardy had a greater impact, respectively 9.6, 12.5 and 15.9%. (Figure 12.2.2) (Figure 12.2.3)
Before going into the distribution network, the water collected must be treated to make it suitable for drinking, unless it is already potable at the source. Of the various sources available, underground springs are preferred as the quality is usually better than that of surface waters, and no further treatment is normally required to make the water potable. A low potability index shows there are more good quality water sources underground. In Veneto, the hydrogeological structure is quite favourable in these terms. In fact, the 131 million cubic metres of water treated to be suitable for drinking in 2008 are just 18.1% of total water collected, while the national average in Italy is 32.2%. This makes Veneto the eighth best region on the peninsula when considering which regions have the highest concentration of good-quality drinking water resources, and third among the regions in the north, with only Trentino-Alto Adige and Valle d'Aosta doing better (respectively 17.7 and 12.6% of water treated to make it suitable for drinking). (Figure 12.2.4)
After treatment to make the water suitable for drinking, if necessary, it is then piped into the distribution network. In Italy, of the 9.1 billion cubic metres of water collected in 2008, 8.1 billion are actually piped into the distribution network, in other words 89.4%. In Veneto this percentage is slightly lower, stable at 85.3% (equal to 623 million cubic metres piped into the distribution network of the 730 million collected). If we now look at the per capita figures, 136 m3 of water per inhabitant was piped into the distribution network in 2008 in Italy, but the figures vary considerably from region to region, from 182 m3 in Valle d'Aosta to 101 in Umbria. In Veneto this indicator is stable at 127 m3 per inhabitant. (Figure 12.2.5)
The next stage, after piping the water into the distribution network, is the water supply to the final user. Only a part of the water piped into the distribution network is actually supplied, for many reasons: there is unmetered water for public use, dispersion due to spillage when the available water is too much for the capacity of the reservoirs, water theft and/or unauthorized collection from the network and, last but not least, leaks from piping. The greater the percentage ratio of water supplied compared to that piped into the network, the greater the efficiency of the water system. In 2008, in Italy the efficiency of the drinking water distribution network, in terms of percentage of water supplied compared to that piped into the system, was equal to 68%, slightly lower than the figure of the previous year, although in 2005 it was almost 70%. There is again considerable variation from region to region, with values that range from 53.4% in Puglia to 78.9% in Lombardy. In 2008, Veneto was the seventh most efficient region at 70%, a value 4.4 percentage points lower than the 2005 figure, however. (Figure 12.2.6)
The last stage in the process of transformation and use of water is the treatment and purification of waste water. Directive 91/271/EEC defines the agglomerations and requirements for urban waste water collection and drainage. In particular, agglomerations are defined as "areas where the population and/or economic activities are sufficiently concentrated for urban waste water to be collected and conducted to an urban waste water treatment plant or to a final discharge point." As for the requirements, Italian Legislative Decree No. 152/1999 implementing Directive 91/271/EEC, of 31 December 2005 requires drainage systems in all agglomerations with a generated Population Equivalent (PE) (Note 9) load of over 2,000. There were 223 Veneto agglomerations with over 2,000 PE in 2009. These 2,000 + PE agglomerations can be split into 4 distinct classes:
To deal with the waste water produced by the 223 Veneto agglomeration with over 2,000 PE, there are 232 treatment plants with a potential capacity of over 2,000 PE, and another 283 smaller plants (less than 2,000 PE). (Table 12.2.1)
One thing that is still not entirely clear is the actual coverage in terms of waste water collection. The main European objective, aside from the target set by the legislation, is in fact for all agglomerations to have waste water drainage systems. The "degree of collection" for agglomerations measures whether or not they meet the requirements of the Directive: this indicator is measured as a percentage of the generated load actually collected in the drainage system, and the target to reach is at least 95%. The situation in Veneto is constantly changing, as can be seen from the figures. Starting from 2005, the first year for which data is available, we can see that only 16% of the agglomerations reached a degree of collection of at least 95%. In 2009, the last year for which data is available, the situation has improved considerably. In fact the number of agglomerations has been revised and there are now 223, and more than 30% of these are above threshold requirements. In consideration of these figures, we are making progress but there is still a lot of work to do if we wish to obtain optimal results. (Table 12.2.2)
What exactly is the situation in terms of waste water treatment? The last stage in the water supply process is essential to prevent pollution of the water sources themselves. The waste water is treated in three specific types of plants, depending on the degree of treatment they can provide: the "lowest" level are first level plants with partial waste treatment, a mechanical process based on separation and removal using mechanical elements and forces (grids, sedimentation for example); in second level biological plants certain pollutants are eliminated by micro-organisms (mainly bacteria); and lastly, third level chemical or chemical-physical plants eliminate pollutants using chemical reactions (oxidation, neutralization) in combination with physical processes (absorption, flocculation, stripping).
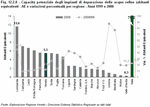
In 2008, the potential overall capacity of the plants in Italy amounted to 75.2 million PE (Population Equivalent), a value which, compared to 61.4 million PE of 1999, indicates an improvement by 12.7%. Veneto, with a potential capacity equal to 5 and a half million PE, again in 2008, has an improvement index on 1999 equal to 12.4%, close to the national average. (Figure 12.2.8)
Among the initiatives aimed at protecting water resources, the Regional Council of Veneto with the Veneto Regional Councillorship for the Environment and the Union of Reclamation Consortia of the Veneto Region, in partnership with the Associazione Monastero del Bene Comuneand the Universitą del Bene Comune in 2013 are the promoters of three Regional Public Hearings on Water (APRA). These hearings, as an alternative to a conventional conference, will promote acquiring awareness and knowledge needed to define future regional policies through meetings with institutions and citizens at a regional level. The first hearing, held in Padua on 22nd March (World Water Day), focused on the theme of European standards and regulations, major critical points and opportunities, possible developments and consequences at a regional level. The second hearing was in Longarone on 24th June, and the theme was "Water and Italy. Relationships and reciprocal influence between regional and national policies." Finally, the third hearing, to be held in Verona will focus on defining the guidance, guidelines, actions and concrete initiatives to be promoted at a regional level on the basis of the findings of the previous two hearings.
from the availability of drinking water resources to the quality of the same, from the suitability of water bodies for swimming, to aquatic flora and fauna.
The sustainable use of these limited resources is becoming an increasingly pressing problem as the difference between demand and offer increases. This is due to many factors, in particular global population growth and therefore the increasing needs of said population, hydrogeological transformation caused by climate changes, and poor economic management of water resources where a low price encourages wastage. Something is changing though, especially in the way we are trying to deal with the problem at an international level. We are beginning to realise just how important more rational water management policies are, and the UN declared 2013 "international year of water cooperation.".
In the European Union, water policy was first discussed in the 1990's. This concerns two different but closely related themes: the adoption of a "common" environmental strategy at a European level and creating a single integrated market in the public services sector.
On this first theme, the core of water policy has been built on water as a natural resource to be preserved in a good ecological status (water quality), protecting it against hyper-exploitation and contamination by pollution. In 2000, the European Parliament and the Council approved the EU Water Directive Framework (the WDF 2000/60/EC - 23/10/2000), the main objective of which was to establish 2015 as the year in which all EU Members States are required to achieve a "good" status for their water resources. For this purpose, the Directive required States to present their «River basin management plans» by 2009. The Directive required the plans to be implemented by 2012 and, according to the deadlines established, progress made would be examined in 2013, also to find solutions for any obstacles that could prevent reaching the 2015 objective. Therefore, in November 2012, the European Commission drew up "The Blueprint to Safeguard Europe's Water resources", often called "The Water Blueprint". According to the studies done by the European Environment Agency, in 2010, only 43% of waters achieved a "good" status, and the estimate for 2015 is 53%.
To address the problem of water scarcity, the Commission proposes two series of responses/measures to adopt. First of all, implement price policies that encourage efficient water usage. The Plan should set the right price for water, also because not applying a price to a limited resource such as water is harmful for the environment. Secondly, promote technologies and practices for efficient water use, in line with the general water efficiency objective established in the framework of the "Europe 2020 Strategy."
Veneto has a wealth of water resources: lakes, rivers, springs and the Adriatic Sea. The vastness of this wealth also means great responsibility in terms of protection and control. In this document we will provide an albeit partial picture of the current condition of Veneto waters with particular reference to those suitable for swimming, the exploitation of water resources, drinking water use and management.
The monitoring of waters used for swimming shows a certainly positive situation, as most of the points where samples were taken can be classified as excellent. The few cases in which waters could not be classified as "excellent" are mostly somewhere between "good" and "excellent", and therefore in line with EEC objectives.
Another important aspect is the importance of drinking water control.
The Local Health Authorities have plans for controlling the entire water distribution network and declare whether the water is suitable for drinking or not.
One of the chemical parameters analysed in drinking water is the concentration of nitrates. In the natural state, these can be found in very low concentrations in water. Concentrations of over 9 mg/l for underground waters and 18 mg/l for surface waters usually indicate the presence of anthropic contamination, zoo-technical activities or the use of fertilizers for example. According to the legislation in force, Italian Legislative Decree 31/2001, the concentration of nitrates in tap water must be no higher than 50 mg/l.
Throughout the region the concentration average values were always lower than the threshold of 50 mg/l. Dividing the available data into 4 classes (Note 7) and analysing the trend in time of the percentage of municipalities in each class, we can see that the general situation is quite stable, with a slight increase in 2012 of the two best compared to 2007: the percentage of municipalities where concentrations are lower than 5 mg/l increases from 40.1 to 41.7% and municipalities where concentrations are from 5 to 15 mg/l increases from 35.2 to 36%. (Figure 12.2.1)
Going back to the theme of water as a resource and common asset to protect, as well as quality monitoring data, water resource management aspects are also of vital importance: from collection to supply, treatment and purification of waste water. Concerning the first two aspects, abstraction and supply, there are actually four separate stages, in other words collection, treatment to make the water potable if necessary, piping into the distribution network, and then supply to the final user. Data on this aspect is collected periodically through specific studies or surveys by Istat at the water services management organisations (Note 8). We currently have access to data on water resources from censuses in 1999 and 2008, and a survey in 2005. A census is currently being prepared for 2012 data.
In 2008, 9.1 billion cubic metres of drinking water were collected in Italy, a growing trend when compared to 1999 and 2005. The same trend can also be found in Veneto, with 678 million cubic meters collected in 1999 and 730 in 2008. The trend changes if we analyse abstraction per capita however. Here, there is a decreasing trend at a national level, with an up-and-down variation in Veneto: 150.3 cubic metres per capita in 1999 dropping to 148.2 in 2005 to settle at 149.4 in 2008. In all cases, the value per capita is just under the Italian average. But just how much weight does Veneto carry in terms of the national total? With reference to 2008, Veneto was the fourth region with greatest impact in terms of drinking water collection with an impact of 8%, and only Campania, Lazio and Lombardy had a greater impact, respectively 9.6, 12.5 and 15.9%. (Figure 12.2.2) (Figure 12.2.3)
Before going into the distribution network, the water collected must be treated to make it suitable for drinking, unless it is already potable at the source. Of the various sources available, underground springs are preferred as the quality is usually better than that of surface waters, and no further treatment is normally required to make the water potable. A low potability index shows there are more good quality water sources underground. In Veneto, the hydrogeological structure is quite favourable in these terms. In fact, the 131 million cubic metres of water treated to be suitable for drinking in 2008 are just 18.1% of total water collected, while the national average in Italy is 32.2%. This makes Veneto the eighth best region on the peninsula when considering which regions have the highest concentration of good-quality drinking water resources, and third among the regions in the north, with only Trentino-Alto Adige and Valle d'Aosta doing better (respectively 17.7 and 12.6% of water treated to make it suitable for drinking). (Figure 12.2.4)
After treatment to make the water suitable for drinking, if necessary, it is then piped into the distribution network. In Italy, of the 9.1 billion cubic metres of water collected in 2008, 8.1 billion are actually piped into the distribution network, in other words 89.4%. In Veneto this percentage is slightly lower, stable at 85.3% (equal to 623 million cubic metres piped into the distribution network of the 730 million collected). If we now look at the per capita figures, 136 m3 of water per inhabitant was piped into the distribution network in 2008 in Italy, but the figures vary considerably from region to region, from 182 m3 in Valle d'Aosta to 101 in Umbria. In Veneto this indicator is stable at 127 m3 per inhabitant. (Figure 12.2.5)
The next stage, after piping the water into the distribution network, is the water supply to the final user. Only a part of the water piped into the distribution network is actually supplied, for many reasons: there is unmetered water for public use, dispersion due to spillage when the available water is too much for the capacity of the reservoirs, water theft and/or unauthorized collection from the network and, last but not least, leaks from piping. The greater the percentage ratio of water supplied compared to that piped into the network, the greater the efficiency of the water system. In 2008, in Italy the efficiency of the drinking water distribution network, in terms of percentage of water supplied compared to that piped into the system, was equal to 68%, slightly lower than the figure of the previous year, although in 2005 it was almost 70%. There is again considerable variation from region to region, with values that range from 53.4% in Puglia to 78.9% in Lombardy. In 2008, Veneto was the seventh most efficient region at 70%, a value 4.4 percentage points lower than the 2005 figure, however. (Figure 12.2.6)
The last stage in the process of transformation and use of water is the treatment and purification of waste water. Directive 91/271/EEC defines the agglomerations and requirements for urban waste water collection and drainage. In particular, agglomerations are defined as "areas where the population and/or economic activities are sufficiently concentrated for urban waste water to be collected and conducted to an urban waste water treatment plant or to a final discharge point." As for the requirements, Italian Legislative Decree No. 152/1999 implementing Directive 91/271/EEC, of 31 December 2005 requires drainage systems in all agglomerations with a generated Population Equivalent (PE) (Note 9) load of over 2,000. There were 223 Veneto agglomerations with over 2,000 PE in 2009. These 2,000 + PE agglomerations can be split into 4 distinct classes:
- 2,000 PE <= generated load < 15,000 PE
- 15,000 PE <= generated load < 50,000 PE
- 50,000 PE <= generated load < 150,000 PE
- Generated load >= 150,000 PE
To deal with the waste water produced by the 223 Veneto agglomeration with over 2,000 PE, there are 232 treatment plants with a potential capacity of over 2,000 PE, and another 283 smaller plants (less than 2,000 PE). (Table 12.2.1)
One thing that is still not entirely clear is the actual coverage in terms of waste water collection. The main European objective, aside from the target set by the legislation, is in fact for all agglomerations to have waste water drainage systems. The "degree of collection" for agglomerations measures whether or not they meet the requirements of the Directive: this indicator is measured as a percentage of the generated load actually collected in the drainage system, and the target to reach is at least 95%. The situation in Veneto is constantly changing, as can be seen from the figures. Starting from 2005, the first year for which data is available, we can see that only 16% of the agglomerations reached a degree of collection of at least 95%. In 2009, the last year for which data is available, the situation has improved considerably. In fact the number of agglomerations has been revised and there are now 223, and more than 30% of these are above threshold requirements. In consideration of these figures, we are making progress but there is still a lot of work to do if we wish to obtain optimal results. (Table 12.2.2)
What exactly is the situation in terms of waste water treatment? The last stage in the water supply process is essential to prevent pollution of the water sources themselves. The waste water is treated in three specific types of plants, depending on the degree of treatment they can provide: the "lowest" level are first level plants with partial waste treatment, a mechanical process based on separation and removal using mechanical elements and forces (grids, sedimentation for example); in second level biological plants certain pollutants are eliminated by micro-organisms (mainly bacteria); and lastly, third level chemical or chemical-physical plants eliminate pollutants using chemical reactions (oxidation, neutralization) in combination with physical processes (absorption, flocculation, stripping).
In 2008, the potential overall capacity of the plants in Italy amounted to 75.2 million PE (Population Equivalent), a value which, compared to 61.4 million PE of 1999, indicates an improvement by 12.7%. Veneto, with a potential capacity equal to 5 and a half million PE, again in 2008, has an improvement index on 1999 equal to 12.4%, close to the national average. (Figure 12.2.8)
Among the initiatives aimed at protecting water resources, the Regional Council of Veneto with the Veneto Regional Councillorship for the Environment and the Union of Reclamation Consortia of the Veneto Region, in partnership with the Associazione Monastero del Bene Comuneand the Universitą del Bene Comune in 2013 are the promoters of three Regional Public Hearings on Water (APRA). These hearings, as an alternative to a conventional conference, will promote acquiring awareness and knowledge needed to define future regional policies through meetings with institutions and citizens at a regional level. The first hearing, held in Padua on 22nd March (World Water Day), focused on the theme of European standards and regulations, major critical points and opportunities, possible developments and consequences at a regional level. The second hearing was in Longarone on 24th June, and the theme was "Water and Italy. Relationships and reciprocal influence between regional and national policies." Finally, the third hearing, to be held in Verona will focus on defining the guidance, guidelines, actions and concrete initiatives to be promoted at a regional level on the basis of the findings of the previous two hearings.
Figure 12.2.1

Figure 12.2.2

Figure 12.2.3
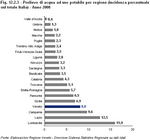
Figure 12.2.4
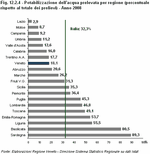
Figure 12.2.5

Figure 12.2.6
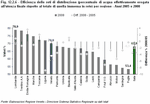
Figure 12.2.7

Table 12.2.1

Table 12.2.2

Figure 12.2.8
Another fundamental environmental issue, as well as a strategic sector in the green economy and in terms of smart cities, is the production, recycling and disposal of waste. Considering the importance of this matter, the European Commission established relevant priorities to be implemented by the EU Member States. These include:
Concerning the first priority, considering that practices have been introduced to reduce packaging (for example with lighter plastic bottles used for drinks and promoting the widespread use of "on tap" systems for the sale of detergents and foodstuffs), since 1997 we have not seen the desired reversal in the trend. If anything, the amount of waste produced is slowly but constantly increasing, with the only slow-down being in 2011, the last year for which data is available, almost certainly due to the economic crisis and the drop in consumption and therefore consumption-related waste. The overall increase in waste production can partly be justified by progressive population growth. Considering per capita waste generation, there is a continuous increase in the trend up to 2008, after which there is a significant reduction in the phenomenon in 2009, with a slight increase once more in 2010 and another drop in 2011. The latest data indicates approximately 465 Kg/person of urban waste produced compared to 497.5 in 2008. Veneto, when compared to the rest of Italy, is overall a fairly positive example, as per capita waste generation is below the national average. In 2010, the last year for which a comparison can be made, in Veneto 488 Kg/person of municipal waste was generated compared to the 536 of the national average for all Italian regions. (Figure 12.3.1)
As well as a reduction in the amount of waste generated, the other priority is waste management, meaning disposal and recovery whenever possible. This has been the direction taken for some years now, and results are just starting to show. First and foremost, as for the waste management, the waste collection system plays a fundamental role in maximizing separate waste collection results, guaranteeing the subsequent specific and optimised treatment of each type of material. We can assess current progress in these terms by observing both the changes in the waste collection systems and the level of separate waste collection reached. An analysis of how waste is processed and the development of waste treatment plants gives an idea of the current efficiency and progressive evolution in this important environmental sector. To continue, let's try to assess the main stages of the waste treatment process. In the first phase, major effort has been put into progressively implementing changes in the waste collection system, attempting to make households aware of the problem with campaigns to promote separate waste collection upstream. There have been concrete results, as data shows: observing the trend for 1999-2011 it is clear that there is a radical transformation throughout the waste collection system in Veneto municipalities: the number of towns where waste is collected separately has more than doubled (+145%) and in particular, there has been a real boom in door-to-door waste collection (with an increase of almost 300%). (Figure 12.3.2)
In 2011 as many as 570 Veneto municipalities out of a total 581 were using separate waste collection systems to separate "dry" and "wet" waste. In particular, 461 municipalities (79.3%) were using door-to-door separate waste collection, 66 "roadside" type collection (in roadside bins) and 43 mixed. Note that, among the municipalities separating wet and dry waste, for those using door-to-door type collection systems, the average separate waste collection value reaches the highest figures, almost 70%, decisively higher than the 63% representing the regional average. (Table 12.3.1)
The result reached in terms of overall separate waste collection is clear: from 28.4% in 2000 there was a constant increase, reaching 60.5% in 2011, passing target of 60% by the 31 December 2011 required by Legislative Decree 152/2006.
In 2011, all the provinces except Venice reached and/or exceeded the 60% target, with some cases truly worthy of mention such as Treviso (74%) and Belluno (66.4%) that also exceeded the last 2012 target, which set a separate waste collection requirement of at least 65% (Figure 12.3.3)(Figure 12.3.4)
The waste is treated after collection, and this gives an idea of the success of the entire waste management sector. In 2001, 39% of the collected urban waste went to the dump, while in 2011 this figure dropped to 8.2%. This is mainly due to the recovery of dry and organic waste, with a respective variation of 19.5 - 33.4% and 15 - 27%. (Figure 12.3.5)
In greater detail, the waste is treated in specialized plants, one for each type of material. In 2011, 623,000 tonnes of organic waste was recovered in 22 dedicated plants. This organic waste was used to produce over 230,000 tonnes of "compost" for the agricultural sector, vegetable and flower growing. As for dry waste that can be recycled (paper, glass, plastic and metal packaging), 631,000 tonnes were collected with extremely high percentages recovered such as 92% for plastic and as much as 99% for metal packaging. One figure worthy of mention is the 133,000 tonnes of separate dry waste divided by wood, metallic scrap, waste electrical and electronic equipment (WEEE). Dry municipal waste that cannot be recycled, bulk waste and waste from road sweeping amounts to 23.2%. This waste is sent to biological treatment plants or plants using other treatments for the recovery of raw materials, the production of energy-from-waste or disposal. 159,000 tonnes of Waste-Derived Fuel (WDF) was obtained from biological-mechanical treatment. Again in 2011, 8.1% equal to 188,000 tonnes of the urban waste treated was incinerated, a decrease on the 2010 figure, both in absolute terms (-7.9%) and percentage impact (which was 8.5%). Finally, the amount of waste taken to the dump has been constantly dropping. Recently there's been a drop of over 18% in the amount of waste taken to the dump, and in 2011 this figure amounted to 188,000 tonnes, which, when compared to 850,000 in 2001, gives quite a significant picture of the transformation in the sector over the last decade. Another positive element is the cost of the urban waste management system. In 2011 the average cost per capita was €128.69 per inhabitant, a slight increase on 2010 (+ 0.6%) but in any case below the national average which in 2009, the last year for which data is available, was already over €143 per inhabitant.
Waste Disposal Consortia play a fundamental role in the waste management process. Legislative Decree 152/2006, with the aim of pursuing the objectives of recovering and recycling packaging materials required by European legislation, appointed the Italian National Packaging Consortium (CONAI) to promote the process for the transformation of the system based on dumping to an integrated waste management system, the cornerstones of which are the recovery and recycling of materials. CONAI consists of six Consortia processing the same number of materials as shown in table 13.8. (Table 12.3.2)
To conclude this quick summary on waste collection and disposal we should also mention the results of the Veneto municipalities in the 19th edition of the Legambiente Best Recycling Municipalities Award, in which prizes are awarded to the municipalities that generated least waste per capita with the greatest efficiency in terms of waste collection and management. Once again in 2012, Veneto was the region with more best recycling municipalities than any other region, over 61%. Note that as many as 23 different parameters, not just the percentage of separate waste collection, are considered for this classification. In the final classification, the municipality of Ponte nelle Alpi (Bl) won the 2012 edition, but as many as 7 Veneto municipalities (including Ponte nelle Alpi) were in the top ten and 5 of these in the province of Treviso, which is also a regional leader being the province most markedly dedicated to smart waste management. (Figure 12.3.6)
- reduction in the amount of waste with steps taken in the design of goods and packaging, in production processes and consumption, encouraging the use of recyclable materials, maximizing recycling and developing the recovery of raw materials;
- the reduction in dumping while promoting recycling;
- an increase in applied research, the widespread use of innovation and the latest recycling technology;
- measuring waste recycled, as well as current separate waste collection percentages.
Concerning the first priority, considering that practices have been introduced to reduce packaging (for example with lighter plastic bottles used for drinks and promoting the widespread use of "on tap" systems for the sale of detergents and foodstuffs), since 1997 we have not seen the desired reversal in the trend. If anything, the amount of waste produced is slowly but constantly increasing, with the only slow-down being in 2011, the last year for which data is available, almost certainly due to the economic crisis and the drop in consumption and therefore consumption-related waste. The overall increase in waste production can partly be justified by progressive population growth. Considering per capita waste generation, there is a continuous increase in the trend up to 2008, after which there is a significant reduction in the phenomenon in 2009, with a slight increase once more in 2010 and another drop in 2011. The latest data indicates approximately 465 Kg/person of urban waste produced compared to 497.5 in 2008. Veneto, when compared to the rest of Italy, is overall a fairly positive example, as per capita waste generation is below the national average. In 2010, the last year for which a comparison can be made, in Veneto 488 Kg/person of municipal waste was generated compared to the 536 of the national average for all Italian regions. (Figure 12.3.1)
As well as a reduction in the amount of waste generated, the other priority is waste management, meaning disposal and recovery whenever possible. This has been the direction taken for some years now, and results are just starting to show. First and foremost, as for the waste management, the waste collection system plays a fundamental role in maximizing separate waste collection results, guaranteeing the subsequent specific and optimised treatment of each type of material. We can assess current progress in these terms by observing both the changes in the waste collection systems and the level of separate waste collection reached. An analysis of how waste is processed and the development of waste treatment plants gives an idea of the current efficiency and progressive evolution in this important environmental sector. To continue, let's try to assess the main stages of the waste treatment process. In the first phase, major effort has been put into progressively implementing changes in the waste collection system, attempting to make households aware of the problem with campaigns to promote separate waste collection upstream. There have been concrete results, as data shows: observing the trend for 1999-2011 it is clear that there is a radical transformation throughout the waste collection system in Veneto municipalities: the number of towns where waste is collected separately has more than doubled (+145%) and in particular, there has been a real boom in door-to-door waste collection (with an increase of almost 300%). (Figure 12.3.2)
In 2011 as many as 570 Veneto municipalities out of a total 581 were using separate waste collection systems to separate "dry" and "wet" waste. In particular, 461 municipalities (79.3%) were using door-to-door separate waste collection, 66 "roadside" type collection (in roadside bins) and 43 mixed. Note that, among the municipalities separating wet and dry waste, for those using door-to-door type collection systems, the average separate waste collection value reaches the highest figures, almost 70%, decisively higher than the 63% representing the regional average. (Table 12.3.1)
The result reached in terms of overall separate waste collection is clear: from 28.4% in 2000 there was a constant increase, reaching 60.5% in 2011, passing target of 60% by the 31 December 2011 required by Legislative Decree 152/2006.
In 2011, all the provinces except Venice reached and/or exceeded the 60% target, with some cases truly worthy of mention such as Treviso (74%) and Belluno (66.4%) that also exceeded the last 2012 target, which set a separate waste collection requirement of at least 65% (Figure 12.3.3)(Figure 12.3.4)
The waste is treated after collection, and this gives an idea of the success of the entire waste management sector. In 2001, 39% of the collected urban waste went to the dump, while in 2011 this figure dropped to 8.2%. This is mainly due to the recovery of dry and organic waste, with a respective variation of 19.5 - 33.4% and 15 - 27%. (Figure 12.3.5)
In greater detail, the waste is treated in specialized plants, one for each type of material. In 2011, 623,000 tonnes of organic waste was recovered in 22 dedicated plants. This organic waste was used to produce over 230,000 tonnes of "compost" for the agricultural sector, vegetable and flower growing. As for dry waste that can be recycled (paper, glass, plastic and metal packaging), 631,000 tonnes were collected with extremely high percentages recovered such as 92% for plastic and as much as 99% for metal packaging. One figure worthy of mention is the 133,000 tonnes of separate dry waste divided by wood, metallic scrap, waste electrical and electronic equipment (WEEE). Dry municipal waste that cannot be recycled, bulk waste and waste from road sweeping amounts to 23.2%. This waste is sent to biological treatment plants or plants using other treatments for the recovery of raw materials, the production of energy-from-waste or disposal. 159,000 tonnes of Waste-Derived Fuel (WDF) was obtained from biological-mechanical treatment. Again in 2011, 8.1% equal to 188,000 tonnes of the urban waste treated was incinerated, a decrease on the 2010 figure, both in absolute terms (-7.9%) and percentage impact (which was 8.5%). Finally, the amount of waste taken to the dump has been constantly dropping. Recently there's been a drop of over 18% in the amount of waste taken to the dump, and in 2011 this figure amounted to 188,000 tonnes, which, when compared to 850,000 in 2001, gives quite a significant picture of the transformation in the sector over the last decade. Another positive element is the cost of the urban waste management system. In 2011 the average cost per capita was €128.69 per inhabitant, a slight increase on 2010 (+ 0.6%) but in any case below the national average which in 2009, the last year for which data is available, was already over €143 per inhabitant.
Waste Disposal Consortia play a fundamental role in the waste management process. Legislative Decree 152/2006, with the aim of pursuing the objectives of recovering and recycling packaging materials required by European legislation, appointed the Italian National Packaging Consortium (CONAI) to promote the process for the transformation of the system based on dumping to an integrated waste management system, the cornerstones of which are the recovery and recycling of materials. CONAI consists of six Consortia processing the same number of materials as shown in table 13.8. (Table 12.3.2)
To conclude this quick summary on waste collection and disposal we should also mention the results of the Veneto municipalities in the 19th edition of the Legambiente Best Recycling Municipalities Award, in which prizes are awarded to the municipalities that generated least waste per capita with the greatest efficiency in terms of waste collection and management. Once again in 2012, Veneto was the region with more best recycling municipalities than any other region, over 61%. Note that as many as 23 different parameters, not just the percentage of separate waste collection, are considered for this classification. In the final classification, the municipality of Ponte nelle Alpi (Bl) won the 2012 edition, but as many as 7 Veneto municipalities (including Ponte nelle Alpi) were in the top ten and 5 of these in the province of Treviso, which is also a regional leader being the province most markedly dedicated to smart waste management. (Figure 12.3.6)
Figure 12.3.1

Figure 12.3.2

Table 12.3.1

Figure 12.3.3
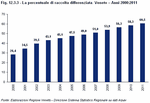
Figure 12.3.4
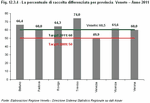
Figure 12.3.5
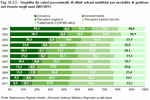
Table 12.3.2

Figure 12.3.6
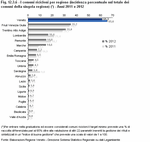
The European context
Energy is a major challenge for Europe; the reliability of supply, cost reduction and respect of the environment, reducing greenhouse gas emissions, are the priorities. This means a huge investment so that the current energy system can meet future requirements in a fast-changing world. Directive 2009/28/EC lays down the guidelines for the so-called "20-20-20" strategy based on three targets that the EU-27 Member States set themselves for the year 2020:- a 20% reduction in greenhouse gas emissions from 1990 levels;
- raising the share of EU energy consumption produced from renewable resources to 20%;
- a 20% improvement in the energy efficiency.
At the same time, new second generation biofuel and smart grid technologies should be developed, encouraging the use of renewable energy sources.
The situation in the EU Member States is slowly improving. The data for 2004 - 2011 indicates that the share of energy produced from renewable sources for gross final energy consumption increased from 7.9% in the first year to 13% in the last, indicating a positive trend that is still however far from the 20% target set for 2020. Each Member State was assigned a specific target and if each State reaches their target, this should make the European target of 20% a concrete reality. Italy has been assigned a target of 17% and by 2011 the share reached around 11.5%, a distinct improvement on the 4.9% of 2004 but which shows there is still a long way to go. (Figure 12.4.1)
The situation in Italy
The liberalisation of the energy market has resulted in major investments in new combined-cycle gas plants which, in a competitive context where investments come from private enterprise aiming to make a profit, represent the most rational choice in consideration of the high output of the same. The main consequence of this trend has been a move away from the old situation where Italy was dependent on fuel oil, something which characterised the Italian energy sector since the late 80's, to currently depend on gas. Therefore, to reduce the risk of an energy crisis caused by interruptions or limitation of supply from these sources, the first fundamental step to take must be rethinking and modifying the mix used to produce energy. In consideration of the concern for climate change, this must be done primarily by investing in renewable energy sources, especially in promising sources in terms of efficiency and production costs, while bearing in mind that for now and in the near future, these sources alone cannot possibly replace fossil fuels entirely. The second step to take involves the major development of infrastructures for importing primary energy sources as well as improving relations with the states supplying said energy.With gas for example, as well as trading with Russia, Italy must also inevitably consolidate trade relations with southern Mediterranean countries, and Algeria first and foremost. Still on the subject of gas, storage infrastructures, and imported liquid natural gas regasification plants are of great importance. The latter represent a critical factor in Italy, as there are currently only two plants of this kind. One of these is an offshore Liquefied Natural Gas (LNG) plant located 15 km from the coast of Porto Levante in the district of Porto Viro, province of Rovigo, which went into production in November 2009 (Note 10). This situation should be considered in the European context of the fight against climate change, and the improvement in energy efficiency. In fact, once again considering the question from a strictly environmental point of view, as mentioned above, Directive 2009/28/EC set the EEC target for the share of EU energy consumption produced from renewable sources at 20%, with specific targets for each member state. These targets were defined on the basis of certain factors, such as the territorial and economic characteristics of each single country.
The Italian target of 17% has been split into three specific targets, one for each energy sector: electricity, heating/air conditioning and transportation (fuel consumption).
In short, on the basis of calculations and estimates, the target of 17% should be reached by pursuing the following sectorial sub-targets: 26.4% in the electricity sector, 17.1% in heating/air conditioning and finally 10% in transportation.
The strategy for pursuing the national target can be found in the National Action Plan (NAP), presented by the Italian Government to the European Commission on 31 July 2010, and this is the main renewable energy planning instrument for Italy.
Production and consumption in the three energy sectors, electricity, heating and transportation must be controlled, to check targets are reached.
As mentioned above, 11.5% of the gross Italian final energy consumption in 2011 was obtained from renewable energy sources. By dividing the available data into the three different energy sectors, we can see the results reached and the 2020 targets for each of the same. In particular, for the electricity sector, considering the 2020 target of 26.4%, in 2011 renewable energy had already reached 23.5% and the trend has been one of major growth, especially since 2008. The significant development of photovoltaic plants in recent years has had a notable effect on this trend.
In the heating/air conditioning (heating) sector, the target to reach is 17.1% and the figure for 2011 is 11%. In this case there has been notable progress since 2007 and the trend continues to be one of growth. Finally, transportation is the most critical sector, as the figure in 2011 is still 4.7%, the same as in 2010, far from the 10.1% target to reach by 2020. There was an improvement in 2007 but this progress ground to a halt in 2010, probably due to the economic crisis affecting car sales, and therefore the transportation sector in general, in a more marked and immediate way than the electricity and heating sectors. (Figure 12.4.2)(Figure 12.4.3)(Figure 12.4.4)(Figure 12.4.5)
Energy in Veneto
The regional institutions, as far as their contribution goes, play a fundamental role in pursuing the target. For this purpose, the Decree of the Ministry for Economic Development passed on 15/3/2012, known as the Burden Sharing Decree, divides the national target for renewable energy sources among the regions for the electricity and heating/air conditioning sectors, but not for transportation, which is the sole competence of the State. The target set by the Burden Sharing decree requires 10.3% of gross final energy consumption in Veneto to be obtained from renewable energy sources by 2020.Statistical data at a regional level is currently only available for the electricity sector. The general target can however be broken down into sectors, and the target for the electricity sector in Veneto is 15.1%. Studying the trend of this indicator from 2005 to 2011, it is immediately apparent that we are witnessing a major transformation: from the initial figure of 12.9%, there have been rises and falls in the trend with small gains up to 2010. In 2011, however, there was a significant increase with a major leap forwards in terms of renewable energy from 13.6% in 2010 to 17.1% in this one year alone, reaching and passing the 2020 target. (Figure 12.4.6)
This result can be explained by an analysis of production and consumption data per source. Observing the electrical energy production trend in time, there is a progressive decrease from 1997 to 2011 while consumption in the same period increased. This situation has changed radically: in 1997 regional production catered for the territorial requirements and some of the electricity produced was even exported to other regions. Over the years however, regional production has continued to drop, while more and more electrical energy is imported, amounting to 57.9% of total gross consumption in 2011. In greater detail, the current situation in terms of energy sources shows a marked drop in traditional thermoelectric power production; in 1997 almost 26,800 (GWh), while in 2011 production was stable at 13,500. This is because the Porto Tolle plant has been closed down. The second source in order of importance is hydroelectric energy, representing 31.3% of Veneto's total electrical energy production in 2011 at 4,228 GWh. The trend of this figure varies in time as it is influenced considerably by weather conditions. (Figure 12.4.7)
There is good news for renewable energy sources though, and in particular photovoltaic power: while the contribution is still limited in absolute terms (production in 2011 = 913 GWh), there has been significant growth in the use of this energy source in the last two years. A total of 5,845 GWh of electrical energy was produced in 2011 by renewable energy plants, an increase of 16.7% on 2010. The main source of renewable energy in Veneto is still hydroelectric power, now followed by photovoltaic energy thanks to considerable development in recent years: in 2011 growth reached a staggering 605.6% in terms of production compared to 2010, with a 251% increase in power capacity and a 121.3% increase in the number of installations. (Table 12.4.1)(Figure 12.4.8)
The data on photovoltaic plants partly explains the improvement in the indicator on electrical consumption obtained from renewable energy sources mentioned above.
This brief description of the energy situation indicates a considerable dependency in Veneto on imported energy both in terms of primary energy sources, and electrical energy imported directly. To counterbalance this critical factor however there is also considerable investment in the innovation of production processes, mostly aimed at using renewable energy sources, although it is still early to have seen any real results. Further confirmation of Veneto's focus on the theme of energy and energy produced from renewable sources can be found in Decree of the Regional Council No. 694 passed on 14 May 2013 on the "Procedures for granting licences for the diversion of public water and authorizing the construction and operation of hydroelectric plants." The Decree proposes simplifying the authorization procedure for granting said licences, to make access to this energy source as easy as possible.
Figure 12.4.1

Figure 12.4.2
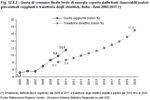
Figure 12.4.3
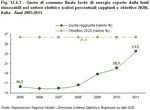
Figure 12.4.4
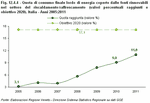
Figure 12.4.5
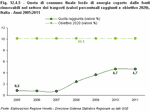
Figure 12.4.6

Figure 12.4.7

Table 12.4.1

Figure 12.4.8
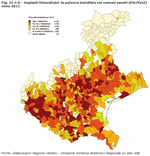
12.5 A best practice (Note 11)
To conclude this part on the environment, we would like to provide an example of a best practice inspired by innovation for environmental sustainability, called "FRESH - Forwarding Regional Environmental Sustainable Hierarchies", a project backed by the European Union as part of the INTERREG IVC Programme, promoting eco-innovation through sustainable construction in eight different regions.
The project, which ran from 2010 to April 2013, was supported by numerous European partners from Finland, Ireland, Italy, Poland, Romania and the UK. In detail, the Italian partners were: the Directorate-General for Small Enterprise and Industry of the Veneto Regional Authority and the Department of Chemical Processes and Engineering of Padua University.
In FRESH, the partners' objective was to strengthen "Sustainable Value Creation" (SVC) development and encourage the adoption of administrative and legislative measures to generate economic growth in the territory based on the implementation of actions and activities in line with the principles of sustainable development. In this context, economic growth through sustainable actions supports "Sustainable Value Creation" when the three economic, environmental and social dimensions are basically well-balanced. In consideration of EEC strategy on sustainable development, EEC Lead Market Initiatives (LMI), the Environmental Technologies Action Plan (ETAP), EEC regional policies and policies for regional cohesion, the project partners established three operating objectives:
For the welfare of all, a common synthesis of economic-industrial development and market strategies, instruments must be introduced for the development of the territory such as eco-innovation and eco-design, to harmonize the various requirements and produce general benefits for the sectors involved in the dynamics of the productive process and society itself.
New and innovative operating modes will lay the foundations on which institutions must build the society of the future, based on a model where economic and social systems interact.
On the basis of these prerequisites, the project partners took steps to change regional development plans to increase the territorial impact of sustainable development policies and promote the adoption of eco-innovative instruments, also through involvement and collaboration in project activities with a variety of territorial stakeholders.
In particular, the FRESH project activities focused on exchanging best practices to promote sustainability in the territories participating in the partnership. Following the first phase of analysis, the Veneto Regional Authorities established best practices to share with European partners including Regional Law no. 4 - 9/3/2007 "Regional initiatives and interventions in favour of sustainable building", which includes regional reductions for buildings built or renovated along the lines of sustainable building techniques and principles; the ATTESS project aims to define the methods of intervention for buildings of historical interest in accordance with energy efficiency criteria, environmental sustainability and indoor health and wellness; the Organic architecture production district.
Of the best practices promoted by the project partners, the Veneto Regional Authority showed great interest in the GPI wellbeing indicator (Genuine Progress Indicator), studied and applied by the Regional Authorities of Kainuu and Päijät-Häme in Finland. The GPI is an instrument used to measure economic wellbeing in a country; it simultaneously considers economic, environmental and social aspects, unlike the GDP for which the GPI has been proposed as an alternative. Within the scope of its competence, the Veneto Regional Authority has studied the possibility of applying the GPI in the regional territory.
The project, which ran from 2010 to April 2013, was supported by numerous European partners from Finland, Ireland, Italy, Poland, Romania and the UK. In detail, the Italian partners were: the Directorate-General for Small Enterprise and Industry of the Veneto Regional Authority and the Department of Chemical Processes and Engineering of Padua University.
In FRESH, the partners' objective was to strengthen "Sustainable Value Creation" (SVC) development and encourage the adoption of administrative and legislative measures to generate economic growth in the territory based on the implementation of actions and activities in line with the principles of sustainable development. In this context, economic growth through sustainable actions supports "Sustainable Value Creation" when the three economic, environmental and social dimensions are basically well-balanced. In consideration of EEC strategy on sustainable development, EEC Lead Market Initiatives (LMI), the Environmental Technologies Action Plan (ETAP), EEC regional policies and policies for regional cohesion, the project partners established three operating objectives:
- increase the territorial impact of regional polices for sustainable development;
- greater involvement of local stakeholders in the shared definition of actions to encourage eco-design and eco-innovation;
- include Sustainable Value Creation (SVC) components in medium and long-term regional strategies.
For the welfare of all, a common synthesis of economic-industrial development and market strategies, instruments must be introduced for the development of the territory such as eco-innovation and eco-design, to harmonize the various requirements and produce general benefits for the sectors involved in the dynamics of the productive process and society itself.
New and innovative operating modes will lay the foundations on which institutions must build the society of the future, based on a model where economic and social systems interact.
On the basis of these prerequisites, the project partners took steps to change regional development plans to increase the territorial impact of sustainable development policies and promote the adoption of eco-innovative instruments, also through involvement and collaboration in project activities with a variety of territorial stakeholders.
In particular, the FRESH project activities focused on exchanging best practices to promote sustainability in the territories participating in the partnership. Following the first phase of analysis, the Veneto Regional Authorities established best practices to share with European partners including Regional Law no. 4 - 9/3/2007 "Regional initiatives and interventions in favour of sustainable building", which includes regional reductions for buildings built or renovated along the lines of sustainable building techniques and principles; the ATTESS project aims to define the methods of intervention for buildings of historical interest in accordance with energy efficiency criteria, environmental sustainability and indoor health and wellness; the Organic architecture production district.
Of the best practices promoted by the project partners, the Veneto Regional Authority showed great interest in the GPI wellbeing indicator (Genuine Progress Indicator), studied and applied by the Regional Authorities of Kainuu and Päijät-Häme in Finland. The GPI is an instrument used to measure economic wellbeing in a country; it simultaneously considers economic, environmental and social aspects, unlike the GDP for which the GPI has been proposed as an alternative. Within the scope of its competence, the Veneto Regional Authority has studied the possibility of applying the GPI in the regional territory.


