Chapter 11
Labour and education: challenges old and new
Employment in Italy and in Veneto
Tracing historical changes
From the birth of the Kingdom of Italy until today, our country has gone through many socio-economic changes that profoundly affected the labour market. After the Second World War, the employment situation in Italy was truly tragic: although there was a considerable gap between the development of the industrial northern regions, and the predominantly agricultural and therefore poorer southern regions, there was a generalized lack of jobs throughout the country. In the early fifties, then, despite the start of agrarian reform and special assistance for the South, the industrialized North found an army of unemployed southern workers willing to migrate in order to find work, which would allow the North to maintain low wages, favouring the so-called "economic miracle," which for the South meant once again depopulation and stagnation. Thus, the phenomenon of urbanization originated in the northern regions, which however also led to social problems due to lack of essential services (homes, schools, hospitals, etc.).The job market demand remained high for about a decade and began to decline in the mid-sixties. There was a growing awareness in the southern regions that emigrating was the only chance of finding work, but there was less desire to leave one's home.
In the following years, labour supply began to exceed demand, causing high social conflict which in the mid-seventies led to the reform of the sliding scale. In the eighties, the Italian economy underwent further significant transformation: the service sector overtook industry in terms of number of workers. However, unemployment continued to rise, even though special measures such as training contracts for young people and part-time work for women had been adopted in order to facilitate employment for minorities. These years saw the arrival of mid-sixties baby boomers and the increased participation of women in the job market.
The picture at the end of the eighties was quite varied: while the North was at least close to full male employment, the South continued to live situations of great distress.
This brings us to the nineties and a worrying employment problem; in '92 we witnessed a currency and financial crisis: under the pressure of international speculation, the Italian Lira was considerably devalued and forced to temporarily leave the European Monetary System. The economic downturn, combined with technological reconversion and the subsequent revision of industrial organizational models, caused a labour decrease in all sectors, especially the industries and large factories of the North. Nevertheless, the process of European integration continued, so much so that in the same year, the Maastricht Treaty was signed for the creation of a single currency and monetary policy common to all participating countries.
In this scenario, the Italian market in the early 90's was characterized by considerable rigidity that accentuated the differences in unemployment between the Centre-North and the South. On the one hand, the matching of labour demand and supply was entrusted to agencies unable to communicate the needs of the various areas of the country. On the other, possibilities of flexible forms of employment were still scarce, due to restrictions on fixed-term contracts, the high financial burden placed on businesses for the use of part-time work, and strict dismissal regulations. In order to overcome these difficulties, Italy started a process of labour market reforms that aimed at increasing flexibility, both through the reform of the wage bargaining system and the introduction of less rigid forms of contract. Regarding this, the most important changes came from the "Treu package" of 1997, the regulations of fixed-term contracts in 2001, and the "Biagi Law" of 2003.
Introducing profound changes in terms of fixed-term contracts, the Treu package tried for the first time to lower constraints on businesses' hiring and firing power and to expand the possibilities of access to the labour market especially for women and young people. Following that, Legislative Decree no. 368/2001 liberalized the use of fixed-term contracts, greatly expanding the range of cases that could refer to it; however, it was with the Biagi Law and subsequent implementing decrees that the objective to create the conditions for resolving the issue of employment in relation to its territorial dimension became more explicit. In this regard, many tools were introduced to encourage moving from an employer to another (labour mobility) and from one region to another (geographical mobility). Among these were the introduction of new flexible forms of contract (on-call work and project work), the extension of the scope of existing institutions (part-time and apprenticeship contracts), the reduction of hiring and firing constraints, the initiation of policies facilitating the matching between labour supply and demand, and the reduction of the duration of labour relations and stimulating people to seek employment.
Reforms and results
We can evaluate the effectiveness of these reforms by analyzing employment/unemployment rate trends. Since 2003, regional disparities have been reduced, the unemployment gap between North and South has been decreasing significantly from more than twelve percentage points in 2003 to 7 in 2009, but unfortunately, the crisis we are experiencing right from the end of 2008/early 2009 has undermined these results reemphasizing differences. As for our region, it has performed excellently since the end of the nineties until the current economic crisis recording ever-decreasing rates, from 6.4 % in 1997 to 3.5 % in 2008.Because of regulatory changes, the employment rate tended to grow both nationally and in our region up until before the outbreak of the crisis. In detail, our region went from the low 59 % of 1995 to beyond 66 % in 2008. Between 2002 and 2003, Veneto had a significant increase of almost one percentage point in the employment rate also due to the immigration amnesty. (Figure 11.1.1)
Lower rates of unemployment among young people and higher numbers of women in the labour market both nationally and in Veneto were also recorded following the reforms. In fact, the rate of youth unemployment in Italy fell from 29.6 % in 1997 to 23.6 % in 2003 and 20.3% in 2007, while for Veneto it fell in the same years respectively from 14.1 %, to 9.3 % and 8.4 %. Female employment rates increased gradually between 1997 and 2008 in Italy going from 39.2 % to 47.2 % and in our region from 46.8 % to 55.5 %.
Veneto: a strong region notwithstanding the crisis
Since the Fall of 2008, all the results obtained have been outweighed by the economic crisis still in place, hence moving away from the targets set for 2010 in the Lisbon Strategy, and that was to achieve a 70 % employment rate for ages 15 to 64 and substantially reduce unemployment.Italy also recorded particularly complex interconnections between demographic changes and the labour market. The combination of rising longevity and lower fertility led to a decline in labour relations due to a decrease in working-age population and the consequent decrease of labour supply and economic growth potential. The emergence of an aging population and the crisis of recent years emphasized the need for policies promoting a more prudent management of retirement savings. A step forward in this direction was taken with the recent social security reform of the 2011 Monti Decree that aimed to increase the average retirement age in the coming decades by means of tightening eligibility conditions based on age/length of contributions, and by introducing constraints on the amount required for implementing the right to retire.
In and out labour market flexibility was among the priorities of Monti's technical government in the field of employment, a structural reform of the social safety net systems and the full inclusion of women and youth, the latter being particularly affected by the crisis. The ambitious "Fornero reform" (Note 1) of 2012 gave these priorities greater structure with the purpose of renewing and reorganizing the Italian labour market, evidently no longer keeping up with the changing times.
Part of this context is also the new strategy defined by the European Commission, "Europe 2020," with the aim of leading the continent out of the economic crisis and above all to give it a new direction and new goals to successfully face the challenges of the next decade. Continuing the work done with the previous strategy and resuming some of its goals, "2020" is based on three key priorities which are reflected in five new objectives, achieving 75 % employment of the population aged between 20 and 64 by 2020 being one of them.
In spite of the mounting crisis, Veneto's employment rates in 2012 kept to the levels of the previous year recording a 69.3 % employment rate of the population aged 20-64, the fourth highest value among the Italian regions, and reaching the target set by the Lisbon strategy (i.e., 69 % employment by 2010). However, Italy rated low at 61 %, seven percentage points and a half less than the EU27 standard. Considering these numbers, and facing the new EU target for 2020, the Italian Government set for Italy a more realistic goal between 67 % and 69 %. Veneto has already achieved this value and can therefore aspire to the European target.
The employment rate in the 15 to 64 age group also remained unchanged from the previous year: 65 % in Veneto, still the fourth highest among Italian regions, compared to the national 56.8 % and the 64.2 % average European figure. Compared to 2011, details show that our region has been increasing its employment rate among the population with Italian citizenship (65.8 % versus 65.3 %), while decreasing that of foreigners which went from 62.4 % to 59.4 %. In general, however, employment in Veneto has lost about one and a half points since the outbreak of the crisis (two points in Italy), mainly due to the decline of the male component, which in 2012 was around 75 % compared to 77% four years earlier, although still remaining the second highest value in Italy. By the same talking, Veneto's women began to encounter difficulties after years of steady growth. Although in the most recent years the situation has improved and in 2012 their employment rate stood at 55%, only half a point less than in 2008 and three points more than in 2001, however still low and below the 60 % threshold set by the Lisbon strategy for 2010.
Overall, despite the economic downturn, three-quarters of all Italian regions have experienced an increase in their employment levels between 2000 and 2012. Lazio is the region that in twelve years has made the most progress increasing by six and a half percentage points their initial value, followed by Liguria with a four-percentage points improvement. Veneto, starting from a more favourable situation, also had the fifth largest increase in the regional ranking (+ 2.9 points). Conversely, the South, always subject to great inconvenience, recorded the worst conditions. (Figure 11.1.2)
What has changed for young people, women and the older age groups?
Young people (Note 2) were particularly affected by the crisis, while employment of people aged 55 to 64 got increasingly higher.In the 90s, Veneto's youth unemployment rate remained above 13 % and then declined to reach minimum values in 2002 and 2007 (respectively 8.3 % and 8.4 %). With the crisis, however, within a few years, the unemployment rate has risen by 13 percentage points (14 compared to the beginning of the century), reaching a rate of 23.7 % in 2012. We should note, however, that the situation of Veneto's youth is among the most favourable in Italy: in fact, it ranked as the second Italian region for lower unemployment levels; Trentino Alto Adige was first with 15.2 %. In general, Italy's youth unemployment has grown everywhere in eleven years, reaching 35.3 % among the labour force in 2012, with regions that reached and/or even exceeded 50 %. Such is the case of Calabria and Sicily where half of the labour force is without employment. Conversely, although on average young Europeans have been experiencing increasing difficulties, the unemployment rate in the EU27 has still remained lower than the data recorded at the beginning of the century.
In view of this, the employment rate of people aged 55 to 64 has been growing for all Italian regions. As mentioned before, the aging population is one of Italy's and the European Union's main challenges that must be faced in the coming years. For a long time, European governments have been committed to raising retirement age quotas and achieving a significant increase in the employment rate of older age groups. In order to do this, the Lisbon Strategy set by 2010 the target of 50 % employment rate for the population aged 55 to 64. EU27 came close to its target going from 36.3 % in 2001 to 48.9 % in 2012. Italy did well starting from lower levels and managing to grow by 13 percentage points, from 27.6 % to 40.4 %, and Veneto did even better with a more than 18 points rate increase, from 24.4 % to 42.8 %. In addition, Veneto recorded in recent years the second largest increase among the Italian regions. Liguria was first with a twenty-point growth. (Figure 11.1.3)
In summary, during the last decade all the Italian regions showed higher levels of youth unemployment and employment growth among people in older age groups, almost all of them had greater female participation in the labour market, confirming the economic, social and cultural model changes that have been taking place.
In & Out sectors and professions
The crisis fits into a transformational stage of the economic system that has already been going on for several decades: the transition from a purely industrial system to one based on services has been noticeable since the 80s, and especially since 2000, it has been getting faster.Naturally, not all sectors have been affected in the same way by the economic crisis: some areas are coming out of it unscathed; some have even increased their workforce at the expense of others who have experienced significant deterioration. Thus, the crisis hit particularly those that were already in a difficult situation and especially the industrial sector: from 2008 to 2012, Veneto's employment in this sector decreased by 11.5 % and construction workers were - 7.2 %. The longer 2005-2012 period recorded a 5-6 % reduction for both.
Employment was lower also in other sectors such as transportation, real estate, business services, and other business activities, while a separate mention must be made about employment in the public sector, which fell by 8 % in the last period as a result of a process of renewal and cost containment by the Public Administration.
The lodging and food service activities performed rather well, significantly increasing their employment numbers even in a period of economic recession: good thing especially for a region such as Veneto, where tourism has always been the feather in our cap.
Overall, the public and personal services industry has experienced the largest increase in employment (+31 % over the last four years, and a whopping +56 % since 2005). This heading includes services such as membership organizations, individual services and the activities of households as employers of domestic staff, a progressively growing area, as we shall see in the next section. (Figure 11.1.4)
Over the last few years, employment distribution has experienced a change with regard to professionals. In the nineties, Italy recorded a gradual shift in labour demand towards more qualified personnel, which was associated with the growing service sector; however, starting with the new century, there has been a gradual shift towards employing professionals with lower levels of competence. This trend has become even more noticeable in the context of the recent crisis.
In line with the national average, Veneto's executives and entrepreneurs, especially women, have been decidedly decreasing in recent years, having suffered greatly due to the crisis and closing businesses. Office employees were also fewer, while intellectual and technical professions fortunately held up, mostly due to the growth of the female component. This reduces concerns at least a little over a labour market running the serious risk of a mismatch between increasingly educated job seekers and a demand that leans increasingly more towards professions that do not require high levels of education.
The number of qualified professionals employed in the tertiary sector also increased thanks to greater stability, while the loss of medium skilled workers, such as artisans and skilled labourers and plant operators, was mainly due to the manufacturing industry's crisis that has exacerbated the structural reduction of labour demand.
On the other hand, the increasing labour demand for low-skilled professions changed the characteristics of the supply, in particular due to the high presence of foreign workers in this field.
More specifically, there was a decrease of entrepreneurs from Veneto, especially small businesses, reduced to less than half between 2005 and 2011. However, there was an increase in intellectual professions, driven primarily by the increased number of employees among life science specialists, followed by engineers, architects, mathematicians, physicists, and natural scientists. As for the technical professions, workers were required especially in the health and life sciences, and as skilled personnel employed in commercial activities and services, and specialists in health services.
Finally, education, health, and people services increased mainly among the unskilled occupations. This group includes staff employed in domestic activities, such as house cleaners and caregivers. The increase in the number of these employees is part of a structural trend that has been in place for some years now and that responds to changes in Italian society. On one hand, an aging population has resulted in the growth of elderly care needs; on the other, a more female labour market has implied a lower availability than in the past to carry out work related to the care of home and family, which has been taken on more and more by formal jobs. Foreign workers who by the way benefited from legalization with the amnesty of 2009 often occupy these. (Figure 11.1.5)
And for the future?
According to the latest figures from the Excelsior data bank relating to the first quarter of 2013 and the forecast for 2012, the jobs most in demand in Veneto were the typical tourism, catering and trade professions.
Unemployment: just the tip of the iceberg
Unemployment is certainly a problem of our time, but we must not forget years of misery such as those between the two wars, the difficulties of baby boomers in finding a job in the 80's, the changes in the labour market with the currency crisis of '92, cultural changes, and the increased willingness of women to enter the labour market. The current level of unemployment in Italy is the highest in this century, but it is still lower than the levels recorded from the late 80's to the 90's, when, in addition to the ones mentioned above, the Italian economy underwent a further great change, namely the tertiary sector overtaking the manufacturing industry in terms of employee numbers. Thanks to the Biagi Law of 2003, Italy then had a jolt, realizing one of the best performances in Europe with regard to the general lowering of the unemployment level.
But the crisis started in 2008 again turned the tables and in 2012 unemployment in Europe reached the highest levels since the beginning of this century recording for the EU27 a rate of 10.5 % compared to 8.8 % in 2000. The risk of long term social exclusion has becomes more real for many countries. Household incomes have decreased and the risk of poverty has increased especially in southern and Eastern Europe. This created a new gap between countries that have been able to withstand the crisis (and also tend to have better working labour markets and more robust welfare systems) and those trapped in a downward spiral characterized by a decrease in production, rising unemployment, and reduced income.
The most disadvantaged countries were Spain and Greece, where one in four people belonging to the labour force was seeking employment, showing among other things, the most consistent gaps with respect to 2000 (+13 percentage points). Portugal followed suit with a 16 % unemployment rate, over eleven percentage points more than twelve years ago. The best conditions, however, were recorded in Luxembourg, the Netherlands and Germany, where the unemployment rate did not exceed 5.5 %.
In Italy, the recession has meant heavy employment costs: since the beginning of the crisis, unemployment rose and the use of unemployment benefits exploded, only partially concealing (or postponing) a further decline in employment.
After 2011, which had shown signs of recovery, during 2012 labour market difficulties have become increasingly evident. The unemployment rate in Italy increased again up to a recorded value of 10.7 % compared to last year's 8.4 %. This increase affected both males and females throughout the country, especially the South where it came to over 17 %, and also foreigners, who marked a two percentage point rate increase in a year.
With the highest unemployment rate of the decade equal to 6.6 %, times were tough in Veneto, which however still ranked as the Italian region with the second lowest level of unemployment (preceded only by Trentino Alto Adige).
According to data from Prometeia, the future forecast is bleak: we will have to bite the bullet for a few more years before seeing the light. (Figure 11.1.6)
In detail, there were many people looking for work in our region for more than a year: 44.4 % (52 % in Italy) in 2011against 25.4 % in 1995 and 15.8 % in 2000. It is obvious that Veneto, starting from low indicator values, has recorded a higher variation until today with respect to regions with very high initial values. This is the case, for example, of Sardinia where currently people looking for a job for more than 12 months are 53 %, but there is no percentage difference compared to fifteen years ago. (Figure 11.1.7)
Who are our unemployed?
Who are the unemployed? Who among them has paid the heaviest price? And above all, how has the structure of unemployment changed in recent years, also in relation to the economic crisis?A first insight comes from the study of the different unemployment types; it is in fact possible to identify three unemployed groups based on previous work history. These are: people who were formerly employed but lost their jobs and are now looking for a new one, people who were formerly inactive and wish to return to the labour market after a period of inactivity (especially women), and people who have never worked in the past and are looking for their first job (especially young people).
In 2012, 54 out of 100 of the unemployed had been formerly employed in the Veneto region, 27 had been formerly inactive, and 19 were looking for their first job. In 2004, the first year when the new historical series from Istat became available, the relationships between these components were different: the formerly employed accounted for 46 % of the unemployed, while the formerly inactive and people looking for a first employment were in greater numbers.
What happened, then, between 2004 and 2012? In 2007, unemployment reached minimum levels: Veneto's unemployed were about 73 thousand units, while Italy's were just over 1.5 million. This period of relative economic and work stability had a protective effect especially for insiders, i.e., for people who were already in the labour market (ex-employees). In Veneto, the effect of this category dropped in fact from 46 % in 2004 to 39 % in 2007. This went to the expense of the outsiders, i.e., the people who were outside the labour market and were trying to enter or re-enter it. Later, the ranks of former employees grew along with the crisis and the loss of jobs.
Generally speaking, then, one encounters the greatest obstacles in entering the labour market during a period of relative economic well-being, while in times of crisis, the difficulty lies especially in trying to keep one's job. Compared with just Veneto, people seeking their first job increased at the national level, while the formerly inactive have had a less significant impact. However, the crisis hit Italy in a similar way to our region, especially by increasing the number of people who lost their job. (Figure 11.1.8)
From the quantitative point of view, the formerly employed had been 28 thousand in the Veneto region in 2007; over the following three years, this number increased with a high annual growth rate, and after a setback, it started to grow again in 2012, almost reaching the 81 thousand units. People seeking their first job, however, followed a slightly different pattern: up to 2009, in fact, they remained fairly stable, starting to feel the effects of the crisis only in 2010, two years later than the formerly employed. At the national level, the three unemployment groups followed different paths: 2007 marked a common minimum point, but after the outbreak of the economic crisis, the formerly inactive and those looking for their first job increased somewhat, while the formerly employed grew by 17 % in 2008, 30 % in 2009, and 37 % in 2012. (Figure 11.1.9)
In detail, the number of the unemployed in the Veneto region decreased across the board in the years preceding the crisis, however a high level of education guaranteed better opportunities to enter the labour market. In fact, from 2005 to 2007 the number of unemployed college and high school graduates looking for their first job decreased by 23 %, while the number of people with a degree below average looking for their first job increased by 9 %. Subsequently, the crisis changed this balance and the unemployed with a degree above average increased most of all; in particular, people seeking their first job with a high school diploma or college degree went from 9 thousand to almost 20 thousand, while those holding no more than a junior high diploma increased by only 2,000 units.
Gender differences are also interesting. With inequalities between males and females regarding unemployment and activity rates decreasing through the years, the latter showed a more moderate increase in the last period compared to other unemployed groups. In particular, formerly employed males have more than tripled, whereas men looking for their first job have more than doubled. Of course, we must consider these data in the light of higher male employment rates. (Table 11.1.1)
Beyond the unemployed: the discouraged ones
According to international definitions, an unemployed person must meet three conditions. He or she must be out of work, must have looked for work at least once in the thirty days preceding the reference period (actively looking for work), and must be immediately available (within two weeks) to accept a job in case one were offered. If one of these three conditions is missing, a person is no longer considered unemployed: in particular, if an individual is not actively seeking work, or is not willing to accept a job, one crosses the border into the area of inactivity.It is clear that this definition of unemployed is rather restrictive, precisely because it excludes the "discouraged," i.e., those people who despite being available for work, in the last month have stopped looking for a job. Paradoxically, then, the unemployment rate calculated in the traditional way may decrease even if the conditions of the labor market worsen, as the discouraged go to swell the ranks of the inactive (not included in the calculation of the unemployment rate) and not of the unemployed. The exit to inactivity is a passage perhaps worse than into unemployment: in fact, those who leave the labor market are less likely to return to it, compared to those who continue to look for a job.
Before the outbreak of the economic crisis, Veneto's discouraged amounted to under 30 thousand units, but in the following years, they have steadily increased to 49 thousand in 2012. Nevertheless, our region remains among those in the best conditions: in fact, in 2012 there were a little over 2 of the discouraged and 7 actual unemployed for every 100 employees (for both indicators, the second lowest among the regions), while in Italy these values went up to 6.8 and 12, respectively. The southern regions always suffer the most: there were many unemployed compared to the employed and again many among the discouraged, a clear signal of a definite employment problem that further aggravates the condition of this part of Italy where there are also many illegal workers. (Figure 11.1.10)
The phenomenon of discouragement is, therefore, associated with the crisis and leads to a departure from the labor market, but it remains anchored to some difficult to change dynamics unrelated to the unfavorable economic situation. It is, in fact, a problem that mainly affects vulnerable groups, i.e., women, young people and people with a low level of education.
In 2005, there were approximately 33 thousand discouraged in Veneto and among these, 77 % were women, 56 % had completed at most junior high, and 48% were younger than 34. Between 2005 and 2007, the labor market has not undergone big changes, continuing to observe these difficulties.
Following this, 2009 was a rather difficult year: Veneto's discouraged increased by 38 %, affecting the most vulnerable, but also the strongest. In fact, the conditions of certain already disadvantaged groups worsened - the discouraged with below average education increased by 57 % compared with 19 % of those with a diploma or degree - but the conditions of men and average age groups, the most safeguarded labor market categories, also worsened.
New tools for measuring unemployment
Considering these discouraged people, those who are available for work but not actively seeking work and might be termed "potential labor force," an interesting correction may be applied to the common labor market indicators by building the "extended unemployment rate" (Note 3) also called "labor force non-participation rate." By doing so, we get a less biased representation of the severity of the problem. In 2012, this indicator was 15.8 % compared to a classical unemployment rate of 10.7 % for Italy, while the Veneto region recorded a value of 8.5 % compared to the traditional 6.6 %. As noted earlier, the biggest gap was found among young people aged 15 to 24 (in 2012, Veneto's extended unemployment was 4 points higher than the classical one, 10 points higher for Italy), among women (+3.1 for Veneto, 6.6 for Italy) and among people with lower qualifications (+2.7 for Veneto, 7.3 for Italy).Veneto, however, remained one of the regions with the lowest gap between classical and extended unemployment, preceded only by Trentino Alto Adige and Emilia Romagna.
The underemployed: involuntary part-timers
A further indicator to understand more deeply the labor market is represented by the underemployed, i.e., part-time workers who would like to work more hours and would be available to do so within two weeks time from the referenced week. This is, in all effects, employment hardship: these workers were forced to work part-time not by choice or due to family needs, but due to unfavorable business trends or the economic downturn.In 2012, there were more than 35 thousand underemployed workers in Veneto, 41 % more than the preceding year, that is 1.7 % of the employed and 9.8 % of those employed only part-time. Once again, the situation at the national level was more critical: in Italy, there were 2.6 underemployed out of every 100 employed and 15.6 out of every 100 employed part time. Fortunately, Veneto turned out to be the third region with the lowest incidence of these disadvantaged workers - preceded by Trentino Alto Adige and Friuli Venezia Giulia - while in some southern regions the situation is quite alarming: one part-time worker out of four could be classified as underemployed in Basilicata and Sardinia.
In order to study the trend of this indicator, it is necessary to evaluate the changes that occurred before and after the outbreak of the economic crisis. Before 2008, the underemployed in Veneto recorded lowering trends: in fact, they had decreased by 26 % between 2005 and 2007, going from more than 31 thousand to 23 thousand units.
Subsequently, the recorded trend became uneven tending to worse and, despite a sharp drop in 2011, the year 2012 proved to be once again a particularly bad year. The trend was more linear for Italy, with steady increases from 2007 to 2011 getting more severe in the last year. Just as for the discouraged, underemployment also affected especially the more vulnerable sections of the population and the workers, although interesting aspects emerged. First, it should be noted that the effect of Veneto's women on the total underemployed female workers was equal to 3 % compared with 0.7 % for men. However, if we compare the underemployed solely to the employed part-time, the relationship is reversed: out of 100 men who worked part-time, 12 were classified as underemployed, while out of 100 women working part-time, 9 could be classified as such. In other words, while for women part-time work is above all a family or personal choice, for men it is more often considered as a constraint associated with employment hardship.
Continuing the analysis, we observe that a larger proportion of temporary workers were hired on a part-time contract than their colleagues on permanent contracts, and at the same time they could be more frequently classified as underemployed; discomfort for these workers is therefore double: precarious contractual conditions associated with forms of underemployment.
Finally, as regards education and age group, underemployment affected mainly young people under 34 and workers with a low education level. (Figure 11.1.11)
Social safety nets: innovations for greater support
The temporary redundancy pay fund has definitely been an increasingly important tool to combat unemployment in recent years, although we must consider the fact that businesses must sooner or later collide with the prospect of further employment cuts. The social safety nets reform introduced by Law 92 and expected for over fifteen years is part of this scenario. These are the two new tools: the Social Insurance For Employment (ASPI) and bilateral solidarity funds. In particular, ASPI will gradually replace unemployment benefits (ordinary, construction and with reduced requirements) and will be assigned regardless of the sector the worker belongs to, his or her professional qualification and the size of the business. The novelty of this tool lies in its insurance coverage, which will be extended to categories hitherto excluded, such as apprentices and members of cooperatives. The bilateral solidarity funds are instead based on agreements between social parties, trade unions and employers, and will have the task of supporting workers not covered by temporary redundancy pay, or of integrating ASPI's expected contributions. These two new tools will come to full capacity at different times: ASPI has already entered into force on 1 January 2013, but it will be fully operational only in 2016, while the bilateral solidarity funds need to wait collective agreements and the resulting founding decrees.
The ordinary temporary redundancy pay fund (Cig) was not reformed by the Fornero Law, whereas the extraordinary Cig will undergo two actions. On the one hand, it will be extended to some areas that were previously included only thanks to transitional rules, such as trade and travel businesses with more than 50 employees and businesses in the aviation and airport system. On the other hand, it will no longer be granted starting from 2016 in the case of business failure and in cases where returning to work after income support ends is not expected.
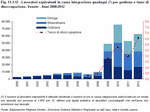
More than a billion Cig hours were awarded in Italy in 2012, of which about 103 million hours were allocated to businesses and workers from Veneto. The use of this tool for income support clearly followed the trend of the economic crisis. In fact, Cig hours granted annually in Veneto were no more than $ 16.5 million until 2007, but since 2009 they have exploded, reaching their maximum value in 2010 (124.5 million). In particular, redundancy pay and unemployment ran on parallel tracks: they began to grow in 2009 and reported two peaks in 2010 and 2012.
The type of income assistance is also explanatory of economic hardship and the changes taking place in society. Until 2005, mainly ordinary Cig hours were granted: this type of aid is granted to businesses that are experiencing temporary difficulties, such as unfavourable but transient market conditions. During the crisis, however, more and more use was made of extraordinary and exceptional Cig: extraordinary Cig is granted in the case of corporate crisis, while exceptional Cig has been introduced to facilitate workers excluded from other types of aid (such as industrial and artisan businesses in all sectors, service sector businesses, cooperatives, and professional offices). The greater use of these two forms of redundancy pay indicates how the crisis has affected sectors and professions that are considered more solid: before the difficult economic condition, social safety nets were not provided for these figures, however, they have become necessary after the outbreak of the crisis. (Figure 11.1.12)
Figure 11.1.1
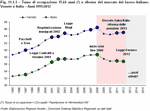
Figure 11.1.2
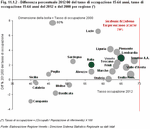
Figure 11.1.3
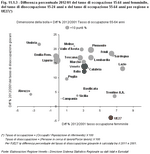
Figure 11.1.4
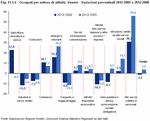
Figure 11.1.5

Figure 11.1.6
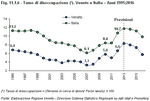
Figure 11.1.7
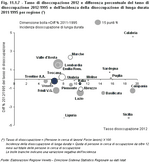
Figure 11.1.8
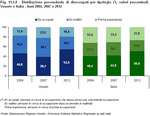
Figure 11.1.9
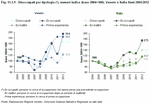
Table 11.1.1

Figure 11.1.10
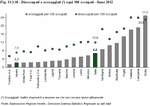
Figure 11.1.11
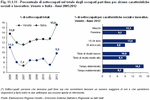
Figure 11.1.12
The development of human resources is closely related to employment. Investing in education is not only synonymous with greater benefits for young people and their families who are less likely to remain excluded from the labour market, but it is also the base for the country's economic recovery and the engine of development. It is no accident that countries who invest the most in education reap the best benefits.
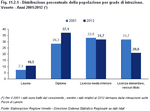
Veneto's population has significantly increased its level of education in little more than ten years: 47.6 % has at least a high school diploma in 2012 against 35.4 % in 2001. In particular, the number of college graduates increased three and a half percentage points, while that of high school graduates increased from 28.3 % to 37.1 % (Figure 11.2.1)
In the broader context of the Europe 2020 Strategy, human resources development has an additional function: to facilitate compatibility between growth and social inclusion. Indeed, this function is reflected by the choice of two targets in education: combating dropout rates, which must be reduced to 10 % by 2020, and raising the number of graduates who are 30 to 34 years of age to at least 40% in the next ten years.
The numbers show that in 2012 half of the countries of the European Union have already reached the target for graduates and some countries had rates above 45 %, beginning with Ireland, which reported more than half of its 30 to 34 year old population holding a college degree. Half of the EU countries also had less than 10 % dropout levels, with the lowest being found in Slovenia, where only 4.4% of 18 to 24 year olds have left school too early, i.e., those holding a lesser degree than a high school diploma and not enrolled in school or involved in educational activities lasting over 2 years.
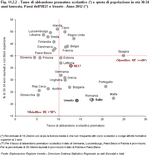
In general, the Nordic countries and Lithuania stand out with both goals already fully achieved. In Italy, however, even though its performance has had a marked improvement in recent years, there has been a number of 30 to 34 year old graduates equal to 21.7 %, the lowest of the twenty-seven countries, compared to the 35.8 % EU27 figure, and a dropout rate of 17.6 % against the European figure of 12.8 %. Veneto fared better as far as the share of young dropouts, 14.2%, while the percentage of college graduates was equal 21.4 %. This positive data puts our region in a good light. We have had a progressive increase in graduates over the years, which bodes well for the achievement of the target set at the national level, and in 2012 we achieved the objective of reducing dropout levels. Since the Italian regions started from lower levels, our government saw it fit to set more realistic national targets to be achieved by 2020, i.e., 26-27 % for tertiary education and 15-16 % for dropouts. (Figure 11.2.2)
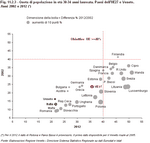
Considering the dynamics over the years in the proportion of 30 to 34 year old graduates, the most pronounced progress has been registered in Luxembourg and Lithuania, which have increased between 2002 and 2012, respectively, by twenty-six and twenty-five points, more than doubling their initial value, compared to the overall twelve point growth of the European Union. Conversely, the lowest growth was detected in Bulgaria, just 3.7 percentage points, showing a 26.9 % rate in 2012.
In Italy, there have been obvious developments, but not extensive: we went, in fact, from 13.1 % to 21.7 %, while Veneto went from 16.1 % in 2005 to 21.4 % in 2012. Liguria ranked first in Italy with an increase of eleven percentage points in seven years and a share of 27.5 %. Emilia Romagna also fared well, with a 28.6 percentage of 30 to 34 year old graduates equal to an increase of almost nine points. (Figure 11.2.3)
In general, the most significant increases in the proportion of Italian graduates have occurred in the early years of the university schedule reform, which introduced the new 3 + 2 system. The increase in numbers of students enrolled and degrees obtained that was the basic aim of the reorganization was indeed achieved in those years. However, starting from the 2004/2005 academic year, the reform's positive effects have gradually faded and a new phase of decline started, lasting up to the present day. In 2012, there were about 13 % fewer enrolments in Italy and 8 % in Veneto than ten years earlier. Not even the new Gelmini reform signed in 2011, which focused on having quality colleges, based on meritocracy, accountability, evaluation, and reward, attracted our young people living in this difficult time of crisis. We should perhaps consider that the decreased desire to pursue one's studies in this latter period might be due to the difficult situation that our country is experiencing. It may well be that young people do not want to be a burden on their families given that in these recent times holding a degree has not meant automatically getting a good job.
In detail, the indicator that measures the potential demand for participation in the university system reveals that the Italian share of 19 year olds holding a degree that could get them into college (approximate potential demand) has been decreasing in recent years. They recorded 73.8 % in 2009 / 2010 (70.3 % in Veneto), after having risen steadily from 2001 to 2006, the year when they reached a maximum of 77.5 % (73.3 % in Veneto). By the same talking, the indicator that measures how much potential college enrolment demand transforms into actual demand shows that the percentage rate of college enrolees and graduates went from Italy's 72.3 % and Veneto's 69 % recorded at the start of the century, respectively to 61.3 % and 61.8 % in 2010/2011.
There is therefore still much work to do to achieve our European objectives. (Figure 11.2.4)
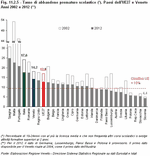
Considering the evolution of dropouts in recent years, progress has been more pronounced in Malta and Portugal showing a decrease between 2002 and 2012, respectively, 30.6 and 24.2 percentage points, but among all the countries of the European Union, theirs were still the highest rates along with Spain's. Luxembourg's progress can then be considered as the most significant with, a decrease of nine percentage points and objective already achieved. In general, all countries have been working very hard toward this objective; of course, lower achievements were observed for countries that started from already good rate values.
Italy did not fare badly, although it remained among the countries with the highest dropout levels, especially for the incidence found in the South that in ten years increased from 24.2% to 17.6%, a decrease higher than that recorded at the European level. Veneto did well, starting from a value lower than Italy's and reaching 18.1 % up from the 14.2 % of 2004. (Figure 11.2.5)
Italy's situation in 2010 was unusual: despite having a dropout rate of 18.8 %, far from the European average (14 %), it recorded a low 44 % employment rate of early school leavers, meaning that less than half of those who left the school system would work, 18.6 % were seeking work and as many as 37.6 % were idle. The situation was better in Veneto where at least 54 % of the dropouts found a job and 22% was looking.
An interesting observation would be how the changes occurred in the labour market also affected this age group: indeed, in 2005 Veneto those who came out of the school system too early still managed to find work in 71 % of cases compared with 53 % in 2011. Consequently, 11 % of them were seeking employment and 18 % were inactive in 2005, against, respectively, 15.4 % and 31.5 % in 2011. (Table 11.2.1)
Veneto's population keeps improving education standards
Although the process of transformation of the education system is in full swing, one may notice some social changes even ahead of institutional ones. Younger people's education levels have increased significantly over the years along with their families' inclination to invest in their future by devoting attention to the improvement of their knowledge and skills.Veneto's population has significantly increased its level of education in little more than ten years: 47.6 % has at least a high school diploma in 2012 against 35.4 % in 2001. In particular, the number of college graduates increased three and a half percentage points, while that of high school graduates increased from 28.3 % to 37.1 % (Figure 11.2.1)
In the broader context of the Europe 2020 Strategy, human resources development has an additional function: to facilitate compatibility between growth and social inclusion. Indeed, this function is reflected by the choice of two targets in education: combating dropout rates, which must be reduced to 10 % by 2020, and raising the number of graduates who are 30 to 34 years of age to at least 40% in the next ten years.
The numbers show that in 2012 half of the countries of the European Union have already reached the target for graduates and some countries had rates above 45 %, beginning with Ireland, which reported more than half of its 30 to 34 year old population holding a college degree. Half of the EU countries also had less than 10 % dropout levels, with the lowest being found in Slovenia, where only 4.4% of 18 to 24 year olds have left school too early, i.e., those holding a lesser degree than a high school diploma and not enrolled in school or involved in educational activities lasting over 2 years.
In general, the Nordic countries and Lithuania stand out with both goals already fully achieved. In Italy, however, even though its performance has had a marked improvement in recent years, there has been a number of 30 to 34 year old graduates equal to 21.7 %, the lowest of the twenty-seven countries, compared to the 35.8 % EU27 figure, and a dropout rate of 17.6 % against the European figure of 12.8 %. Veneto fared better as far as the share of young dropouts, 14.2%, while the percentage of college graduates was equal 21.4 %. This positive data puts our region in a good light. We have had a progressive increase in graduates over the years, which bodes well for the achievement of the target set at the national level, and in 2012 we achieved the objective of reducing dropout levels. Since the Italian regions started from lower levels, our government saw it fit to set more realistic national targets to be achieved by 2020, i.e., 26-27 % for tertiary education and 15-16 % for dropouts. (Figure 11.2.2)
Considering the dynamics over the years in the proportion of 30 to 34 year old graduates, the most pronounced progress has been registered in Luxembourg and Lithuania, which have increased between 2002 and 2012, respectively, by twenty-six and twenty-five points, more than doubling their initial value, compared to the overall twelve point growth of the European Union. Conversely, the lowest growth was detected in Bulgaria, just 3.7 percentage points, showing a 26.9 % rate in 2012.
In Italy, there have been obvious developments, but not extensive: we went, in fact, from 13.1 % to 21.7 %, while Veneto went from 16.1 % in 2005 to 21.4 % in 2012. Liguria ranked first in Italy with an increase of eleven percentage points in seven years and a share of 27.5 %. Emilia Romagna also fared well, with a 28.6 percentage of 30 to 34 year old graduates equal to an increase of almost nine points. (Figure 11.2.3)
In general, the most significant increases in the proportion of Italian graduates have occurred in the early years of the university schedule reform, which introduced the new 3 + 2 system. The increase in numbers of students enrolled and degrees obtained that was the basic aim of the reorganization was indeed achieved in those years. However, starting from the 2004/2005 academic year, the reform's positive effects have gradually faded and a new phase of decline started, lasting up to the present day. In 2012, there were about 13 % fewer enrolments in Italy and 8 % in Veneto than ten years earlier. Not even the new Gelmini reform signed in 2011, which focused on having quality colleges, based on meritocracy, accountability, evaluation, and reward, attracted our young people living in this difficult time of crisis. We should perhaps consider that the decreased desire to pursue one's studies in this latter period might be due to the difficult situation that our country is experiencing. It may well be that young people do not want to be a burden on their families given that in these recent times holding a degree has not meant automatically getting a good job.
In detail, the indicator that measures the potential demand for participation in the university system reveals that the Italian share of 19 year olds holding a degree that could get them into college (approximate potential demand) has been decreasing in recent years. They recorded 73.8 % in 2009 / 2010 (70.3 % in Veneto), after having risen steadily from 2001 to 2006, the year when they reached a maximum of 77.5 % (73.3 % in Veneto). By the same talking, the indicator that measures how much potential college enrolment demand transforms into actual demand shows that the percentage rate of college enrolees and graduates went from Italy's 72.3 % and Veneto's 69 % recorded at the start of the century, respectively to 61.3 % and 61.8 % in 2010/2011.
There is therefore still much work to do to achieve our European objectives. (Figure 11.2.4)
Improving educational outcomes for inclusive growth
Improving young people's educational attainments is consistent both with the European objective of smart growth, because it aims to advance the levels of skills, and with that of inclusive growth since it increases the integration into the labour market and contributes significantly to the decreased risk of unemployment and poverty.Considering the evolution of dropouts in recent years, progress has been more pronounced in Malta and Portugal showing a decrease between 2002 and 2012, respectively, 30.6 and 24.2 percentage points, but among all the countries of the European Union, theirs were still the highest rates along with Spain's. Luxembourg's progress can then be considered as the most significant with, a decrease of nine percentage points and objective already achieved. In general, all countries have been working very hard toward this objective; of course, lower achievements were observed for countries that started from already good rate values.
Italy did not fare badly, although it remained among the countries with the highest dropout levels, especially for the incidence found in the South that in ten years increased from 24.2% to 17.6%, a decrease higher than that recorded at the European level. Veneto did well, starting from a value lower than Italy's and reaching 18.1 % up from the 14.2 % of 2004. (Figure 11.2.5)
I dropped out of school...now what?
What do young people do when they drop out of school?Italy's situation in 2010 was unusual: despite having a dropout rate of 18.8 %, far from the European average (14 %), it recorded a low 44 % employment rate of early school leavers, meaning that less than half of those who left the school system would work, 18.6 % were seeking work and as many as 37.6 % were idle. The situation was better in Veneto where at least 54 % of the dropouts found a job and 22% was looking.
An interesting observation would be how the changes occurred in the labour market also affected this age group: indeed, in 2005 Veneto those who came out of the school system too early still managed to find work in 71 % of cases compared with 53 % in 2011. Consequently, 11 % of them were seeking employment and 18 % were inactive in 2005, against, respectively, 15.4 % and 31.5 % in 2011. (Table 11.2.1)
The influence of social status
This phenomenon becomes even more alarming when one considers that social disadvantage and a family of origin with a low level of education will condition early school leaving. In fact, one finds the greatest impacts of early school leavers where the parents' level of education or occupation is lowest. In 2011, 76 % of Veneto's dropouts lived in the household, and among these, 67 % came from families with lower levels of education, 55 % from parents with unskilled occupations or blue-collar workers and 14.4 % from unemployed parents. And not much has changed compared to six years ago although we must consider a trend toward improvement: in fact, compared to 2005, the proportion of dropouts belonging to less culturally elevated families has decreased along with the number of young people with unemployed parents. Unfortunately, social status weighs in heavily on this reality that will require more time to change. (Table 11.2.2)


