-
Statistical department’s site
Home page
Our publications
Chapter 8
The families of today and tomorrow: a question of balance
Sustainable development is seen as the ability to satisfy the needs of the current generation without compromising those of future generations (Brundtland, World Commission on Environment and Development, 1987). The concept is a fundamental aim of international treaties and has become central to EU policies.
The challenge is to maintain or improve quality of life long-term, without damaging the development of future generations, guaranteeing our children the chances that we have had and the freedom to choose how to build their own present and future. We therefore need to leave them sufficient resources and sufficient economic, environmental and social capital. An excessive exploitation of resources and living space, but also debts, high rates of youth unemployment and poor education, a lack of trust in society and institutions can hinder the wellbeing of future generations.
The concept places people at the centre, asking them to take responsibility for their future. It is an intergenerational view, founded on equity, social justice and equal rights, but there is also a reference to intragenerational equity, that is between current generations. This is because an imbalance today can lead to more severe levels of inequality tomorrow. Along with respect for the next generation, there is a need to respect today's generations who may be in difficulty.
After a brief introduction to the concept of development, this chapter deals with sustainability from a mainly intragenerational perspective, looking at families rather than individuals.
If growth for a society means financial and quantitative growth, the concept of development is much broader. It deals with both quantity and quality and concerns several aspects of life.
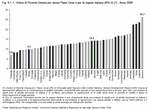
At a macro level, while recognising the importance of wealth as a measure of progress, there is an increasingly shared view that economic growth alone is not enough to define the development of a country. The literature cites various ways to estimate the degree of development of a region in an international context. Some indicators are more suitable for advanced countries while others for developing countries. For example, the Human Poverty Index (HPI) for OECD countries drawn up by the United Nations (United Nations, Human Development Report 2009) could be applied to more developed countries. It measures the extent and intensity of deprivation, not only in monetary terms and not only through macro-economic measures. Human development is a multidimensional concept, therefore as well as considering income, the indicator takes into account the lack of concrete opportunities in society which makes it difficult for individuals to achieve their ambitions. These include living as long as possible, enjoying good health, having a good standard of education in order to make informed, responsible choices, taking part actively in society, and having the guarantee of a certain standard of living for oneself and one's family. The summary indicator can be seen as the percentage of people in a state of deprivation who will find it difficult to make headway in society. The higher the value, the less favourable the country's situation.
On the basis of this indicator, Italy is not in the most favourable situation compared to other OECD member nations. The situation within Italy varies greatly, however, from North to South. Veneto is among the top regions in the ranking of OECD member nations and of Italian regions, with an index value comparable to that of some Northern European countries. (Figure 8.1.1)
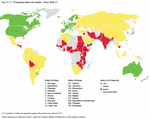
The Prosperity Index (Legatum Institute, Legatum Prosperity Index Report 2010) is a more detailed indicator because of the number of factors considered. According to this index, Italy is 25th in the ranking of over one hundred countries, with Norway in top position. There are 90 basic indicators and the areas taken into account are the economy, entrepreneurship and access to opportunities, governance, education, health, safety, individual freedom, social tolerance, and social capital. (Figure 8.1.2)
In Italy, just as is happening in other countries as recommended by the OECD and by the Stiglitz Commission, Italy's National Council for the Economy and Labour (CNEL) and its National Institute of Statistics (ISTAT) have set up the "Sector group for measuring the progress of Italian society". The aim is to develop a multidimensional approach to fair, sustainable wellbeing, which integrates GDP with other indicators, including those which concern inequalities and sustainability. The study, which should be complete by 2012, aims to develop eight fields of wellbeing, including the psychological and physical state of people, knowledge and the ability to understand the world we live in, labour, material wellbeing, the environment, interpersonal relations, participation in society and insecurity.
As far as the sustainability of development is concerned, this is measured by taking into account the stock of economic, environmental, social and human capital that the present generation will leave future generations.
Wellbeing should also concern personal satisfaction and happiness. A general sense of satisfaction with life, including certain aspects that are considered important, and a sense of fulfilment and optimism for the future have a positive impact on quality of life. Moreover, today's insecurity can limit one's ability to take advantage of current potential, thereby increasing uncertainty for the future.
Based on the self-evaluations of quality of life and society, within the European Union some differences in terms of subjective wellbeing have emerged. In EU15 countries, people state that they are on average happier and more satisfied with their lives, also because their current condition is not too far-removed from their ideal standards. They feel more integrated in society, sufficiently valorised and appreciated, and they do not complain of emotional problems, such as a lack of happiness or interest in life. Those living in the Eastern European area, despite lower levels of satisfaction and social inclusion, state that they are optimistic about the future, as much as they were in 2007, that is before the financial crisis.
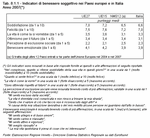
The Northern European Member States have the highest standards of wellbeing, whilst levels in Italy are medium-low. For example, according to the 2007 Eurofound survey (Note 1), in response to the question "All things considered, how satisfied would you say you are with your life these days?", on a scale from 1 to 10, Italians gave an average score of 6.6, while the EU15 average was 7.2.
Starting this year, Istat has begun publishing data for Italy and its regions, though this is not totally comparable with EU data (Note 2). For 2010, the national average for levels of satisfaction with life in general was 7.2. For Veneto it was 7.3 and almost 47% of the population aged 14 and over gave even higher scores of 8 or more (43% in Italy). There are no significant differences across genders. Young people give high scores and levels of satisfaction decrease with age. (Table 8.1.1)
Satisfaction concerns not only basic needs which guarantee a decent standard of living. In an advanced society, immaterial needs also are of value. These include the quality of education or of health, a sense of self-satisfaction, the intensity of relationships, active participation in society, free time activities and the ability to make informed choices.
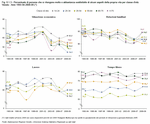
People are less satisfied with their financial wellbeing, job quality and amount of free time, while they feel fulfilled by relationships, friends and family, and with their health. Compared to other aspects that concern quality of life, obviously the financial situation of individuals has suffered the greatest effects of the current economic situation. The highest levels of satisfaction were reported in 2001-2002, a period of economic growth. These have gradually declined, in particular in 2008 when the crisis began. People aged 25 to 34, who have found it difficult to achieve financial independence, have been particularly hard hit. The 34-to-54-year-old category finds it difficult to meet the various needs of their families. A sense of job satisfaction has also been on the decrease since the beginning of the century, although less so than financial satisfaction. Young people who have recently entered the labour market are showing the greatest signs of dissatisfaction. Indeed the economic crisis has particularly affected young workers with temporary contracts. Apart from finding a job that is appropriate to their qualifications, young people are now concerned that they will be unable to keep their jobs.
Evaluation of the quality and availability of free time has not changed much over the years. Levels of satisfaction are highest amongst young people and the retired, indicating that the category in between finds it difficult to strike a balance between work and family commitments. People still claim that they are satisfied with their health and with relationships with friends. On the other hand, despite the recognised importance and value of the family for affection and both moral and material support, levels of satisfaction with family relationships have been decreasing over the years.
Deprivation, unemployment, low levels of education and poor health are some of the single major factors affecting levels of satisfaction with life in general. Another is the perception of the quality of the society in which one lives. This is evaluated for efficiency of public services, credibility of institutions, trust in others and interpersonal relationships. For this latter aspect, in Veneto 23% of the population state that they tend to trust others (22% at a national level), while 75% tend to be cautious and suspicious. In general, moreover, this lack of trust is stronger among young people and the elderly than amongst the 35-to-64-year-old age group. (Figure 8.1.3)
The following section focuses mainly on the financial opportunities that a region guarantees its citizens. Other aspects of the wider concept of sustainability, such as education or labour, sociality and support for the family and community network will be dealt with in other chapters of this volume or were dealt with in the 2010 Statistical Report.
If a person's financial resources are lacking, opportunities for development in terms of training and work will be limited. Such people risk not acquiring even the basic competences and skills to be able to reach an acceptable standard of living in the future.
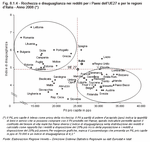
Wealth and financial resources contribute to the progress of a society, but this development is sustainable only if it guarantees equally distributed growth throughout the population, without any striking inequality between social classes. An analysis of data shows that at a European level, the distribution of income in EU countries and Italian regions with the highest GDP per capita is less unequal. There seems to be a positive relation between equity and economic growth, which partly depends on the fact that a more egalitarian society can guarantee high levels of education to everybody. If the children of less well-off families have access to high levels of education, this means that there is greater use of individual capabilities and greater production of wealth. (Figure 8.1.4)
Italy is not far off the European average. Its GDP per capita in purchasing power terms was €26,000 in 2008 and its inequality index stood at 5.2, meaning that the richest 20% of the population had a total income share that was five times higher than that of the poorest 20%. The distribution of income is less balanced compared to Scandinavian countries and the wealthier parts of the continental area. On the contrary, it is more balanced compared with the poorer states of Eastern Europe (Latvia, Romania, Bulgaria and Lithuania) and of the Mediterranean area (Portugal and Greece).
The relation between wealth and equality is not so clear for all countries as it depends on the various welfare models in each. For example, the United Kingdom and Spain have a higher level of inequality than the European average, even though they have a higher GDP per capita.
An analysis of the situation in Italy clearly shows the distinction between Northern and Central Italy, where most wealth appears to be better distributed, and the South, where poor resources go hand in hand with considerable imbalance. In Veneto the level of inequality, 3.9, is clearly lower than the national average and not too far from more egalitarian European countries such as Finland, Sweden and Austria. Along with a few other Italian regions, Veneto is at the top of a virtual regional ranking for sustainable economic development, revealing that it is able to increase its wealth without sacrificing social justice.
At a macro level, while recognising the importance of wealth as a measure of progress, there is an increasingly shared view that economic growth alone is not enough to define the development of a country. The literature cites various ways to estimate the degree of development of a region in an international context. Some indicators are more suitable for advanced countries while others for developing countries. For example, the Human Poverty Index (HPI) for OECD countries drawn up by the United Nations (United Nations, Human Development Report 2009) could be applied to more developed countries. It measures the extent and intensity of deprivation, not only in monetary terms and not only through macro-economic measures. Human development is a multidimensional concept, therefore as well as considering income, the indicator takes into account the lack of concrete opportunities in society which makes it difficult for individuals to achieve their ambitions. These include living as long as possible, enjoying good health, having a good standard of education in order to make informed, responsible choices, taking part actively in society, and having the guarantee of a certain standard of living for oneself and one's family. The summary indicator can be seen as the percentage of people in a state of deprivation who will find it difficult to make headway in society. The higher the value, the less favourable the country's situation.
On the basis of this indicator, Italy is not in the most favourable situation compared to other OECD member nations. The situation within Italy varies greatly, however, from North to South. Veneto is among the top regions in the ranking of OECD member nations and of Italian regions, with an index value comparable to that of some Northern European countries. (Figure 8.1.1)
The Prosperity Index (Legatum Institute, Legatum Prosperity Index Report 2010) is a more detailed indicator because of the number of factors considered. According to this index, Italy is 25th in the ranking of over one hundred countries, with Norway in top position. There are 90 basic indicators and the areas taken into account are the economy, entrepreneurship and access to opportunities, governance, education, health, safety, individual freedom, social tolerance, and social capital. (Figure 8.1.2)
In Italy, just as is happening in other countries as recommended by the OECD and by the Stiglitz Commission, Italy's National Council for the Economy and Labour (CNEL) and its National Institute of Statistics (ISTAT) have set up the "Sector group for measuring the progress of Italian society". The aim is to develop a multidimensional approach to fair, sustainable wellbeing, which integrates GDP with other indicators, including those which concern inequalities and sustainability. The study, which should be complete by 2012, aims to develop eight fields of wellbeing, including the psychological and physical state of people, knowledge and the ability to understand the world we live in, labour, material wellbeing, the environment, interpersonal relations, participation in society and insecurity.
As far as the sustainability of development is concerned, this is measured by taking into account the stock of economic, environmental, social and human capital that the present generation will leave future generations.
Wellbeing should also concern personal satisfaction and happiness. A general sense of satisfaction with life, including certain aspects that are considered important, and a sense of fulfilment and optimism for the future have a positive impact on quality of life. Moreover, today's insecurity can limit one's ability to take advantage of current potential, thereby increasing uncertainty for the future.
Based on the self-evaluations of quality of life and society, within the European Union some differences in terms of subjective wellbeing have emerged. In EU15 countries, people state that they are on average happier and more satisfied with their lives, also because their current condition is not too far-removed from their ideal standards. They feel more integrated in society, sufficiently valorised and appreciated, and they do not complain of emotional problems, such as a lack of happiness or interest in life. Those living in the Eastern European area, despite lower levels of satisfaction and social inclusion, state that they are optimistic about the future, as much as they were in 2007, that is before the financial crisis.
The Northern European Member States have the highest standards of wellbeing, whilst levels in Italy are medium-low. For example, according to the 2007 Eurofound survey (Note 1), in response to the question "All things considered, how satisfied would you say you are with your life these days?", on a scale from 1 to 10, Italians gave an average score of 6.6, while the EU15 average was 7.2.
Starting this year, Istat has begun publishing data for Italy and its regions, though this is not totally comparable with EU data (Note 2). For 2010, the national average for levels of satisfaction with life in general was 7.2. For Veneto it was 7.3 and almost 47% of the population aged 14 and over gave even higher scores of 8 or more (43% in Italy). There are no significant differences across genders. Young people give high scores and levels of satisfaction decrease with age. (Table 8.1.1)
Satisfaction concerns not only basic needs which guarantee a decent standard of living. In an advanced society, immaterial needs also are of value. These include the quality of education or of health, a sense of self-satisfaction, the intensity of relationships, active participation in society, free time activities and the ability to make informed choices.
People are less satisfied with their financial wellbeing, job quality and amount of free time, while they feel fulfilled by relationships, friends and family, and with their health. Compared to other aspects that concern quality of life, obviously the financial situation of individuals has suffered the greatest effects of the current economic situation. The highest levels of satisfaction were reported in 2001-2002, a period of economic growth. These have gradually declined, in particular in 2008 when the crisis began. People aged 25 to 34, who have found it difficult to achieve financial independence, have been particularly hard hit. The 34-to-54-year-old category finds it difficult to meet the various needs of their families. A sense of job satisfaction has also been on the decrease since the beginning of the century, although less so than financial satisfaction. Young people who have recently entered the labour market are showing the greatest signs of dissatisfaction. Indeed the economic crisis has particularly affected young workers with temporary contracts. Apart from finding a job that is appropriate to their qualifications, young people are now concerned that they will be unable to keep their jobs.
Evaluation of the quality and availability of free time has not changed much over the years. Levels of satisfaction are highest amongst young people and the retired, indicating that the category in between finds it difficult to strike a balance between work and family commitments. People still claim that they are satisfied with their health and with relationships with friends. On the other hand, despite the recognised importance and value of the family for affection and both moral and material support, levels of satisfaction with family relationships have been decreasing over the years.
Deprivation, unemployment, low levels of education and poor health are some of the single major factors affecting levels of satisfaction with life in general. Another is the perception of the quality of the society in which one lives. This is evaluated for efficiency of public services, credibility of institutions, trust in others and interpersonal relationships. For this latter aspect, in Veneto 23% of the population state that they tend to trust others (22% at a national level), while 75% tend to be cautious and suspicious. In general, moreover, this lack of trust is stronger among young people and the elderly than amongst the 35-to-64-year-old age group. (Figure 8.1.3)
Shared wellbeing and inequality
A society can be considered on the road to sustainable development if its economic growth is in harmony with nature, if social cohesion is in harmony with concepts of justice, opportunity and equal rights, and if there is a fair distribution of wellbeing and balanced access to economic, social and environmental resources. The following section focuses mainly on the financial opportunities that a region guarantees its citizens. Other aspects of the wider concept of sustainability, such as education or labour, sociality and support for the family and community network will be dealt with in other chapters of this volume or were dealt with in the 2010 Statistical Report.
If a person's financial resources are lacking, opportunities for development in terms of training and work will be limited. Such people risk not acquiring even the basic competences and skills to be able to reach an acceptable standard of living in the future.
Wealth and financial resources contribute to the progress of a society, but this development is sustainable only if it guarantees equally distributed growth throughout the population, without any striking inequality between social classes. An analysis of data shows that at a European level, the distribution of income in EU countries and Italian regions with the highest GDP per capita is less unequal. There seems to be a positive relation between equity and economic growth, which partly depends on the fact that a more egalitarian society can guarantee high levels of education to everybody. If the children of less well-off families have access to high levels of education, this means that there is greater use of individual capabilities and greater production of wealth. (Figure 8.1.4)
Italy is not far off the European average. Its GDP per capita in purchasing power terms was €26,000 in 2008 and its inequality index stood at 5.2, meaning that the richest 20% of the population had a total income share that was five times higher than that of the poorest 20%. The distribution of income is less balanced compared to Scandinavian countries and the wealthier parts of the continental area. On the contrary, it is more balanced compared with the poorer states of Eastern Europe (Latvia, Romania, Bulgaria and Lithuania) and of the Mediterranean area (Portugal and Greece).
The relation between wealth and equality is not so clear for all countries as it depends on the various welfare models in each. For example, the United Kingdom and Spain have a higher level of inequality than the European average, even though they have a higher GDP per capita.
An analysis of the situation in Italy clearly shows the distinction between Northern and Central Italy, where most wealth appears to be better distributed, and the South, where poor resources go hand in hand with considerable imbalance. In Veneto the level of inequality, 3.9, is clearly lower than the national average and not too far from more egalitarian European countries such as Finland, Sweden and Austria. Along with a few other Italian regions, Veneto is at the top of a virtual regional ranking for sustainable economic development, revealing that it is able to increase its wealth without sacrificing social justice.
Following this initial macro-economic analysis, we now look at financial resource management trends within families, especially in this current difficult situation.
For families, financial sustainability means being able to use their income for expenses and consumption today while being able to guarantee their children a good foundation for their adult life tomorrow.
One of the big changes is how childhood and adolescence are viewed. Following the economic boom, the shift from the patriarchal family of peasant origin to today's modern family means children are no longer considered as labour force for the home or the fields, but have become objects in which to invest so that they may reach their full potential. Parents make sacrifices today to provide their children with a secure future.
After Italy's economic recovery, in the 1970s a rise in social mobility marked the modernisation of the economy. Progressively there was new mass consumption and the family concentrated on increasing its capacity to spend and save, thanks to an increase in job opportunities and therefore in incomes. This led to the term "famiglia combinatoria", a "combined family" that emerged as an economic power with an income and which, through work and saving, contributed to the construction of the financial future of the future generations.
In the 1980s, following this accumulation and consolidation of wealth, the family increasingly aimed to make assets out of their savings (becoming known as "Famiglia S.p.a", or "Family PLC") and to make the most of their savings through safe forms of investment such as government bonds. The choice to take risks to establish and increase their own wealth, strengthened by widespread social wellbeing and growth on the financial markets, is seen as the natural evolution of a way to guarantee children a secure economic future.
In the 1990s, family income increased, both through income from work and investments. This led to a significant increase in the middle-income class. Well-established assets and positive signs from initial investments have led the family to up their investments, transferring them to those with greater yield, a result of the liberalisation of the financial market with foreign countries. The crisis of the welfare state however has led families to rethink some of the ways in which they manage their finances, with particular concern for the future wellbeing of their children: there has been an increase in private investment in health, assistance, education and social security to top up state help, as this is not always felt to be of high enough quality or able to satisfy the needs of families. Growing global competition requires enterprises to be increasingly flexible and new employees often find themselves without stable work. When a family has to provide its children with a network of protection, we speak about the "Famiglia competitiva" (Competitive family), which is concerned with increasing its efforts to provide for its members in a situation of growing social competitiveness.
Since the beginning of the 21st century there has been a sense of insecurity: the approach to investments has become more cautious, while there has been an increase in insurance policies to protect the wellbeing of children, even through investments in education. Savings are being used as support in times of unstable employment and irregular income. This is what we call the "Famiglia Tutor" (Tutor family), one which helps its children build their future, not only by providing financial support for education, but also by bailing them out in times of sudden need.
Material needs and, to a certain extent, immaterial needs, can only be fulfilled if there are sufficient financial resources. Not all families, however, can afford an adequate standard of living and the problems that they face change over the years, something which also depends on how the family evolves.
According to 2008 data, Veneto families have an average annual income of 37,465 euro, just over 3,100 euro a month and over 3,000 euro more than the national average (Note 3). This is a slight increase on average annual income for the previous year. However, most families have a lower income than the average mentioned above, as the distribution of income is asymmetrical and the average is not exactly the central value. In Veneto half of all families have a maximum income of 33,200 euro a year, the mean, and the other half have a higher income. (Figure 8.2.1)
The situation across Italian regions is varied: Veneto tops the ranking along with many Northern and some Central regions, whilst Southern regions are at the bottom. Numerous reasons account for this variability, apart from the liveliness of businesses, production systems and employment levels.
Where a family is placed on the income scale also depends on the source of income of each member. That is, it depends on whether the member is employed, self-employed or a pensioner, on the number of income earners and on the size of the family. (Figure 8.2.2)
It is clear that the relation between the number of income earners and dependent members of the family has a significant effect on the family's financial situation. An income earner is a person who contributes even a small amount to the total family income. Dependent members are usually minors, housewives, people with disabilities or elderly family members without a pension or any form of social security.
Taking the classic nuclear family as a model, the number of incomes depends not only on investment in human capital while the children are in education, on how long it takes to find a job and on job opportunities themselves, but also on negotiation within the couple concerning work commitments and domestic needs.
In Italy, the model with a main breadwinner, usually the man, who is responsible for the financial needs of the family, is more typical in the South of Italy. There 48% of families follow this model, compared with around 40% in the Centre and the North. In the South this main source of income generally comes from work as an employee. In very rare cases the woman is the only breadwinner, and when this is the case it is usually temporary, for example if the man is briefly unemployed, rather than because traditional roles have been permanently reversed.
The alternative to the main breadwinner model is the dual earner model, where both partners contribute to family upkeep, though the proportion may be different as usually the man earns more. The exception is in Sicilia and Liguria where for different reasons most families have a single income. In all the other Italian regions most families have at least two earners. In Veneto 45.9% of families are dual income, 17.2% have three or more incomes.
What is more, because of more numerous families and higher levels of unemployment, in the Southern regions the number of dependent members of the family is higher than the number of earners. In the South 29.4% of single income families have two or more members to maintain, while the share is around 10% in Northern regions (15.6% in Veneto). Even in families with three or more income earners, in the South 13.9% have to provide for two or more dependent members. The figure is 9.7% for Italy and just 8.1% for Veneto. (Table 8.2.1) and (Figure 8.2.3)
The figures show that the average family income has risen over the years, including in Veneto: in 2003 on average a family earned 33,878 euro a year, whilst by 2008 this figure had risen by just under 4,000 euro. However, it is commonly felt that the amount of money earned by each family has anything but risen. This is particularly the case during a financial crisis when the monthly salary seems far from adequate. In fact, if the average national salary over previous years is analysed according to certain parameters as if it had today's purchasing power, it becomes clear that the average family income has remained largely unchanged. (Figure 8.2.4)
It is therefore not surprising that 37% of Veneto families claim that their income has dropped over the last 12 months. In some cases this may be due to a reduction in income if jobs have been lost and income earners are on the Wages Guarantee Fund, or working hours may have been cut, as indicated by the Veneto families (almost 30%) who claim that their situation has worsened. However, it is more likely that it depends on the perception that their income is not high enough to meet the rising prices of goods and services. Families with children, who have to guarantee a decent standard of living and pay for their upbringing, are the first to complain that their salary is inadequate.
To compare the financial situation of families of different sizes and make-up, therefore with different needs, and to take into account scale economies, it is more opportune to consider the equivalent family income, which is calculated by applying set parameters (Note 4).
Single-parent families with dependent children have the lowest levels of income, so much so that 26% are below the lowest fifth of income (Note 5) (12,276 euro). Moreover single-parent families have seen the greatest decrease in income in recent years. Young single people and elderly people living alone have problems, while young couples without children have the greatest financial tranquillity. (Table 8.2.2)
Although average incomes are not that high, elderly couples without dependent children are the category that has had a slight but steady increase in income over recent years. There has been a slight increase in income for "other family categories", who on average have high incomes. These are mainly mature couples with grown-up children who no longer live at home.
There are oscillating trends for single people and young couples, probably because they have not yet reached financial stability and are influenced by the trends in the employment market, even though the sharp drop in income over the last year cannot be ignored. (Figure 8.2.5)
A comparison with Europe reveals that some types of family are at a particular disadvantage. Within each country the financial situation for a specific category of family is compared with that of an average generic family, comparing relative incomes to highlight levels of inequality. Scores above one indicate a higher than average financial situation for that category, while scores below one indicate families with lower than average incomes. (Table 8.2.3)
Practically all over Europe the better off families are couples without dependent children, where generally there are multiple incomes as grown-up children living at home contribute to the family income. The birth of a child does not always have a negative effect on the financial situation of a family: in Northern European countries, for example, couples with two children have a higher income than the national average. This is probably thanks to welfare systems that respond to families' needs, as well as to the fact that more women work. On the other hand, in Italy and in Veneto, having children means greater financial difficulty, more so than in the other EU15 countries, especially if couples have more than two children. All over Europe elderly people living alone and single-parent families are financially vulnerable.
For families, financial sustainability means being able to use their income for expenses and consumption today while being able to guarantee their children a good foundation for their adult life tomorrow.
From optimism to caution
Along with the cultural and economic evolution of society, over the decades Italian families have learned to help their children build their futures in different ways. A study by Censis, Italy's Social Investments Study Centre (Censis, 2003) attempted to track the main stages of evolution of the Italian family over time in terms of managing their own financial situation. One of the big changes is how childhood and adolescence are viewed. Following the economic boom, the shift from the patriarchal family of peasant origin to today's modern family means children are no longer considered as labour force for the home or the fields, but have become objects in which to invest so that they may reach their full potential. Parents make sacrifices today to provide their children with a secure future.
After Italy's economic recovery, in the 1970s a rise in social mobility marked the modernisation of the economy. Progressively there was new mass consumption and the family concentrated on increasing its capacity to spend and save, thanks to an increase in job opportunities and therefore in incomes. This led to the term "famiglia combinatoria", a "combined family" that emerged as an economic power with an income and which, through work and saving, contributed to the construction of the financial future of the future generations.
In the 1980s, following this accumulation and consolidation of wealth, the family increasingly aimed to make assets out of their savings (becoming known as "Famiglia S.p.a", or "Family PLC") and to make the most of their savings through safe forms of investment such as government bonds. The choice to take risks to establish and increase their own wealth, strengthened by widespread social wellbeing and growth on the financial markets, is seen as the natural evolution of a way to guarantee children a secure economic future.
In the 1990s, family income increased, both through income from work and investments. This led to a significant increase in the middle-income class. Well-established assets and positive signs from initial investments have led the family to up their investments, transferring them to those with greater yield, a result of the liberalisation of the financial market with foreign countries. The crisis of the welfare state however has led families to rethink some of the ways in which they manage their finances, with particular concern for the future wellbeing of their children: there has been an increase in private investment in health, assistance, education and social security to top up state help, as this is not always felt to be of high enough quality or able to satisfy the needs of families. Growing global competition requires enterprises to be increasingly flexible and new employees often find themselves without stable work. When a family has to provide its children with a network of protection, we speak about the "Famiglia competitiva" (Competitive family), which is concerned with increasing its efforts to provide for its members in a situation of growing social competitiveness.
Since the beginning of the 21st century there has been a sense of insecurity: the approach to investments has become more cautious, while there has been an increase in insurance policies to protect the wellbeing of children, even through investments in education. Savings are being used as support in times of unstable employment and irregular income. This is what we call the "Famiglia Tutor" (Tutor family), one which helps its children build their future, not only by providing financial support for education, but also by bailing them out in times of sudden need.
Family income
Being able to count on a stable income which is sufficient for the size of the family and its desired lifestyle gives a sense of security and passes the desire to make plans on to future generations, those of our children and grandchildren. This is a need that today's "Tutor family" cannot ignore. Material needs and, to a certain extent, immaterial needs, can only be fulfilled if there are sufficient financial resources. Not all families, however, can afford an adequate standard of living and the problems that they face change over the years, something which also depends on how the family evolves.
According to 2008 data, Veneto families have an average annual income of 37,465 euro, just over 3,100 euro a month and over 3,000 euro more than the national average (Note 3). This is a slight increase on average annual income for the previous year. However, most families have a lower income than the average mentioned above, as the distribution of income is asymmetrical and the average is not exactly the central value. In Veneto half of all families have a maximum income of 33,200 euro a year, the mean, and the other half have a higher income. (Figure 8.2.1)
The situation across Italian regions is varied: Veneto tops the ranking along with many Northern and some Central regions, whilst Southern regions are at the bottom. Numerous reasons account for this variability, apart from the liveliness of businesses, production systems and employment levels.
Where a family is placed on the income scale also depends on the source of income of each member. That is, it depends on whether the member is employed, self-employed or a pensioner, on the number of income earners and on the size of the family. (Figure 8.2.2)
It is clear that the relation between the number of income earners and dependent members of the family has a significant effect on the family's financial situation. An income earner is a person who contributes even a small amount to the total family income. Dependent members are usually minors, housewives, people with disabilities or elderly family members without a pension or any form of social security.
Taking the classic nuclear family as a model, the number of incomes depends not only on investment in human capital while the children are in education, on how long it takes to find a job and on job opportunities themselves, but also on negotiation within the couple concerning work commitments and domestic needs.
In Italy, the model with a main breadwinner, usually the man, who is responsible for the financial needs of the family, is more typical in the South of Italy. There 48% of families follow this model, compared with around 40% in the Centre and the North. In the South this main source of income generally comes from work as an employee. In very rare cases the woman is the only breadwinner, and when this is the case it is usually temporary, for example if the man is briefly unemployed, rather than because traditional roles have been permanently reversed.
The alternative to the main breadwinner model is the dual earner model, where both partners contribute to family upkeep, though the proportion may be different as usually the man earns more. The exception is in Sicilia and Liguria where for different reasons most families have a single income. In all the other Italian regions most families have at least two earners. In Veneto 45.9% of families are dual income, 17.2% have three or more incomes.
What is more, because of more numerous families and higher levels of unemployment, in the Southern regions the number of dependent members of the family is higher than the number of earners. In the South 29.4% of single income families have two or more members to maintain, while the share is around 10% in Northern regions (15.6% in Veneto). Even in families with three or more income earners, in the South 13.9% have to provide for two or more dependent members. The figure is 9.7% for Italy and just 8.1% for Veneto. (Table 8.2.1) and (Figure 8.2.3)
The figures show that the average family income has risen over the years, including in Veneto: in 2003 on average a family earned 33,878 euro a year, whilst by 2008 this figure had risen by just under 4,000 euro. However, it is commonly felt that the amount of money earned by each family has anything but risen. This is particularly the case during a financial crisis when the monthly salary seems far from adequate. In fact, if the average national salary over previous years is analysed according to certain parameters as if it had today's purchasing power, it becomes clear that the average family income has remained largely unchanged. (Figure 8.2.4)
It is therefore not surprising that 37% of Veneto families claim that their income has dropped over the last 12 months. In some cases this may be due to a reduction in income if jobs have been lost and income earners are on the Wages Guarantee Fund, or working hours may have been cut, as indicated by the Veneto families (almost 30%) who claim that their situation has worsened. However, it is more likely that it depends on the perception that their income is not high enough to meet the rising prices of goods and services. Families with children, who have to guarantee a decent standard of living and pay for their upbringing, are the first to complain that their salary is inadequate.
Inequality between families: income in every phase of life
Considering the different types of families, there is a close relationship between financial situation and a family's life cycle. People go through different phases during which the structure of their family and their financial situation change, as do needs and preferences. To compare the financial situation of families of different sizes and make-up, therefore with different needs, and to take into account scale economies, it is more opportune to consider the equivalent family income, which is calculated by applying set parameters (Note 4).
Single-parent families with dependent children have the lowest levels of income, so much so that 26% are below the lowest fifth of income (Note 5) (12,276 euro). Moreover single-parent families have seen the greatest decrease in income in recent years. Young single people and elderly people living alone have problems, while young couples without children have the greatest financial tranquillity. (Table 8.2.2)
Although average incomes are not that high, elderly couples without dependent children are the category that has had a slight but steady increase in income over recent years. There has been a slight increase in income for "other family categories", who on average have high incomes. These are mainly mature couples with grown-up children who no longer live at home.
There are oscillating trends for single people and young couples, probably because they have not yet reached financial stability and are influenced by the trends in the employment market, even though the sharp drop in income over the last year cannot be ignored. (Figure 8.2.5)
A comparison with Europe reveals that some types of family are at a particular disadvantage. Within each country the financial situation for a specific category of family is compared with that of an average generic family, comparing relative incomes to highlight levels of inequality. Scores above one indicate a higher than average financial situation for that category, while scores below one indicate families with lower than average incomes. (Table 8.2.3)
Practically all over Europe the better off families are couples without dependent children, where generally there are multiple incomes as grown-up children living at home contribute to the family income. The birth of a child does not always have a negative effect on the financial situation of a family: in Northern European countries, for example, couples with two children have a higher income than the national average. This is probably thanks to welfare systems that respond to families' needs, as well as to the fact that more women work. On the other hand, in Italy and in Veneto, having children means greater financial difficulty, more so than in the other EU15 countries, especially if couples have more than two children. All over Europe elderly people living alone and single-parent families are financially vulnerable.
Figure 8.2.1
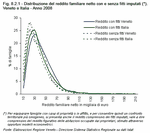
Figure 8.2.2

Table 8.2.1
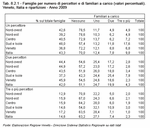
Figure 8.2.3

Figure 8.2.4

Table 8.2.2

Figure 8.2.5
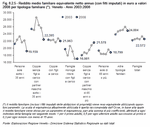
Table 8.2.3

The analysis of income as a family's main financial resource should be combined with a description of savings and consumption to understand the extent to which and how the resources are used. The balance between income and spending finds its place within the financial sustainability of the family, especially considering the recent economic crisis that has led to a reduction in resources and the need to make sacrifices.
One of the medium-long-term strategies to guarantee a family's financial security is saving, which, along with increased caution in spending, can be vital in case of emergencies or unexpected situations. Nowadays, however, saving is not that easy, even though it is a desire shared by those who wish to put something aside for their children so that they can cope with times of financial hardship or simply manage to make important purchases. In 2009, well over half of Veneto families (63.2%) did not manage to make any savings, and of these 5.1% fell into debt, while 19.6% lost assets, an increase on figures for 2006. Many families managed to save, but less so than before (16.4% of families in Veneto). Elderly people living alone (66.4%) complained about not being able to put money aside, while young couples without children were the category that managed to put aside most money as an investment in their future family. (Table 8.3.1)
Limited resources, however, can make consumers more aware of their behaviour, leading to more careful purchasing choices that avoid waste and enable them to save something.
While data on income is only available up to 2008, information on spending up to 2009 gives a view of how families have reacted to the recent economic crisis. In real terms, that is transforming monetary values for the period into 2009 values, consumption expenditure from 2003 to today follows a constant trend, dropping in the last two years in relation to the crisis. In the last year alone, household consumption dropped by 2.5% in real terms. By 2009 the average value per family was 2,442 euro a month. Half of Italian families, however, spend less than 2,020 euro.
Despite the reduction in spending, down by 4.7% in the last year, in Veneto monthly spending on consumer goods has remained consistently above the national average and in 2009 was 2,857 euro, the second highest value after Lombardia. (Figure 8.3.1)
Expenditure on foodstuffs and beverages, 444 euro, fell by 5.3% (3.7% in Italy) and expenditure on non-foodstuff services and products by 4.5% (2.2% in Italy). In this latter category, however, there are variations according to the kind of spending considered. For example, spending on health care, transport, free time and culture has dropped considerably. On the other hand, there has been an increase in spending on education, housing, fuel and energy (possibly because of the long, harsh winter). (Figure 8.3.2)
A long-term analysis of the different categories of spending highlights the evolution of families' needs, deriving from changes in the social and demographic make-up of the country. For example, there has been an increase in consumption by adolescents, who often affect the family's purchasing choices. The needs of an ageing population have been revealed and new needs linked to lifestyle and new technologies have emerged. However, the period considered here, 2003 to 2009, is too short to reveal such clear-cut structural variations. The analysis reveals, rather, that purchasing choices over the last two years are particularly indicative of less disposable income. The crisis has led to a reduction in spending on luxury and non-essential goods, including cars, certain electrical appliances and furniture. As with other durable goods, in fact, this type of product is usually a considerable expense and, in times of financial hardship, people tend to put off making such purchases.
The reduction in spending on foodstuffs reflects the downward trend at a national level over recent years and is due to less favourable financial circumstances. However, it is also due to changes in lifestyle, with people aiming to have a healthier, balanced diet. Moreover, because of work commitments, a growing number of people eat out and this is classified by Istat as "other goods and services" rather than spending on foodstuffs.
The crisis has led to a reduction in the quantity of food purchased and, in some cases, has even had an effect on the quality of food purchased. Although most Veneto consumers declare that they buy as much as before in terms of quantity and quality, a significant percentage admits that they have had to cut down. To avoid cutting down on quality, in 2009 around one quarter of Veneto families reduced the purchase of basic foodstuffs, such as bread (24.8%), pasta (24.3%), meat (28.7%), fish (28.8%) and fruit and vegetables (24.5%). A total of 4% of the population has reduced the quantity of these products, choosing to compromise on quality.
As for expenditure on clothing and footwear, over one third of Veneto families (38.2% in Italy) bought less than the previous year, and 11.5%, as well as having bought less, chose lower quality products (14.5% in Italy). (Figure 8.3.3)
Even though the situation in Veneto is decidedly better than elsewhere, having to go without these necessary products indicates general impoverishment, with families struggling to maintain their desired standard of living. It should be noted that expenditure on health care has decreased. After day-to-day living costs, such as housing, food and transport, many families have an increasingly limited amount of money to spend on their health, specialised tests, medical appointments and dental care.
Due to the economic crisis, it has become necessary to prioritise when budget-making, taking into account the limits set by certain essential expenses. The main expense is the home, which takes up almost 30% of total expenditure, a rise on the share for 2007.
For this reason the following section looks in more depth at the financial sustainability of the home.
From a financial perspective, it is a durable good, an asset that can maintain or increase its value over time. Unlike other goods, it can be used as a guarantee for a loan, increasing the family's purchasing power.
However, not all families can afford a home that fits their needs. What is more, the economic crisis seems to have worsened already difficult situations. Sometimes the cost of the home weighs heavily on the family budget, making life difficult for those at risk of poverty or living in conditions of hardship. Once household expenditure is covered families are left without sufficient resources for other essential needs.
Household expenditure depends on various factors such as the property market, maintenance costs and bills. It also depends on individual choices, for example some people prefer to invest in the home rather than spend on other goods, spending money to make it more attractive and improve its quality, thereby increasing not only levels of comfort but also its value.
If expenses (Note 6) for utilities and ordinary maintenance, rent and mortgage payments are taken into account, in 2009 Veneto families spent an average of 423 euro a month on their home, 15.9% of their income (Note 7). Naturally costs depend on whether the family rents or on whether it has a mortgage to pay.
Mortgageless homeowners (56.3% of Veneto families) are in the most favourable condition as they just have to pay bills and ordinary maintenance, which makes up 9.2% of their income, around 260 euro, a figure that has remained stable over the years.
Over the last six years, the number of families with a mortgage has risen from 14.4% to 16.8%, that is almost one quarter of all homeowners. Whether the mortgage is due to choice or necessity, these families are exposed to greater risks as in a few years monthly rates have risen by around 200 euro, peaking at 720 euro in 2009 and accounting for 22.6% of the family budget. Adding up the bills, the figure amounts to 965 euro a month, around 30% of the family's income.
People in rented accommodation, around 15.9% of Veneto families, also face financial hardship. Rent accounts for 21.6% of income, but average monthly payments are just over 400 euro, which shows that families who rent tend to have a lower income. The rent, therefore, takes out a larger chunk of their income. If the cost of utilities is added, 32% of income is spent on the home (around 600 euro). (Figure 8.3.5)
In general, the situation becomes excessive and unsustainable if it is necessary to spend over 40% of one's income on household expenses (Note 8). There are notable differences between EU Member States due to a number of factors, even when socio-economic factors are taken into account. In certain cases, the least well-off people have to spend over 40% of their income on poor quality housing, where there may be structural problems and a lack of space. In this case the indicator shows severe financial hardship. In other cases people may choose to spend a lot on their home to guarantee higher standards of living. This is true in wealthier contexts where families can afford it.
The EU Member States that were once under the Communist regimes are a case apart. In that period homes were state property and after the fall of Communism many families became owners of their homes. However, the buildings' structure and systems were often poor quality and therefore costly maintenance was necessary.
A total of 12.2% of the EU population spends more than 40% of income on the home. The countries with the highest expenses are Denmark, Germany and Greece. The reverse situation can be seen in Cyprus, France, Malta and Luxembourg.
Veneto and Italy are in the middle, with 6.8% and 7.6% of the population respectively having high expenses. This includes 8.9% of Veneto families and 34.6% of those families in rented property, higher than the national percentage and higher than 2004 figures. Buying a home can also put too much strain on a family's finances, as it requires considerable investment. However, the percentage of families with a mortgage that claims to have expenses higher than the threshold for sustainability is considerably lower than the percentage of families in rented accommodation. (Figure 8.3.6) and (Figure 8.3.7)
A total of 8% of Veneto families find it difficult to pay the rent, 12.9% for Italy, and 7.5% find it difficult to pay the mortgage (Note 9). Moreover, 6.2% are behind with bills, compared with 9.2% at a national level. Even if families manage to respect the due dates for payments, many of them still regard spending on the home as a problem and difficult to keep up with. Mortgage payments are particularly difficult and are seen as a considerable burden by 62.6% of Veneto mortgage holders.
To simplify comparisons between Veneto and Italy and to measure the gap between different types of families, a summary indicator of household expenditure sustainability has been created. This takes into account both household expenditure and how families perceive the effort required to pay for these expenses. The indicator therefore has both an objective and a subjective dimension and varies from 0 to 100, where 100 is the most favourable situation, that is highest sustainability (Note 10).
In terms of overall sustainability, there are no significant differences between the situation in Veneto and the rest of Italy. The indicator's average score is 74.4 out of 100 for Veneto and 75 for Italy (Note 11). However, Veneto is one of the regions where housing sustainability seems most difficult. In fact only Liguria, Piemonte, Lombardia, Campania and Emilia Romagna are worse off. Household expenditure is probably higher because of the high prices on the housing market and an increased number of mortgages, but also because of different life expectancies, so families invest a higher proportion of their income in the home in an attempt to improve its quality. (Figure 8.3.8)
Household expenditure is more sustainable for families with children and especially for elderly couples. On the other hand people aged under 35 living alone and single-parent families have more difficulties, as do young couples without children and elderly people living alone, for whom the overall score is below 70 out of 100. The differences are mainly due to the objective component of the indicator, i.e. the proportion of income spent on the home, and whether the family has enough money left for other expenses and enough to maintain an acceptable standard of living. There is less variability in the subjective component, in the perception and evaluation expressed about the burden of expenses.
In general, compared to 2004, families are worse off, especially in situations that were already critical. The financial sustainability of young people living alone has dropped by almost 10 points, by around 6 points for the elderly and by 4 for families with children. Sustainability is worse especially for single parents and elderly people living alone.
At a national level the situation is similar, with the same differences between different types of families, though the levels may vary slightly. Unlike the situation in Veneto, however, over 5 years household expenditure sustainability has worsened in particular for young couples without children. (Table 8.3.2)
One of the medium-long-term strategies to guarantee a family's financial security is saving, which, along with increased caution in spending, can be vital in case of emergencies or unexpected situations. Nowadays, however, saving is not that easy, even though it is a desire shared by those who wish to put something aside for their children so that they can cope with times of financial hardship or simply manage to make important purchases. In 2009, well over half of Veneto families (63.2%) did not manage to make any savings, and of these 5.1% fell into debt, while 19.6% lost assets, an increase on figures for 2006. Many families managed to save, but less so than before (16.4% of families in Veneto). Elderly people living alone (66.4%) complained about not being able to put money aside, while young couples without children were the category that managed to put aside most money as an investment in their future family. (Table 8.3.1)
Limited resources, however, can make consumers more aware of their behaviour, leading to more careful purchasing choices that avoid waste and enable them to save something.
While data on income is only available up to 2008, information on spending up to 2009 gives a view of how families have reacted to the recent economic crisis. In real terms, that is transforming monetary values for the period into 2009 values, consumption expenditure from 2003 to today follows a constant trend, dropping in the last two years in relation to the crisis. In the last year alone, household consumption dropped by 2.5% in real terms. By 2009 the average value per family was 2,442 euro a month. Half of Italian families, however, spend less than 2,020 euro.
Despite the reduction in spending, down by 4.7% in the last year, in Veneto monthly spending on consumer goods has remained consistently above the national average and in 2009 was 2,857 euro, the second highest value after Lombardia. (Figure 8.3.1)
Expenditure on foodstuffs and beverages, 444 euro, fell by 5.3% (3.7% in Italy) and expenditure on non-foodstuff services and products by 4.5% (2.2% in Italy). In this latter category, however, there are variations according to the kind of spending considered. For example, spending on health care, transport, free time and culture has dropped considerably. On the other hand, there has been an increase in spending on education, housing, fuel and energy (possibly because of the long, harsh winter). (Figure 8.3.2)
A long-term analysis of the different categories of spending highlights the evolution of families' needs, deriving from changes in the social and demographic make-up of the country. For example, there has been an increase in consumption by adolescents, who often affect the family's purchasing choices. The needs of an ageing population have been revealed and new needs linked to lifestyle and new technologies have emerged. However, the period considered here, 2003 to 2009, is too short to reveal such clear-cut structural variations. The analysis reveals, rather, that purchasing choices over the last two years are particularly indicative of less disposable income. The crisis has led to a reduction in spending on luxury and non-essential goods, including cars, certain electrical appliances and furniture. As with other durable goods, in fact, this type of product is usually a considerable expense and, in times of financial hardship, people tend to put off making such purchases.
The reduction in spending on foodstuffs reflects the downward trend at a national level over recent years and is due to less favourable financial circumstances. However, it is also due to changes in lifestyle, with people aiming to have a healthier, balanced diet. Moreover, because of work commitments, a growing number of people eat out and this is classified by Istat as "other goods and services" rather than spending on foodstuffs.
The crisis has led to a reduction in the quantity of food purchased and, in some cases, has even had an effect on the quality of food purchased. Although most Veneto consumers declare that they buy as much as before in terms of quantity and quality, a significant percentage admits that they have had to cut down. To avoid cutting down on quality, in 2009 around one quarter of Veneto families reduced the purchase of basic foodstuffs, such as bread (24.8%), pasta (24.3%), meat (28.7%), fish (28.8%) and fruit and vegetables (24.5%). A total of 4% of the population has reduced the quantity of these products, choosing to compromise on quality.
As for expenditure on clothing and footwear, over one third of Veneto families (38.2% in Italy) bought less than the previous year, and 11.5%, as well as having bought less, chose lower quality products (14.5% in Italy). (Figure 8.3.3)
Even though the situation in Veneto is decidedly better than elsewhere, having to go without these necessary products indicates general impoverishment, with families struggling to maintain their desired standard of living. It should be noted that expenditure on health care has decreased. After day-to-day living costs, such as housing, food and transport, many families have an increasingly limited amount of money to spend on their health, specialised tests, medical appointments and dental care.
Due to the economic crisis, it has become necessary to prioritise when budget-making, taking into account the limits set by certain essential expenses. The main expense is the home, which takes up almost 30% of total expenditure, a rise on the share for 2007.
For this reason the following section looks in more depth at the financial sustainability of the home.
Sustaining household expenses
A quality place to live at sustainable prices is a fundamental need and right. Moreover, the home is an important factor in social inclusion as it is the centre of family life and relationships with friends, relatives and neighbours. From a financial perspective, it is a durable good, an asset that can maintain or increase its value over time. Unlike other goods, it can be used as a guarantee for a loan, increasing the family's purchasing power.
However, not all families can afford a home that fits their needs. What is more, the economic crisis seems to have worsened already difficult situations. Sometimes the cost of the home weighs heavily on the family budget, making life difficult for those at risk of poverty or living in conditions of hardship. Once household expenditure is covered families are left without sufficient resources for other essential needs.
Household expenditure depends on various factors such as the property market, maintenance costs and bills. It also depends on individual choices, for example some people prefer to invest in the home rather than spend on other goods, spending money to make it more attractive and improve its quality, thereby increasing not only levels of comfort but also its value.
If expenses (Note 6) for utilities and ordinary maintenance, rent and mortgage payments are taken into account, in 2009 Veneto families spent an average of 423 euro a month on their home, 15.9% of their income (Note 7). Naturally costs depend on whether the family rents or on whether it has a mortgage to pay.
Mortgageless homeowners (56.3% of Veneto families) are in the most favourable condition as they just have to pay bills and ordinary maintenance, which makes up 9.2% of their income, around 260 euro, a figure that has remained stable over the years.
Over the last six years, the number of families with a mortgage has risen from 14.4% to 16.8%, that is almost one quarter of all homeowners. Whether the mortgage is due to choice or necessity, these families are exposed to greater risks as in a few years monthly rates have risen by around 200 euro, peaking at 720 euro in 2009 and accounting for 22.6% of the family budget. Adding up the bills, the figure amounts to 965 euro a month, around 30% of the family's income.
People in rented accommodation, around 15.9% of Veneto families, also face financial hardship. Rent accounts for 21.6% of income, but average monthly payments are just over 400 euro, which shows that families who rent tend to have a lower income. The rent, therefore, takes out a larger chunk of their income. If the cost of utilities is added, 32% of income is spent on the home (around 600 euro). (Figure 8.3.5)
In general, the situation becomes excessive and unsustainable if it is necessary to spend over 40% of one's income on household expenses (Note 8). There are notable differences between EU Member States due to a number of factors, even when socio-economic factors are taken into account. In certain cases, the least well-off people have to spend over 40% of their income on poor quality housing, where there may be structural problems and a lack of space. In this case the indicator shows severe financial hardship. In other cases people may choose to spend a lot on their home to guarantee higher standards of living. This is true in wealthier contexts where families can afford it.
The EU Member States that were once under the Communist regimes are a case apart. In that period homes were state property and after the fall of Communism many families became owners of their homes. However, the buildings' structure and systems were often poor quality and therefore costly maintenance was necessary.
A total of 12.2% of the EU population spends more than 40% of income on the home. The countries with the highest expenses are Denmark, Germany and Greece. The reverse situation can be seen in Cyprus, France, Malta and Luxembourg.
Veneto and Italy are in the middle, with 6.8% and 7.6% of the population respectively having high expenses. This includes 8.9% of Veneto families and 34.6% of those families in rented property, higher than the national percentage and higher than 2004 figures. Buying a home can also put too much strain on a family's finances, as it requires considerable investment. However, the percentage of families with a mortgage that claims to have expenses higher than the threshold for sustainability is considerably lower than the percentage of families in rented accommodation. (Figure 8.3.6) and (Figure 8.3.7)
A total of 8% of Veneto families find it difficult to pay the rent, 12.9% for Italy, and 7.5% find it difficult to pay the mortgage (Note 9). Moreover, 6.2% are behind with bills, compared with 9.2% at a national level. Even if families manage to respect the due dates for payments, many of them still regard spending on the home as a problem and difficult to keep up with. Mortgage payments are particularly difficult and are seen as a considerable burden by 62.6% of Veneto mortgage holders.
To simplify comparisons between Veneto and Italy and to measure the gap between different types of families, a summary indicator of household expenditure sustainability has been created. This takes into account both household expenditure and how families perceive the effort required to pay for these expenses. The indicator therefore has both an objective and a subjective dimension and varies from 0 to 100, where 100 is the most favourable situation, that is highest sustainability (Note 10).
In terms of overall sustainability, there are no significant differences between the situation in Veneto and the rest of Italy. The indicator's average score is 74.4 out of 100 for Veneto and 75 for Italy (Note 11). However, Veneto is one of the regions where housing sustainability seems most difficult. In fact only Liguria, Piemonte, Lombardia, Campania and Emilia Romagna are worse off. Household expenditure is probably higher because of the high prices on the housing market and an increased number of mortgages, but also because of different life expectancies, so families invest a higher proportion of their income in the home in an attempt to improve its quality. (Figure 8.3.8)
Household expenditure is more sustainable for families with children and especially for elderly couples. On the other hand people aged under 35 living alone and single-parent families have more difficulties, as do young couples without children and elderly people living alone, for whom the overall score is below 70 out of 100. The differences are mainly due to the objective component of the indicator, i.e. the proportion of income spent on the home, and whether the family has enough money left for other expenses and enough to maintain an acceptable standard of living. There is less variability in the subjective component, in the perception and evaluation expressed about the burden of expenses.
In general, compared to 2004, families are worse off, especially in situations that were already critical. The financial sustainability of young people living alone has dropped by almost 10 points, by around 6 points for the elderly and by 4 for families with children. Sustainability is worse especially for single parents and elderly people living alone.
At a national level the situation is similar, with the same differences between different types of families, though the levels may vary slightly. Unlike the situation in Veneto, however, over 5 years household expenditure sustainability has worsened in particular for young couples without children. (Table 8.3.2)
Table 8.3.1

Figure 8.3.1

Figure 8.3.2
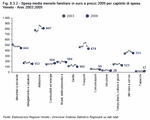
Figure 8.3.3
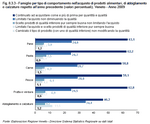
Figure 8.3.4
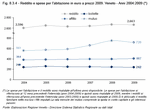
Figure 8.3.5
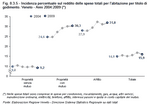
Figure 8.3.6
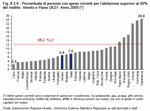
Figure 8.3.7
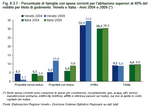
Figure 8.3.8
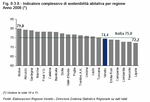
Table 8.3.2


