|
10 - Culture, leisure time and social participation
There are many features characterising a territory and the people who live in it, leisure activities, choice of holiday, culture and social participation are just a few examples.
Along with demographic, economic, environmental and infrastructural values, these factors help to define the character of a territory and the quality of life it offers its population. Therefore it is essential to try to understand a region's dynamism in certain sectors that are not strictly linked to the production of wealth. What cultural choices, for example, do people make, and what spectrum of events can they choose from? Which sports are most popular? How interested are people in socialising with others? To what extent are they prepared to dedicate a share of their free time to voluntary work? The answers to each of these questions add another piece to the jigsaw puzzle that, once finished, will provide an overview of the socio-cultural nature and the wellbeing of the population of a certain territory.
According to the European Union, household expenditure for cultural purposes is one of the key indicators in the evaluation of policies aimed at the long-term development of living conditions and welfare.
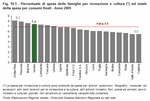
International comparison shows that expenditure for cultural purposes by Italian families is well below the EU15 average. It amounts to only 6.9% of total expenditure, while the European average is at 9.5%. In the European ranking Italy is in 21st place, lagging four percentage points behind the UK, Sweden, the Czech Republic, Austria and Finland. Compared to the rest of Italy, Veneto ranks fourth, with a share of 7.4% of total expenditure. The trend in expenditure for cultural purposes shows that both Italy and Veneto, after a relatively stable period, experienced a decline between 2004 and 2005 (for Veneto -2.5%), which partly absorbed the increase registered the year before. (Figure 10.1) Out of the prolific and multi-faceted cultural landscape that Italy has to offer, we will here consider a few of those cultural activities which are most popular with the people in Italy and in Veneto, and for which we possess data from 2007. Watching films at the cinema was, as might be expected, the most frequent cultural activity, involving approx. 50% of the population over 5 years of age. In second place are visits to museums and exhibitions. In Veneto this activity seems to be especially popular (34%) compared to the rest of Italy (27.9%), this is also thanks to the vast number of cultural events organised by the region's historical cities. It must be underlined, however, that the degree of utilisation of museums in general is still rather low in comparison with other European countries, even more so when we consider Italy's vast potential and the resources available. Next in the ranking of most popular cultural activities of the Veneto population are sport events, with a participation rate of 29.1% of the population over 6 years of age, theatre with 19.1% and concerts of classical music concerts (11.8)%. These data are in line with the national average. (Figure 10.2) In addition to the data shown here, which dealt with the participation in and the expenditure for cultural events, it is also important to give more detailed information about the vast offer of cultural events in the Veneto region. Each year flows of tourists come to the cities of Veneto in order to see exhibitions, festivals, theatre productions or other cultural events. However, the cultural events taking place throughout Veneto are mainly aimed at the resident population who can thus choose from a great number of different events in various artistic disciplines without having to travel very far. Cinema, once again, is the most frequent cultural attraction in Veneto with more than 100,000 events organised in 2006, making up 71.8% of total events. This figure, along with the number of spectators, was fairly similar to that registered in 2005. When it comes to theatre productions, concerts and sports events, however, the number of spectators has increased while the number of days with events taking place has decreased. Unlike the situation in Italy as a whole, supply and demand in Veneto museums and exhibitions is very dynamic: the number of events in 2006 has gone up by 35.5% compared to the previous year (against a decrease of 5.3% in Italy) and the number of spectators by +32.1% (against +5.4% in Italy). (Figure 10.3) and (Figure 10.4) The forms of entertainment mentioned here are not equally popular in all of Veneto's provinces: Verona stands out with a share of 23.1% of expenditure by the public on cultural events held within the region in the first semester of 2007. In the province of Venezia, on the other hand, the data reveal the largest increase of this type of expenditure between the first and second semesters of 2007, amounting to 35.1%. (Figure 10.5) Let us now look at some other personal habits that are linked to recreational and cultural activities: reading books and magazines, listening to the radio, watching television. On average 4.5 books are printed in Italy per inhabitant each year, but only 43.1% of Italians read at least one book in their spare time in 2007. Interest in book reading, which in general seems low compared to other European countries, varies significantly between different areas of the Italian peninsula: in the South the share of readers is around 30%, whereas in the North it is over 50%. Veneto reaches 49.3%. People who do not read books explained that this behaviour has more to do with the fact that they have no passion for reading and prefer doing other activities, rather than with a lack of time. Approximately one out of two Italian citizens do not read newspapers or magazines or read them only very occasionally. In 2007 only 58.1% of the population over 6 years of age reported reading a daily newspaper at least once a week. This share is further reduced to 40.7% of total readers when we consider only those people who read newspapers at least five times a week. In Veneto slightly higher figures were registered: 63.7% of the population read at least once a week, and of those 41.4% are very keen readers of daily newspapers. Listening to the radio is about as common as reading newspapers, while watching television is a habit shared by almost all citizens, as could have been expected. (Figure 10.6) Lastly, we must mention some figures on the use of the web. The internet is a communication tool used to foster relationships and exchange information which is gaining more and more importance as a channel for cultural activities. The data for 2006 show that Italy was in line with the European average when it comes to the percentage of internet users who used it for reading or downloading books, newspapers and/or magazines: 35% of Italians between the age of 16 and 74 have surfed the internet in the past three months. All in all, 13% of the total Italian population and 18% of European citizens read online texts. Throughout the Italian regions the use of the internet for cultural purposes seems largely uniform.
The propensity to go on holiday is a key indicator of the quality of life that the residents of a certain area enjoy. In Italy this phenomenon started with the economic boom in the 1960s and gained considerable social relevance in the 1980s. This period saw drastic changes in people's holiday habits. Going on holiday at least once a year became an important factor in the lifestyle of Italians: In 1985 46% of the Italian population already followed this trend and in Veneto the share was even higher at 50.7%. In the following years the growth in tourism slowed its pace down a little (Note 1). (Figure 10.7)
In 2006 Veneto ranked 6th amongst Italian regions for the share of residents who went on holiday for at least 4 nights. The situation in Veneto is very similar to the other Northern regions at approximately 60 holiday-goers per 100 residents. This value is almost 10% above the national average. The other 40% of the Veneto population do not travel mainly out of financial reasons, or for family reasons. The other reasons are the following, in order of importance: travelling is not a habit, work or study reasons, health-related reasons, age, already resident in a holiday resort. For the current year there are no reliable figures yet, but for 2007 it will be important to analyse the extent to which the tourism sector was influenced by the price increase that, since September, has hit the services of the entire industry with an increase of +5% on the same period in the previous year (Note 2). (Figure 10.8) In general, the Veneto population prefers travelling within Italy, this amounted to 77.4% of holidays in 2006. For holidays of at least 4 nights the share is 68.2%, while the percentage rises even higher for short trips (87.3%). Veneto tourists discovering Italy
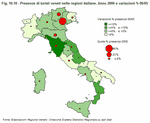
When Veneto tourists go travelling in Italy they tend to stay longer than Italians from other regions: their average stay lasts for 5 days while the national average is around 4 days. This figure is due to the choice of accommodation: partly hotel establishments - where the average stay of 3.5 nights compares to a national average of 3.3 nights - but mainly non-hotel establishments which are extremely popular and usually lead to longer holidays. The average number of nights that tourists from Veneto spend in establishments other than hotels, such as campsites, rented apartments, agrotourism establishments, etc., is, with an average stay of 8.7 days, much higher than that of hotel stays. The Italian average is 7.5 days. If we look in more detail at the trends in tourism establishments chosen, we can see that 3-star hotels attract the greatest share of Veneto as well as Italian tourists in general, while the Veneto population is also very much inclined to use rented apartments (almost 22%), as they permit families to continue with their usual domestic routines. (Figure 10.9) Of the holiday destinations in Italy, 45.3% of tourists from Veneto prefer their own region, followed by Trentino Alto Adige (13.6%), Emilia Romagna (8.8%), Toscana, Friuli Venezia Giulia, Lombardia, Lazio, Marche, etc. (Figure 10.10) When Veneto residents stay in Veneto for their holidays, they mainly focus on seaside or mountain destinations and spend less time in the beautiful historical cities than other tourists. This does not signify a lack of appreciation for the special atmosphere and the unique experience of visiting the famous historical cities of Veneto, but it is obvious that Veneto residents can reach these places very easily on a day trip and thus do not need to stay there overnight. (Figure 10.11) Veneto holidaymakers are also more likely to choose non-hotel establishments for holidays within their own region than other Italians. In 2007 51.5% of tourists from Veneto stayed in non-hotel establishments, which corresponds to 75.6% of total nights spent. On top of the list for non-hotel establishments are rented rooms and campsites. Veneto tourists abroad
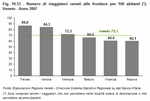
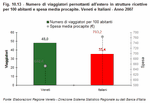
One way of measuring the numbers travelling abroad is through a survey providing estimates of traveller flows at national borders (Note 3). In 2007 approximately 70 Veneto residents out of 100 crossed the border for personal or work-related reasons, which is much lower than the average Italian value. This is due to the fact that many people who live in border regions, such as Lombardia or Friuli-Venezia-Giulia, travel abroad every day. (Figure 10.12)However, if we consider only travellers who spend at least one night abroad, thus excluding 50% of travellers on a national level and 20% for Veneto in 2007, and exclude also those who stay abroad with friends or family (Note 4), the situation changes drastically. It becomes clear that the people of Veneto are more likely to travel abroad than Italians on average, registering roughly 48 international travellers per 100 inhabitants, as compared to a national average of 35.4. When it comes to financial aspects, i.e. the money spent while staying abroad, Veneto is among the regions spending least. A traveller from Veneto spends approx. €653, while the average Italian spends €763. This value is inseparably linked to the length of stay, which amounts to 8.2 days for travellers from Veneto and 9.3 days for Italy in general. It is possible that the short geographical distance between Veneto and some national borders is one reason why the residents of the Veneto region stay abroad for shorter periods. Daily expenditure, however, is similar for Veneto residents and the average Italian and amounts to approximately €80. In the last five years the average length of stays abroad has decreased for both Veneto residents and Italians in general, and the gap between the two is getting narrower. (Figure 10.13), (Figure 10.14) and (Figure 10.15) Finally we would like to analyse the nights spent by tourists during the last four years in the above-mentioned destinations of Veneto, Italy and other countries, by origin of tourists. It turns out that the desire to travel is growing more quickly in Veneto than in the rest of Italy. This is true for stays within the region, for the rest of Italy as well as for journeys abroad. The number of nights spent in 2007 by tourists from Veneto were 22.4% up on 2004, compared with a 7.5% increase for Italian tourists on average. (Figure 10.16)
A third parameter with which to measure the well-being of a territory is the number of people who look after their body and do at least one sport or do some type of physical exercise.
Sport and exercise
Nowadays sports have become an important occasion for young and not-so-young people to get together. The world of sports reflects modern society and has changed enormously over the last few decades, as has society itself. Almost half a century has passed since 1960, the year when the Olympic games took place in Rome and when the collection of statistical data on sports started. In this period of time sports, which used to be a privilege for a lucky few, have become a mass phenomenon. In 1959 2.6% of the population did sports, with the most popular sports being hunting and shooting (36.3% of total), followed by football (24.2% of total).During the decades that followed, financial, social and cultural conditions changed rapidly. This is due to the fact that that initial period was very close to the end of the Second World War and therefore marked a difficult time for the majority of the population. With increasing financial resources people started to be more aware of their state of health and began to look for more entertainment. However, it would be too limited a view if we traced the sports boom of the last decades back solely to financial factors, as there were other, more profound reasons, which have always rested in every one of us, namely the instinctive desire of human beings to excel and to stand out. Sports give us the opportunity to give vent to these impulses. Already in the first half of the 20th century the population was enthusiastic for grand sports events. One example worth remembering was the victory of Gino Bartali at the 1948 Tour de France, which helped calm tensions after the attack on the politician Palmiro Togliatti, which had brought Italy to the brink of civil war. Also thanks to means of communication, which gradually improved and gave sports happenings more importance and visibility, until they became part of our day-to-day life, people felt more and more desire to participate in sports events, as far as their physical capacities allowed. We can therefore say that it was a combination of factors that contributed to the growth of sports, until they reached today's standards. One motivation was the desire to imitate professional athletes, often presented as role models, whose great achievements were now brought to the attention of everybody by the new possibilities of the media. On the other hand every human being tends to seek challenge, with him or herself as well as with others. Another factor is the quest for wellbeing in a society where health and beauty ideals form an integral part of the population's day-to-day lives. The combination of these factors has attracted many more people to sports and has resulted in a much wider spectrum of activities than were available in the past. Forty years ago only a small share of the population did sports and those who did were usually professional athletes. Today there are countless possibilities for doing sport, not only in competitive contexts but also for pure physical exercise, which is often done individually with the aim of improving one's physical and mental wellbeing. The tangible result of this development can be expressed in figures: in 2006 the percentage of people doing sports regularly was 20.1%, while at the end of the 1950s the share was a meagre 2.6%. Looking at more recent data, from the beginning of the 1990s on we can also reconstruct the percentage of the population doing sports either regularly or occasionally, as well as the large group of people doing non-competitive physical exercise. The result of the analysis for Italy in the last few years is not entirely homogeneous. On the one hand the percentage of people who do sport regularly or occasionally has increased (up from 26.6% in 1995 to 30.2% in 2006) but on the other hand there are fewer people who do other physical exercise (from 35.3% to 28.4%) and, most importantly, more people who declare not to do any kind of physical exercise at all (from 37.8% to 41%). This could mean that, in general, there is less desire to do physical exercise as a pastime or for entertainment, and that the people who actually do physical activity specialise in a particular sports discipline, especially the younger people. (Figure 10.17) Looking at different geographical areas in Italy the situation becomes quite heterogeneous. Over the years, the considerable divide between the North and the South has persisted. The number of people doing sports (regularly or occasionally) in 2006 varies between 23.3% in the South and 36.5% in the North-East of Italy. In Veneto the share is at 35.5%, i.e. slightly below the average for the North-East, but above the national average. (Figure 10.18) However, the recent changes which brought about the situation we see today have been rather similar for the North as well as the South. Starting out from 1995 as a base year, we can see a gradual improvement in the sports activity index for both Northern and Southern Italy. The Italian islands performed best with an increase of 6% points, followed by the South and the North-East with a rise of around 4%. The most recent figures for Veneto and Italy stem from 2007, however we do not possess data about physical exercise and geographical distribution of physical activity for this period. Nation-wide, sports activities remain at the same level as in 2006, while in Veneto there was an increase of 2.4 percentage points, with a share now approaching the 38% mark. Those people who do not do a specific sport but who do other physical exercise of some sort in their leisure time (such as jogging in the park, cycling trips, etc.) make up another category. This group does not pursue a particular goal or purpose but is looking for relaxation and physical and mental wellbeing. The situation for this category in the different geographical areas is similar to what we have already seen for sports activities. Again in the North, and especially so in Veneto where the share reached a high of 34.6%, this type of activity is much more common than in the rest of Italy. The bad news, however, is that a considerable downward trend has taken place everywhere since 1995. In 1995 48.7% of inhabitants of Southern Italy said that they did not do any sports at all, while the percentage in the North-East was at 27.3%, which means a difference of 21.4 percentage points. In 2006 there was a general shift towards physical inactivity and the differences between the two areas became even more marked. The South almost reached the 54% mark for physically inactive persons, while the North-East's share came to a halt at 29.6%, which makes the gap between the two even larger at more than 24%. These differences prove that social and economic conditions have an influence on people's lifestyles and therefore also on their propensity to sports. The situation in Veneto is in line with the North-East, with 29.7% of the population declaring not to do any physical activity. This figure is clearly not a positive one, but compared to Italy in general, it highlights that the Veneto population is among the least inactive and has a greater inclination to do some sort of physical activity. (Figure 10.19) But what is the reason for this increase in inactive people? There are certainly a multitude of factors to blame, such as the ageing of the population and the change in people's habits. The elderly population obviously does less physical activity and thus lowers the level of sports activities. Moreover, sports are particularly popular with children and young people up to the age of 14; already from the age of 15 onwards, coinciding with the final stage of adolescence, people's life styles change and priority is often given to activities other than sports. Taking a closer look at the habits of people doing sports at different stages of their lives, the data for Italy show clearly that most of the activity is done at a very early stage in life (between the ages of 6 and 10), both inside and outside of school. The two age groups with the most regular sports activities are from 6-10 and from 11-14 years of age (53.4% and 54.2% respectively). For young people physical activity means having fun, and at the same time it is a stimulus for competing with other people of their age, a way of putting their physical strength to the test and an opportunity for developing their individual identity. Already at the age of 15 sport activities become more periodical, although the share is still 62%. Indeed, the percentage of people doing sports on a regular basis decreases from 54.2% in the 11-14 age group to 48.1% at the age of 15, whereas the number of people doing sports on an occasional basis rises by 3 percentage points (from 10.8% to 13.8%). (Figure 10.20) When it comes to basic physical activity the picture changes considerably. The youngest age groups, as we have seen above, mostly specialise in specific sports, but already at the age of 17 basic physical activity is carried out by 18.9% of the population, a value which then rises continually until it reaches 38.2% for the age group of 60 to 64-year-olds. So, in general, with increasing age athletic sports decrease to make way for simple physical activity with the purpose of finding wellbeing and relaxation from the stress of day-to-day life. Finally, it must be pointed out once again that in general physical inactivity is on the rise. The figure for Italy shows that already at the age of 18 the number of physically inactive people reaches a percentage of 23.5% of the population, this figure rises continually from then on until it exceeds 75% for the age group of over 75-year-olds. The gender gap in this subject is still present, but it has narrowed as women have started to do more sports than in the past. Between 1995 and 2006 the number of women doing sports in Italy rose from 18.6% to 23.9%, which means an increase of over 5 percentage points, whereas the increase registered for men was only 1.9 percentage points (from 35% to 36.9%). In terms of physically inactive people, the number has increased for both men and women. This figure for men has gone up by a greater extent, growing from 30.9% in 1995 to 36.2 in 2006, while the share of inactive women increased by 1.3 percentage points only (from 44.2 to 45.5%). However, differences in sports habits between men and women still exist, just consider that the peak for men's sports activity happens in the age group of 11-14 with 73.3% of boys doing sports, whereas the girls reach their maximum level of activity in the age group of 6-10 years with a share of only 57.1%. Veneto schools give much importance to the introduction of children and young people to sports, as they consider it a crucial element of individual growth. In this context one of many initiatives launched was a project called "pił sport @ scuola" (more sport @ school), which started in 2004 within schools, with the aim of increasing PE lessons and bringing the children closer to sports clubs. Children should be guided systematically towards sports and its positive values by helping to make sports part of their life style and making sure that they maintain it throughout their adult lives. The figures on young people's sports-related behaviour show that in 2005 an average of 67.4% of lower and upper secondary school students did sport, with a peak of 77.5% at the age of 14 years. After 14 the share goes down to 61.7% between 15 and 18 years and down further to 49.3% after the age of 19. Girls contribute greatly to this trend, as many of them tend to abandon sports altogether. At the age of 14 almost 75% of them do sport, but at the age of 19 this percentage drops to 30%, while the decrease for boys is of only 15.7% with 64.6% of them keeping up the habit of doing sport. From these data we can see that the gender gap with relation to sports becomes more pronounced with adolescence, a period when young people begin to form their individual personalities as future adults. The supply of sports infrastructure in Veneto
(Note 5) There's no doubt that the Veneto region provides a good standard of sports infrastructure (Note 6), both in terms of quality and quantity. Compared to the average national supply, the number of sports facilities in Veneto is clearly superior, and, more importantly, the different types of facilities are distributed in a sufficiently even manner, as the tables illustrate.The region provides a large number of football pitches, which is only logical, considering the popularity of this sport in Italy, but indoor, multiuse facilities, such as gyms for example, also exist in a sufficient number so as to satisfy the demand for every type of sports activity. At this point it is also worth mentioning that the Veneto region is very unusual from a geographical point of view, as it stretches from the seaside to the mountains, from lakes to hills and plains, enabling the region to offer every possible type of sports facility. This is also the reason why Veneto hosts facilities for less common sport disciplines. All in all the sports infrastructure in the region is so varied as to satisfy every demand. One example is the town of Cortina, which, until one year ago, was the only Italian resort with a bobsleigh course. When it comes to the overall state of the facilities we must differentiate between the types of ownership. The majority of facilities are run by the public administration, usually by local authorities, who are regularly faced with severe budget cuts and therefore struggle greatly to raise the necessary funds to modify the facilities according to the requirements of new state legislation in order to make them safer and increase their usability. In the private sector, however, where the good condition of the facility plays a major role in terms of profitability, owners are usually more interested in maintaining their property well and in complying with safety regulations, for which they are accountable in person. The first piece of data which stands out is the increase in the number of sports facilities registered in the period between 1989 and 2003, which, although not completely up-to-date, is still relevant in order to describe this phenomenon because the development is rather linear. Thus the data, which show a 13% increase in 15 years, can also give a realistic idea of the current situation. The number of sports facilities in the region went up from 4,831 units in 1989 to 5,463 in 2003. The province with the greatest increase in the number of facilities is Padova, with 1041 units in 2003 compared to 829 back in 1989, which corresponds to a 26% increase. The smallest increase took place in the province of Belluno: there the number of sports facilities crept from 394 to 426, up only 7,8%. (Table 10.1) Throughout Veneto there are 12,152 spaces available for sports activities. The bulk of the supply is dedicated to football, with 2,366 spaces, i.e. 19% of the total number. Indoor (2,242) and outdoor (1,696) gyms, i.e. multi-sport spaces which provide for various disciplines, are also very numerous. Five-a-side football is an ever more popular sport played all over the Veneto region on 444 pitches. (Table 10.2) Another important characteristic of the facilities, which is revealed by the collected data, is the question of whether the facilities are certified by the Federations or not. Only certified facilities may host "official" sporting events that are acknowledged by the Federation. In Veneto 48% (5,837) of all facilities fulfil this requirement and are thus allowed to host official sports competitions. Accordingly, there are a considerable number of facilities (6,315) that cannot become venues for Federation competitions. Among these there are many which could become fully certified and fit for official competitions by carrying out only a few minor modifications. (Table 10.3) Sports Federations, clubs and members in Veneto
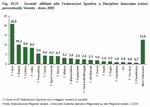
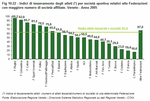
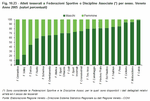
(Note 7) Veneto counts a total of 5,500 sports clubs which are affiliated to National Federations or to the Associated Disciplines of the Italian National Olympic Committee. This considerable number of clubs enables approx. 345,000 club members to do sports, either on a professional or non-professional level. Football is the discipline represented by most clubs (20.9%), followed by basketball (10.2%), cycling (8.8%) and volleyball (8.4%). (Figure 10.21)Also the ratio between the number of athletes and clubs within a certain area is of significance, i.e. the membership index (Note 8). The regional average for athletes per sports club amounts to 62.4. The Federation with the highest membership index is rugby (96.2), followed by gymnastics (92) and football (85.7). (Figure 10.22) If we analyse the club members by gender, it turns out that football has still remained a predominantly male sport (97.8% of athletes are men, while there are only 2.2% women). Next in the list are motorcycling (with 93.7% men and 6.3% women), cycling (93.1% men and 6.9% women) and weight-lifting (84.3% men and 15.7% women). Gymnastics, on the other hand, is a sport which is dominated by female athletes (88.2% women and 11.8% men). Gymnastics is followed by volleyball (77.6% women and 22.4% men). The gender divide for dancing, however, has narrowed (56% women and 44% men). (Figure 10.23) Sports clubs are distributed rather evenly throughout the provinces of Treviso (19%), Vicenza and Padova (both 18%), Verona (17%) and Venezia (16%). Belluno and Rovigo register considerably smaller percentages (7% and 6% respectively). This situation is also reflected in the distribution of athletes per province: Padova and Verona (19%), Treviso and Vicenza (18%) Venezia (16%). Also in this category Belluno and Rovigo show much lower percentages (6% and 4% respectively). (Figure 10.24) We can measure the relation between supply and demand for every type of sport by using the intensity index (Note 9). It must be pointed out however that comparisons of this indicator cannot be made between different sports due to the structural differences between disciplines. By means of this index the differences between the areas of the region and their respective individual traits can be highlighted. Let us start by considering classical sport disciplines such as football or five-a-side football, with a regional average of 35.4 members per sports space and a provincial fluctuation of this value between a minimum of 29 in Belluno and a maximum of 40.3 in Venice. Winter sports, in comparison, as characterised by the fact that they require mountainous areas (especially skiing, which is also the most common winter sport) show a regional average of 63.9 members per sports space, a value that is generated by a highly heterogeneous situation. There are, in fact, provinces, such as Venezia and Rovigo, which do not contribute to this value at all because, first of all, their geographical location near the seaside favours water sports such as canoeing, and because the long distance between these places and the nearest skiing resort makes the pursuit of this sport rather impracticable. Belluno is home to the most renowned mountain resorts of the region and is thus more inclined to cater for winter sports, which naturally leads to a large supply of facilities meeting the demand in this area, thus lowering the value to 29.5 members per sports space. Treviso and Padova present the highest values of the entire region (1938.5 and 1176 club members for winter sports per sports space respectively), which can be explained by the fact that the two provinces do not provide infrastructures for winter sports but are not too far away from hilly/mountainous areas, which increases people's motivation to do winter sports, even if they cannot do so in their own province. (Table 10.4)
In addition to holidays, sports and culture we must also consider aspects that are linked to people's ability and desire to socialise, which can mean spending time with other people and cherishing friendships or even sacrificing some of their free time for the less fortunate, i.e. doing voluntary work.
What does friendship mean for us today? Family duties, work and a lot of time spent commuting often leave little room for personal relationships. Moreover, the makeup of contemporary society frequently forces us to adapt our social behaviour according to different situations. Friendships, for example, often develop at the place of residence or at the workplace, and changes can often lead to abandoning even old friends. Despite all this, the value of friendship is still held in great esteem because it plays a crucial part in our lives. In Veneto in 2007 the share of the population who claimed to see their friends very often was 25.3%, which is below the share for the overall North of Italy, but above the national average. A share of 56.9% said they met up fairly often, while 12.5% saw their friends only a little. Only 3.1% of the population never meet up with any friends. (Figure 10.25) Solidarity, social participation and mutual assistance are phenomena that can be traced back to the "third sector", which is deeply rooted in the social fabric of Veneto. We are referring to voluntary associations, social cooperatives and other organised groups which actively work side by side with the State or instead of the State, generating goods and services for the benefit of the public. In Veneto in particular this concept has developed over many centuries: first of all the high-medieval brotherhoods were founded, then came Renaissance corporations and finally the leagues and cooperatives in the Veneto countryside followed at the beginning of the 20th century. This shows that the Veneto region can look back on a long tradition of spirit of solidarity and mutual assistance. Still today this characteristic of Veneto is very strongly developed and expresses itself in a number of organisations, which play an ever more important role in community life, not only for the purpose of assisting people in the search for new opportunities and life styles but also as a reference point for people to reach out to. Some of these organisations will be described in the following paragraphs. Voluntary organisations
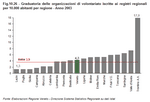
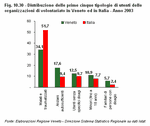
The most recent regional census for counting the types and quantity of voluntary organisations present in the regional register was carried out in 2003.From this census it turned out that there had been a considerable nationwide increase of such organisations by 150% in 8 years. In Veneto the number of registered organisations is 2,018, which amounts to almost 10% of the national total. (Figure 10.26) The average distribution of such organisations throughout the Italian regions is 3.6 organisations for every 10,000 inhabitants (1.5 in 1999), with a peak of 17.9 in Trentino-Alto Adige. With a figure of 4.3 organisations for every 10,000 inhabitants Veneto is positioned in the middle of the ranking. In terms of provincial distribution Verona and Padova historically take the lead on a regional level. (Figure 10.27) Usually voluntary organisations are of small to medium size: this is shown by the fact that 60% of organisations in Italy and in Veneto register revenues and expenditures of below 25,000 euros/year and by the number of active voluntary workers, which, for more than half of the organisations, is less than 20. In 2003 in Veneto there was a "team" of 62,000 voluntary service workers, roughly 7.5% of the Italian total. The typical voluntary worker in Veneto would be male, between 30 and 54 years old and mostly a lower or upper secondary school graduate with a job. Most volunteers contribute on a regular basis, and more than half are active in the fields of health care and social assistance. In terms of social assistance Veneto is especially active, with a value that exceeds the national average. (Figure 10.28) If we take a closer look at the activities carried out by the volunteers, we can see that, according to the organisations that replied to the survey, more than half involve listening to people, offering moral assistance and support, donating blood and helping in the context of leisure time activities. This confirms the role of the volunteers as the "glue" that keeps society together and as personalities who protect weaker members of society who are likely to experience times of loneliness and illness. (Figure 10.29) Proof is also given by an analysis of the type of people benefiting from volunteer services. Even if the picture is not entirely homogeneous between Veneto and the rest of Italy, it is clear that the main group are elderly people and people suffering from illnesses or traumas, that is to say people who are going through a period in life that is characterised by marginalisation and possible social isolation. (Figure 10.30) The Veneto population's commitment to solidarity is considerable and the tendency is rising. According to a recent sample survey by ISTAT, referring back to 2007, the phenomenon of social participation in the form of voluntary social service with registered organisations is especially elevated in Veneto. In the national ranking Veneto is only second to Trentino-Alto Adige for the number of people actively volunteering, with a share of 14% of the population of over 14 years old. (Figure 10.31) Social co-operatives
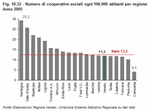
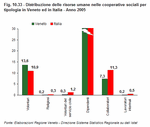
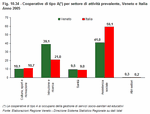
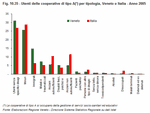
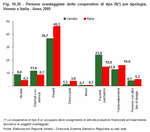
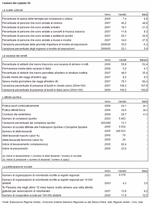
Social co-operatives are organisations which pursue general community interests in an institutionalised manner by promoting social inclusion and human development. They are subdivided into two categories.Type A social co-operatives offer home assistance to elderly and ill people, as well as psychiatric patients; they run community residences and day centres for young people and people with special needs; they look after children and offer study support and leisure time activities for young people at risk of social exclusion. Type B social cooperatives may run various kinds of enterprise - agricultural, industrial, crafts, commercial and service businesses, under the condition that part of the jobs created (at least 30%) be allocated to disadvantaged people who would otherwise be excluded from the labour market. This favours people with physical, psychological or sensorial invalidity, psychiatric patients, drug or alcohol addicts, minors at working age with difficulties within their families and criminal offenders who are allowed to work while they serve time. Both types are of crucial importance to the region, as they contribute to integration, promotion of individuals, the solving of emerging problems and the strengthening of the social fabric. Moreover they can take in volunteer workers and young people doing civilian service, which provides the population with another opportunity for investing their spare time for the common good. Social cooperatives are regularly counted on a national level: The most recent census from 2005 registered more than 7,000 cooperatives, 33% more than in 2001. Lombardia is the region with the most cooperatives, accounting for 16.2% of the national total, while the Veneto share is just under 8%, along with Sicilia, Emilia-Romagna and Puglia. (Figure 10.32) Analysing the details in terms of territorial distribution, Sardegna turns out to be first in the ranking for the average density per 100,000 inhabitants, followed by Valle d'Aosta, which is the only Northern region in the top four. Veneto is positioned close to the national average with a value of 12.5. In 2005 564 social cooperatives were counted in Veneto, signifying a 22% increase on 2001. Type A cooperatives saw a bigger growth with 23.8% than type B cooperatives which increased by 19%. Throughout Italy type A cooperatives, i.e. those which offer social, health and educational services, are more frequent. In the Veneto region, which is in line with the national average, almost 60% of all cooperatives belong to this category, while 33% belong to category B. The remaining cooperatives are usually consortiums and mixed cooperatives. The number of people involved in this sector is almost 280,000 in Italy, with a contribution of 8.4% from Veneto. The bulk of these people are employees, volunteers or collaborators whose employment conditions vary in some regards according to the type of cooperative. (Figure 10.33) Compared to the national average, the cooperatives in Veneto make more use of voluntary work (13.6% of the total) and employees (78.3%) than the rest of Italy and do not depend very much on the contribution of external collaborators (only 7.3%). Comparing the two types of cooperatives it can be seen that the services of type A cooperatives are often carried out by volunteers, which is probably due to the nature of the services offered, while type B cooperatives work mainly with employed persons. Let us take a look at the array of services offered by social cooperatives: The services offered change according to the type of cooperative. At a national level the vast majority of type A cooperatives are active in the field of social assistance (almost 60%). (Figure 10.34) The situation in Veneto is similar, only with a stronger differentiation. Almost the same percentage of cooperatives, 41% and 39.1% respectively, are concerned with social assistance and with research and education matters. The details for Veneto show that the list of the main three services offered is led by assistance in protected residences, followed by educational services for disabled people and recreational and entertainment services in second and third place. The Italian citizens who have made use of these services amounted to 3 million in 2005, more than double the number 4 years before. In Veneto, where the numbers have remained largely stable over the years, 160 million beneficiaries were counted. Thanks to the multitude of services offered, the beneficiaries are very varied too, but the majority of them are young people and beneficiaries without particular difficulties. (Figure 10.35) As mentioned above, type B cooperatives are aimed at creating job opportunities for disadvantaged people, i.e. offering occupation to those people who are at risk of being excluded from the labour market. The people concerned are addicts, detainees or ex-detainees, psychiatric patients, physically disadvantaged people, minors or other socially marginalised groups. Within the Veneto region in 2005 the cooperatives created jobs for more than 3,000 people, almost two thirds of whom were employed with regular contracts. In contrast to the national situation, the categories of beneficiaries seeking this kind of service are clearly people with problems concerning social marginalisation (alcohol addicts, criminal offenders, psychiatric patients) rather than people with health problems (physical disabilities). (Figure 10.36) As far as the sectors in which the cooperatives work are concerned, 28% of them belong to agriculture, 43% to industry and crafts, whereas the largest chunk (54%) operates in the field of trade and services. On average each cooperative in Veneto supports 17 disadvantaged people, compared with 12 people nationwide. One last interesting fact concerns the mixed cooperatives, i.e. those offering services inherent to type A and B cooperatives, or consortiums, i.e. organisations whose corporate structure is characterised by a minimum of 70% of social cooperatives and whose task it is to offer services and management to the support of the affiliated cooperatives. Cooperatives of this type make up less than 7% of the total of social cooperatives in Veneto.
|
|
Data elaborated by the Statistics office of the Veneto region are collective property; reproduction of this material is authorised for non-commercial purposes only, provided the source "Regione Veneto - Regional Statistics System Management" is acknowledged.


 Index
Index  Home
Home 