|
8.2 - Consumption, income distribution and wealth
Financial resources belong to the primary material needs for families and individuals, and they are inevitably taken into account when analysing people's quality of life. There are usually two approaches to an objective evaluation of a family's financial situation: consumption expenditure and income. These indicators are both important and, when considered together, they allow the same phenomenon to be observed from different viewpoints. Income is an ex-ante indicator of disposable resources, excluding consumer decisions which are often affected by personal lifestyle. Consumption, on the other hand, makes it possible to look at the effective behaviour of families and individuals, which is usually, but not always, linked to disposable income. Consumption is a more stable indicator in time since it reflects middle and long-term income prospects.
By looking at consumption expenditure and family income together it is possible to look at family well-being and poverty in Veneto, and set an objective level of poverty which can serve to identify families and individuals that live below a certain standard. Together with objective indicators of poverty go perceptions of financial situation. Disposable income and subjective perceptions are not always parallel: they tend to coincide at extreme levels of poverty or wealth, but in the grey, intermediate area families with limited available income don't necessary perceive this, and vice versa, families with sufficient resources may consider these to be insufficient. This is why when talking about poverty both aspects have to be taken into account. This is not only because it is interesting to know how people see themselves, but also, and most importantly, because family choices and behaviours depend on subjective perception of one's financial situation. Using estimates by the Bank of Italy it is possible to study the wealth of the Veneto population according to real and financial assets which, together with information on income and financial deprivation allow for a complete profile of families' wealth.
Household consumption is a valuable instrument not only in understanding the most popular type of goods, and thus indicating the buying habits of the main family types, but also for providing an idea of the population's wealth.
According to Istat's survey of buying habits, in 2006 average monthly expenditure for families was 2,998 euros, roughly 252 euros more than the previous year (+9.2%), and has been increasing since 2003. This expenditure is higher than the national level, which is 2,461 euros. Since these figures are not deflated, the increase recorded in recent years is due not only to an effective increase in the consumption of goods in nominal terms, but also to increases in inflation (in 2006 the consumer price index was on average 2.1%), and the increase in the value of imputed rent, that is amount calculated for owner occupied housing, imputed by the rents payable on the market for equivalent accommodation (Note 1). In the three years 2001-2003, the price increase for food was considerably above the average inflation rate, then it slowed down in 2004 and remained relatively stable in 2005 and 2006. Average monthly spending for Venetian households on food and drink in 2006 was 444 euros, quite stable compared to the previous years. Household expenditure reflects propensity for consumption and actual disposable income. A high proportion of consumption on goods that meet primary needs, such as food, as opposed to other goods nearly always indicates limited resources or a drop in the standard of living. In light of the dynamics of price increases one supposes that the increase in the weight of primary goods on total expenditure has occurred to guarantee primary goods to the detriment of extras, such as holidays, free time and clothing. This becomes clear if we look at spending behaviour for households whose budgets are more limited, such as those of pensioners, or where the head of family is a factory worker: In these cases a larger share of expenditure goes on basic requirements such as food and accommodation. Expenditure on food in Veneto, close to the national average, makes up 14.9% of household average monthly spending. It is mainly in regions of southern Italy, in particular Abruzzo, Puglia and Campania, where expenditure is above the national average. (Figure 8.2.1) Compared to 2003, three years later the share of expenditure on food decreased by over two percentage points, while expenditure on housing (Note 2) - still below the national average - and on transport (Note 3), above national average, increased by one percentage point. The recent increase in fuel prices and energy (gas, electricity, petrol) is reflected in expenditure on housing and on transport which have persistently recorded an increase in the last three years. Housing expenses are felt to be a problem for many households, and have increased in the last ten years. Over a quarter of total expenditure goes on this, making it the highest category of expenditure. (Table 8.2.1) The number of home-owning families in Veneto (72.2%) has increased and is higher than the figure for Italy. 17.6% of these families have a mortgage to pay. 6 out of 100 families who pay rent have trouble keeping up and say they are behind with payments: This situation is better than the national average which is 13.6%, but if we look at the situation for mortgages we can see that compared to the national level, Veneto families have some difficulty keeping up payments (5.2% in Veneto against 4.5% in Italy). According to the most recent data for 2006, monthly rent paid by families in the north is around 372 euros; monthly mortgage payments around 473 euros. Both of these have risen constantly since 2004 and have remained above the national average. In the south, however, rents and mortgage payments are lower. Lifestyle and consumer behaviour strongly affect expenditure on various categories of consumption, as well as effective need. There is no doubt that there has been a constant change in the types of goods acquired in recent years, mirror of a society that is changing in terms of values and needs. While there has been much talk about difficulties for household expenditure, there is no doubt that economic well-being in Veneto is at a medium-high level. There has been an increase in expenditure on new electronic goods, cars and technological goods, above all mobile phones, personal computers and their accessories. Expenditure on sport and fitness, above all sport, gyms and beauty salons is increasing for Italian families. The search for a simple and healthy lifestyle is becoming more widespread, with people also looking to traditional products: acquisition of organic foods, herbalist products and quality enogastronomic goods such as selected wines, meat and salami has increased. To be more precise, spending needs vary considerably depending on the type of household: for instance the elderly have different consumption and spending patterns to young families with children. Expenditure also depends to a great deal on household size, since a different number of components determines budget allocation. On a national level, average spending increases less than proportionally with respect to the number of components for many categories of consumption. This is down to the effect of economies of scale which can increase family wellbeing despite equal income or consumption. Furthermore, larger households, which are found mainly in southern Italy where consumption expenditure is lower, have higher poverty rates compared with smaller households. For certain categories of expenditure, such as for housing or fuels, expenditure actually decreases with the increase in the size of the household nucleus: larger families, which tend to be poorer, try to contain expenditure for goods with fixed costs, and hence show lower levels of expenditure. As regards types of household, in north-eastern regions, the elderly, both single and couples, have lower values for expenditure than other types of household as regards clothing and footwear, communications, free time and culture, though this is usually above the national average. Indeed the elderly tend to lead a more restrained lifestyle as regards clothing and leisure activities, and hence tend to concentrate spending on more basic requirements. On the other hand, spending on health is higher for the families of elderly people, even compared to couples with three or more children, since health problems increase and become more serious as age advances. In line with the national trend, compared to single older people, young singles in regions of the north-east spend more on transport, since they tend to move more regularly and have at least one car, on communications (telephones and mobiles), clothing and footwear and free time. The same goes if we compare young childless couples and elderly couples. The presence of children in families means more spending on clothing and footwear and a greater need to travel and higher expenditure on education and free time. For couples with children and one-parent families, clearly expenses increase as the size of the family nucleus grows. Besides food, transport and housing costs are the greatest expenses. (Figure 8.2.2) and (Table 8.2.2)
(Note 4) Household wealth (Note 5) is made up of both material and non-material goods that can be sold on the market. The value of wealth can be determined at a certain point in time and can be expressed in monetary terms. Income, through savings, increases wealth; consumption, if greater than income, reduces it. Increases and decreases in wealth can also stem from corresponding variations in prices of goods. Real estate and stock markets are particularly influential in determining household wealth. Wealth is made up of a reserve of accumulated value in view of future consumption.
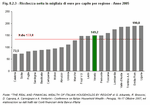
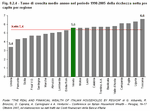
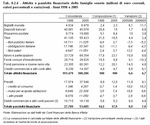
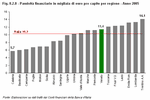
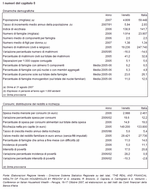
Wealth is made up of financial assets (for example currency, shares, state bonds etc), non-financial assets (real estate, land, durables such as machinery for producing families but also non-material goods such as patents and setting up enterprises, etc.) and of negative values, i.e. liabilities (bank debts such as mortgages, consumer credit, etc.) The sum of financial and non-financial assets less the value of liabilities constitutes net worth (i.e. wealth). On the basis of a regional reconstruction of household wealth at market prices (Note 6), in 2005 net worth per capita (Note 7) for Veneto households was about 149,200 euros: which is above the national average. (Figure 8.2.3) In 2003, the last year for which regional data on household disposable income is available, net worth was 8.5 times the regional disposable income, a ratio which is above the average for regions in the North (8.0) and the national average (7.9). According to the household survey carried out by the Bank of Italy, in 2006 distribution of regional wealth was not far from the national one: in Veneto slightly less than half net worth was in the hands of 10% of the richest families (Note 8), as in the rest of the country. (Table 8.2.3) Although the level of wealth per capita of Veneto households in 2005 was still lower than the average for regions in the North, between 1998 and 2005 in Veneto wealth increased faster than the average registered in the North. Until 2000 accumulation was fostered, in equal parts, by the increase in prices of assets and savings, subsequently the increase in prices prevailed. (Figure 8.2.4) Compared to the other North-Italian regions Veneto is characterised by a greater share of wealth from real assets (Note 9). In 1998 63.8% of Veneto household wealth was composed of real assets, as opposed to 54.5% in the North; real wealth per capita for Veneto families was comparable to that for the North, while the value for financial assets was significantly lower. In the subsequent period real assets in the region grew at the same rate as financial assets, while in the rest of the country real wealth developed faster than financial assets. Nonetheless, in 2005 Veneto family wealth was still higher than the North in terms of real assets (64.8% and 58.4% respectively), and the value of financial assets per capita was still less than the average for northern regions (63,900 euros and 82,500 euros respectively). (Figure 8.2.5) and (Figure 8.2.6) In Veneto decisions regarding allocation of financial portfolios have shown a preference for representative instruments of company shareholding (such as stocks and shares, which have gone up from 17.6% to 23.1% of the total between 1998 and 2005). Pension funds have also grown significantly: the share of pension funds and insurance policies as a total of financial assets has increased from 12.2% to 20.1%, the latter of which is above the average for the North and for Italy by about 5 percentage points. The decrease in government bonds and mutual funds is matched by the increase in postal savings, Italian bonds, which are mainly made up of bank bonds, as well as foreign securities. In 2005 the share of working capital and deposits was still significantly higher than the average for northern regions. (Table 8.2.4) and (Figure 8.2.7) In 2005 financial liabilities per capita for Veneto families amounted to about 11,400 euros, which is lower than the average for northern regions (12,400 euros). These made up 7.7% of total net worth (7.3% in the North). According to Bank of Italy's household survey, in 2006 slightly less than a quarter of Veneto households were in debt, which is in line with what was found on a national level. In Veneto financial liabilities recorded a high annual average growth rate (9.0%), the same as that recorded, on average, in the North, and above the national level. Among financial liabilities, home mortgages and consumer credit had the highest growth rates. (Figure 8.2.8) On the basis of the regional distribution of the national financial accounts, between 2005 and 2006 all financial assets held by Veneto families increased by 4.7%, in line with the North and Italy as a whole. The increase in share quotations has dragged the increase in value of stocks and shares in household portfolios; the decrease in government bonds and mutual funds is matched by an increase in working capital and bank deposits. This is followed, albeit with less intensity, by the increase in financial liabilities (7.9%). Mortgages to purchase homes, in particular, have increased less (8.6%) than the national average recorded in the seven previous years (18.8%).
In the previous paragraph the level of wealth of Veneto families was analysed, measured as quantity of disposable income, as capital invested in financial assets and as a sum total of goods possessed, minus financial liabilities. This wealth is thus a measure of total household wealth, including liquidity and durable goods. Our attention now shifts to net household income, that is that part of total wealth which is potentially available as liquid money.
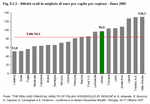
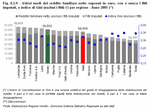
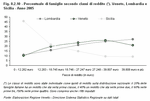
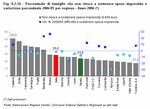
Household income is the main indicator for the assessment of economic well-being, as it measures purchasing power of goods and services that satisfy specific needs. Available data, which come from a survey on income and living conditions which was part of the EU-Silc European project co-ordinated by Eurostat, refer to net household income at current prices. This is equal to the sum of income from self-employment or work as employee, real and financial assets, pensions and other public and private transfers households received, after taxation and possible capital levies. Both disposable income declared by families and imputed rent, that is figurative income from owner-occupied dwellings are presented. Income estimates without imputed rent are believed to be more reliable, especially for territorial comparison, as the value of imputed rent is independently estimated by the home-owner on the basis of the rent that s/he estimates would be paid to live in that same dwelling. In 2005 Veneto families had a net income, excluding imputed rent, of 29,421 euros (35,552 euros if imputed rent is also considered). This is just under 2,000 euros more than the national average and slightly above the previous year (+120 euros). Net monthly income for Veneto families thus comes to about 2,452 euros (excluding imputed rent). Besides the typology of principle sources of income (self-employment or work as employee, or from pension and transfers), differences between households are due to the number of components and above all the number of components with an income: clearly the more people earning in a household, the higher the monthly income. Looking at average incomes for Italian regions, territorial differences are clearly marked: incomes in the South and the islands (with or without imputed rent) are lower than the national average, amounting to 27,736 euros, while for all central and northern regions, including Veneto and excluding Liguria, they are higher. Households in Lombardia and Emilia Romagna have on average higher incomes, while those in Sicilia rank last. (Figure 8.2.9) Together with a measure of average disposable income, a measure of the level of concentration of incomes among families is important. Indeed two regions with similar average household incomes, may have very different distribution of incomes: in one area, individual households may all have a similar disposable income, which coincides with the average, while in another region the average income may be composed of households with very high incomes and others with very low ones. It thus becomes necessary to consider, using the Gini index (Note 10), not only inequality between different areas of the country, but also within the various regions. From the data it turns out clearly that greater inequality is found in the South, where incomes are on average lower. The situation in Veneto is better: resources are more equally distributed and there is less imbalance between rich and poor, as in Trentino Alto Adige, Valle d'Aosta and Friuli Venezia Giulia. In studying household financial situations it's also necessary to make incomes comparable in relation to nuclei of different sizes and nuclei of different composition - that is with components that have different characteristics and needs. In order to do this household income is usually divided by certain parameters (Note 11), so as to obtain an equivalent income which is usually more concentrated in distribution and less imbalanced than monetary incomes. An effective way of comparing equivalent household incomes between regions is by dividing total Italian households into 5 classes depending on income, divided in such a way that each fifth has a 20% share of income, which corresponds to a hypothetical situation of perfect equality (Note 12). The first class consists of families with the lowest incomes, while the last consists of those with highest incomes. Seeing how households are distributed in these five income groups helps outline a financial profile of different household types. As is obvious, families' collocation into the income classes depends on the number of people with an income in the same household: the more income-receiving members, the greater the concentration in high income classes. Across the country one-person households and couples with children have the lowest incomes, which get lower as the number of children increases. Almost half of households with at least one minor are in the two lowest income classes. The elderly are also disadvantaged, particularly if alone, as pensions are lower than workers' incomes. If we compare Veneto to the region with highest average household incomes, Lombardia, and the lowest, Sicilia, then the financial situation of households is positive and has no great imbalances: less than 40% of households have annual incomes of less than 19,000 euros, while almost 50% have incomes between 19,000 and 40,000 euros. There is greater inequality in Lombardia where a quarter of families have incomes above 40,000 euros, and this is the income class with the greatest number of households. The situation in Sicilia and most of the South is quite different: almost half of the households have an annual income of less than 12,000 euros, while one in five has a disposable income above 27,000 euros. Here again there is greater inequality of income distribution, but in the opposite direction to that in Lombardia. If the share of well-off Veneto families (those in the last income class) is divided by that of disadvantaged families (first income class), the value obtained for 2005 was 2.05 which means that for every disadvantaged family there were two well-off. The same index was at 1.72 the previous year: thus the ratio between more and less rich families grew. However it must be pointed out that this ratio is due not so much to a decrease in disadvantaged families, but rather to a slight increase in the number of well-off families. (Figure 8.2.10) On a national level households perceive problems in putting money aside for savings, which is due not only to a mistrust of financial markets, but also to a progressive decrease in salaries' purchasing power. Due to the reluctance to change lifestyle, households tend to consume all income and save very little, and they also resort to loans. According to data processed by Censis, medium-long term bank debts (mainly mortgages, but not only) represent 38% of gross disposable income. This value has risen by over ten percentage points since 2001. Despite this, Italians with bank loans are quite virtuous: over half (58%) say they have had no problem paying back the debt, 35% say they have had slight difficulties, while the remaining 7% run the risk of insolvency. Only a minority of the population can boast financial yield: 17% of the Italian population have government securities, 11.5% have mutual investment funds, while 8% own shares.
In analysing the financial situation, traditional monetary indicators are used, but although these provide essential information, they do not capture families' perception of their financial situation. The economist and Nobel prize winner, A. Sen (Note 13),identified two approaches to the study of economic wealth, the objective and the subjective approaches, defined respectively as standard assessment and self assessment. The first refers to monetary measures, thus income, consumption and possession of goods: the second takes into consideration family perception, which includes monetary and non-monetary factors: While on the one hand it is true that a family's perception of well-being depends greatly on financial income which they can spend and on their effective spending needs, it is also influenced by expectations and family lifestyle. Desires and lifestyle are in turn linked to family structure, characteristics of its components and the need to conform to the standards of one's social environment. Those who feel rich act rich, those who feel poor tend not to spend too much.
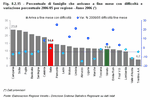
Veneto is one of the regions which, compared to the national level, more strongly feels that it has sufficient final resources. In 2007 a greater number of households in Veneto felt their disposable income was sufficient than in Italy (+1.9 percentage points), and there are fewer families who feel that they have little or completely inadequate financial resources. Nonetheless Veneto families also seem to have perceived a worsening of their financial situation compared to ten years ago, while the number of families who feel their situation has improved has remained the same. This perception can be ascribed to various causes, including increase in prices, increase in cost of life and fiscal pressure. (Figure 8.2.11) A way of testing families' economic level is by looking at the types of goods possessed. Compared to the national average, more Veneto households possess most widespread goods: Indicators of economic well-being are possessing a car, more than one television and a satellite dish. Indicators of a lifestyle in line with new technologies are possessing a personal computer, modem, access to internet, with higher percentage values than the national figure and increasing since the previous decade. (Figure 8.2.12) Families that declare deprivation in terms of some basic aspects of daily life and basic needs such as food, clothes, housing and medical expenses can be considered at risk of poverty. From these it is possible to infer what types of spending have had to be cut: in 2006 13% of Veneto families could not afford the clothes they wanted. This is the indicator with the highest number of families both in Veneto and Italy and has hardly changed since the previous year. It indicates that families first of all cut spending on goods that are least necessary. The share of families with an inability to pay for food fell by nearly two percentage points, and is also lower than the national average, indicating that Veneto's economic situation is generally favourable. The percentage of families who cannot afford to properly heat their homes and who did not have money for medical expenses also fell, remaining at around 6% in 2006. The number of households who are unable to pay scheduled bills (nearly 7%) has slightly increased however, confirming evidence for the recent increase of spending on housing and related services. (Figure 8.2.13) Many Italian families feel a sense of uncertainty and that their disposable income is progressively losing in purchasing power and hence becoming insufficient to meet daily spending needs. Among subjective indicators of material deprivation, 11% of families in Veneto have trouble making ends meet, hence compared to other regions Veneto has one of the most favourable positions. Less than 24 out of 100 families say that they would have difficulty facing an unexpected required expense of 600 euros, which is below the national average. The situation in Veneto has changed little since 2005. For both indicators, there is a typical gap between regions in terms of economic and income-related variables: families in the South and parts of central Italy feel the economic strain more strongly; whereas most areas in the North rank quite high for these two areas in regional rankings. The most disadvantaged areas are Calabria, Sicilia and Campania, which have greater difficulties than other regions, even in spending on basic requirements. Even though these critical situations may be temporary, often the forms of deprivation are linked to one another as they have the same origins: first of all lower incomes, but also factors such as employment and related economic stability, educational attainment, health conditions and characteristics of the family nucleus. (Figure 8.2.14) and (Figure 8.2.15)
It may seem strange to talk about poverty in Veneto, particularly if situations of extreme poverty come to mind, but if we talk about financial difficulties, economic strain, difficulties making ends meet, it becomes easier to imagine that this phenomenon regards some Veneto families too, to be precise 5% in 2006.
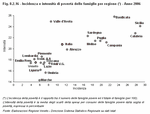
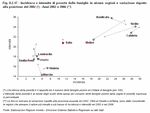
Poverty in Italy is studied through a relative approach, i.e. a household is considered poor in comparison to the average situation of the reference population: an estimate of the incidence of relative poverty, that is poor households or individuals as a percentage of the total of resident households or persons is calculated on the basis of a conventional threshold, called the poverty line, which identifies a value for household expenditure below which a household is defined as poor. According to international standards, a two-component household is defined as poor if average monthly expenditure is lower than or equal to the median monthly expenditure per capita in the country, which in 2006 in Italy was estimated to be 970.34 euros (+3.6% from 2005) This threshold reflects the impact of inflation and variation in consumption patterns. Threshold values vary according to household size, to take into account possible economies of scale. There were relatively few poor families in Veneto in 2006. The region was the third least poor of all Italian regions. The scarcity of poor Veneto families makes it difficult to further analyse the features of this group of population as it is impossible to obtain significant estimates. Southern regions register the highest number of poor families, in line with the profiles of income, consumption and economic disadvantage that have already been explored. Poverty can also be defined not only in terms of incidence, but also in terms of intensity. Intensity of poverty allows the exploration of levels of poverty: this indicator measures on average how far below the poverty threshold average household expenditure is. In Veneto, expenditure is below the poverty line in 17.5% of cases. This is below the Italian average and in line with most northern regions. By combining incidence and intensity, regions where most poor families are resident and where poverty is most intense can be identified. The geographical divide is quite clear: all southern regions, except for Abruzzo, have the most intense levels of poverty and greater incidence. The remaining regions have more restrained situations of poverty: Liguria, Umbria and Marche have the lowest intensity levels. The situation in Val d'Aosta is quite unique: there are few poor households in comparison to the Italian average, but those few have intense levels of poverty. (Figure 8.2.16) Family well-being in 2006 when compared to 2002 shows different directions for poverty. Veneto, which falls in the group of regions with a slight increase in the number of poor families, has had a reduction in the intensity of the phenomenon. Calabria, but above all Molise, show a reduction not only in the share of poor families but also in the intensity. Sicilia however has a more problematic situation with an increase in both incidence and intensity of poor families, ranking top of all regions for both measures. The situation in Emilia Romagna is quite the opposite, with a reduction of both incidence and intensity and ranking as the region least afflicted by poverty. (Figure 8.2.17) Those who are classified as objectively poor do not necessarily see themselves as such. Apparent financial tranquillity may hide concerns regarding a mortgage to pay for the next twenty or thirty years; the desire for a secure future and a certain quality of life; or job security. On the other hand, those with low incomes may not feel concerned if they are used to a moderate lifestyle and do not foresee unexpected required expenses. If we compare regions in terms of objective poverty and that perceived by families we find that the two correspond considerably: particularly in Veneto, the share of families who feel poor is almost the same as those which are objectively poor, which indicates a decided and understandable desire in its inhabitants for economic achievement. In regions like Trentino Alto Adige, Friuli Venezia Giulia and Lombardia perceived poverty is lower than incidence of monetary poverty, which is, in any case, low. The same goes for Abruzzo and Molise, though more widespread. Southern regions are the poorest and also perceive to be, though their perception is well below objective incidence, which is a sign that families have adapted to a more modest lifestyle. In Lazio and Emilia Romagna there is the highest number of households that perceive economic disadvantage compared to families which are objectively disadvantaged. (Figure 8.2.18) In the North, as in the rest of the country, the most disadvantaged households are the larger ones, above all those with five or more members. Difficulties increase as the number of children rise, particularly if they are under 18. In the North the incidence of poverty among couples with three or more children is almost three times greater than that of families with just one child. The situation of the elderly living alone is particularly critical, as well as that of one-parent families, which have seen a worsening of their economic well-being since 2002. Whereas in the North, the situation for families with children is improving, incidence rates are decreasing. It is interesting to note that in northern regions, more than in any other, there is a progressive uniformity in distribution of the various types of poor families. There is a general tendency towards a more uniform incidence rate, which in 2006 went from 3.2% for couples with one child to 8.3% for couples with three or more children. (Table 8.2.5)
|
|
Data elaborated by the Statistics office of the Veneto region are collective property; reproduction of this material is authorised for non-commercial purposes only, provided the source "Regione Veneto - Regional Statistics System Management" is acknowledged.


 Index
Index  Home
Home 


