|
Quality labour and labour quality
The Lisbon Strategy for Growth and Jobs is an essential tool for ensuring that the European Union achieves its long-term objective of improving the life of all its citizens in a Europe characterised by greater prosperity and social justice.
Although the Lisbon objective for average European employment rate has not yet been reached, the creation of new jobs is a basic factor for economic recovery, higher quality of life and remedying the problem of an aging population. To achieve these objectives, incentives and opportunities need to be provided within education and training. Greater investment in human capital and lifelong creativity is undoubtedly the key to creating new and better jobs; it is a way to combat inequality and poverty, a tool that will not only reduce unemployment among young people, but will also help all disadvantaged groups, who have the greatest difficulty finding work, as well as reduce social marginalisation. A rapidly changing economy and aging population mean that the creation of new jobs is an economic and social necessity. The continuous reduction in the economically active population means that suitable measures have to be adopted to attract and keep as many people as possible in the labour market, as there is an increasing imbalance between the number of young and older people, i.e. between those who produce (or have the potential to do so in the future) and those who benefit from past work. Older workers need incentives to stay at work for longer and to dissuade them from retiring too early in their working life. Furthermore, additional attention must be paid to the step from school to employment, and more effort geared towards reconciling a person's professional and private/family life by tapping the potential of women. The pay gap must be reduced in general, the unemployed must be helped and the inactive and disadvantaged integrated. Participation in the labour force
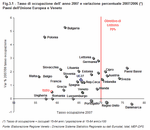
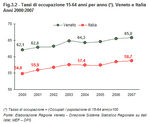
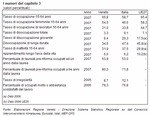
Although the world economy slowed, Italy's employment rate grew again in 2007, up 1% with 234,000 units more than 2006. Once again, a major contribution was made by foreign workers, who comprised 66% of the total of new workers, a figure that reflects European Union expansion and the easier access that Romanians and Bulgarians have to the labour market.Veneto also continued its growth, although this was lower than the previous year. In 2006, employment in Veneto rose by almost 2% on 2005, but in 2007 it increased by 0.8% on 2006. Nevertheless, labour supply has grown significantly in Veneto over the last decade: the employment rate in the labour market rose by 16% in Veneto between 1997 and 2007. Furthermore, it should be noted that the labour supply trend between the fourth quarter 2006 and the fourth quarter 2007 increased much more than the annual average at both regional and national level. Indeed, 308,000 new jobs were created in Italy between these two quarters, while 234,000 were created when comparing the two calendar years. In Veneto, 36,000 new jobs were created in this period, exactly double the difference between 2007 and 2006. Furthermore, Veneto saw its employment rate increase progressively each quarter of 2007, with an overall increase of 2.7%. These figures probably mean that the economy still has some energy, which may well have a positive knock-on effect for growth in 2008. Employment rates have risen both in Italy and Veneto, although they are still some way from the objectives set by the Lisbon strategy, which requires the European Union to reach a 70% employment rate by 2010. Many EU countries met this benchmark some time ago. Denmark is Europe's leading country with a rate of more than 77% in 2007, and countries such as Germany will soon reach this level. When compared with these countries, Italy's employment rate of 58.7% is still rather low, almost 7% behind Spain and 6% behind France. (Figure 3.1) Employment rates in Veneto, however, are considerably better than the national average. In 2007, 65.8% of the population between 15 and 64 years of age were employed, up 0.3% on 2006, a figure higher than the European average of 65.4% based on EU27. (Figure 3.2) When compared with Italy's other regions, employment figures in Veneto continue to rank among the highest nationwide. Emilia Romagna came top, more than 4% above Veneto, which came fifth. Furthermore, Emilia Romagna reached the European objective in 2007 with an employment rate of 70.3%. The lowest ranking regions were once again from the South, which were a long way behind the northern regions. (Figure 3.3) New jobs: permanent positions and part-time contracts
In 2007 the rise in employment rates concerned mainly employees. On the previous year, the number of Italian employees increased by 1.5% (252,000 units), while the number of self-employed people dropped slightly, down 0.3% (19,000 units). The number of open-ended contracts also rose. Indeed 81.5% of new employee jobs were on open-ended contracts, while fixed-term contracts for new positions just topped 47,000. These figures may be the first effects of the law on permanent employment passed by the government. Veneto is in line with the national situation with almost 87% of new employees being taken on with open-ended contracts, while only 13% were employed with temporary contracts. The drop in temporary employment may have positive effects on life-style. Young people in particular may reap the benefits as finances were one of the reasons for them for leaving home late, and consequently they were starting their own families at an increasingly later stage in life. More widespread participation in the labour market can be encouraged with part-time contracts. In 2007, Veneto once again confirmed its widespread use of part-time work, ranking fourth in Italy with almost 15%, more than one percentage point above the national average. This type of contract is used mainly to employ women. Thirty-two percent of the women employed in Veneto have part-time contracts, more than 5% above the national average. Part-time employment is a major tool for making it easier to reconcile family and work commitments; when work is organised to accommodate the family, quality of life improves. (Figure 3.4) Employment per sector
The transition from a mainly industrial economy to a knowledge-based economy is becoming increasingly intense in Italy. Over the last few years the changes that have taken place in the distribution of employment per sector highlight that the economy is shifting away from agriculture and industry towards services.Veneto has also shown consistent growth in the tertiary sector. The number of employees in the service sector rose from 53.3% in 1997 to 57.6% in 2007; while the number of employees in the agricultural and industrial sectors fell by about 2% in each: from 5.5% to 3.5% and from 41.2% to 38.9% respectively. (Figure 3.5) When compared to the national average, Veneto has more than 8% fewer employees in the service sector. Today Veneto is still a mainly industrial region. In 2007, it once again confirmed its place as Italy's second leading region for the most employees in industry, accounting for almost 12% of the national total after Lombardia with 22.1%. Employment in tourism
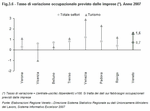
The tourist industry deserves further discussion on account of Veneto's distinctive features.In the last two years, tourism has gone from strength to strength, a success mirrored in the growth of labour demand. Consequently, tourism has good reason to be defined the most important industry in Veneto. Hotels, restaurants and tourist services have taken on a large number of personnel. In 2007, 36.4% of enterprises took on extra personnel (Note 1), a share achieved by no other part of the tertiary sector. Demand for new service jobs (about 47,000 units) surpassed demand within industry (35,000), with 23.4% of this demand coming from the tourist industry. In terms of new jobs, tourism widened the gap between itself and other types of enterprise, increasing its employment rate by 1.6%, while the overall average variation rate was up 0.7%. In the tourist industry, for every 10,000 employees who leave, 11,000 join a basic labour force of around 61,000 employees. The type of contract offered is characteristic of these new jobs: only 22.5% of employees are taken on with open-ended contracts, a figure that places the tourist industry in last place for new employment stability in industry and services. This share drops even further if we also take account of the employment of seasonal personnel, who are taken on mainly in beach, mountain and lake resorts. Nevertheless, the positive balance underlines that 2007 saw an increase in the labour force of the tourist industry, which is most notable in the provinces of Venezia (up 550 units) and Padova (up 240 units). (Figure 3.6) Female employment
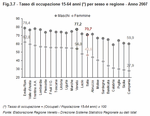
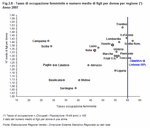
Despite the higher participation of Italian women in the labour market in recent years, Italy is still some way off achieving the Lisbon objective set in 2000, which envisages an average female employment rate of at least 60% by 2010. The European average is closer to the target than Italy. In 2007 58 women out of 100 were employed in EU27, compared with the Italian figure of less than 50. The situation in Veneto in 2007 was better, with a female employment rate of 54%, which placed Veneto midway in Italy's regional rankings. Emilia Romagna ranked first with 62%. It is the only region to meet the target and has done so for several years. On the other hand, Veneto has a high rate of male employment with more than 77%, almost 7% above the national figure and 5% above the EU27 average. (Figure 3.7)All of Italy's southern regions still have very modest female employment rates; Campania is the lowest ranking region where only 28% of women have employment. Furthermore, Campania also has one of the highest rates of children per woman (1.41), a figure that is not shared by most of the other southern regions, where it seems that women have neither employment nor children. Indeed, low rates of female employment go hand-in-hand with the lowest fertility rates. Note however that the recovery of fertility rates in recent years, which is mainly due to northern regions, is also partly due to the growing number of foreigners, who are more inclined to have children. In Veneto, the average number of children per woman is among the highest; in 2007 it is estimated to be 1.38, while the national average is 1.34. It is interesting to note that Trentino Alto Adige not only has one of the highest rates of female employment, but is also the region with the highest number of children per woman. (Figure 3.8) Young and older people
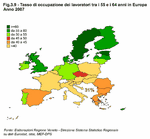
A rapidly changing economy and an aging population mean that suitable policies have to be adopted to encourage and keep as many people as possible in employment, i.e. both young and older workers. On one hand, the growth of Europe is strictly a young people's affair that enables them to add value to their potential with suitable education and training; on the other older workers need to be dissuaded from retiring from work too early.The situation among young people is even more critical. On one hand, Italy's youth unemployment rate is clearly decreasing, however, its values are still rather high: in 2007, 24% of young people aged between 15-24 years old were looking for a job. The situation in Veneto is better, however, as it ranked second for the lowest regional youth unemployment rate with 8.4%; Trentino Alto Adige ranked first with 6.9%, a figure that dropped by more than 3% on the previous year. Once again there is a wide gap between Italy's other regions and the South, although there have been notable improvements over recent years. The participation of older workers in the labour market is also critical for Italy. Although figures have increased progressively, in 2007 only about 34% of people aged between 55-64 years old were employed. The figure is even lower in Veneto where it is 31%, but the share did rise by 2% on the previous year. Many European countries are nearer the target of at least 50% by 2010 set by the Stockholm European Council. Sweden is the leading nation: there 70% of people aged between 55-64 years old still work. (Figure 3.9) Falling unemployment or inactivity?
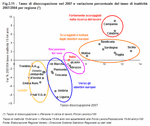
Work is the best safeguard against social exclusion. Consequently it is necessary to implement increasingly efficient policies to combat unemployment. Reducing economic inequality and territorial divides, as well as facilitating participation in the labour market and access to healthcare, are essential if Europe is to achieve complete social cohesion and improve quality of life for everyone.In 2007, Italy's unemployment rate continued to drop, 6.1% on the 2006 figure of 6.8%, the lowest rate in the last decade. Unemployment dropped mainly in the South where it was down by more than 1% on the previous year; this figure however is still much higher than in the North where its rate of 3.5% is three times lower than that in the South. Unemployment in Veneto also fell sharply and is the lowest in a decade; with a rate of 3.3% compared with 4% in 2006; Veneto retains its privileged position among Italy's regions in fourth place, but two places lower than the previous year. The first three positions went to Trentino Alto Adige (2.7%), Emilia Romagna (2.9%) and Valle d'Aosta (3.2%). (Figure 3.10) However, such a considerable reduction in unemployment with a far from record increase in employment may be due to the consistent fluctuation of people seeking work: 10% less than the previous year in Italy, more than 17% less in Veneto. The drop in unemployment may not be due so much to the rise in people who have found work, but rather to the rise in those who have stopped looking, especially in the South. Indeed, figures show that over the last few years a considerable drop in the unemployment rate has been coupled with a significant increase in the number of people who are economically inactive, despite being of working age, a phenomenon that is particularly prevalent in the South. In 2007, the inactivity rate in Italy was 37.5% (up 0.2% on 2006); in the South, however, this rate was 47.6%, almost 1% more than the previous year. The situation is particularly discouraging in Campania and Calabria, which not only have an inactivity rate of 50.7% and 49.4% respectively (up 9% and 6.7% on 2004) but also saw a disproportionate increase over the last three years in people who are not seeking employment, despite being willing to work (almost double for Campania and more than 50% for Calabria). Over the last year Veneto has also experienced a lack of confidence in the labour market. Although the number of economically inactive people grew by only 1% on 2006, a figure that includes both those leaving the labour market because they reached 64 years of age and children under 15, the number of those not seeking employment but declaring that they are willing to work rose by 24%. The number of people who were economically inactive because they were discouraged grew by only 1% in Veneto on 2004. Conditions are more favourable in the North and in Veneto, whose inactivity rate of 31.9% is much lower than the national average and down on three years before. This figure places Veneto in the group of leading regions characterised by very low unemployment rates, employment rates above 65%, and a sound drop in inactivity rates. (Figure 3.11) Long-term unemployment
According to European and national indicators, the fight against unemployment must be geared mainly towards the weakest categories, which includes the long-term unemployed.Long-term unemployment is endemic in some areas. In 2007 47% of unemployed Italians had been looking for employment for more than one year. The unemployed in Veneto were more fortunate as 34.6% had been seeking work for one year; Trentino Alto Adige fared even better, ranking first once again in the regional table with long-term unemployment at 23.3%, although this figure has increased in recent years. The situation in Veneto, however, is far from rosy. On one hand, although figures are considerably lower than the national average, on the other over the last few years figures have risen consistently, up 20% on five years before. Long-term female unemployment, however, was higher; in 2007, 37% of women in Veneto had been in search of work for more than one year compared with a national average of 49%. (Figure 3.12) Pay
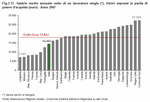
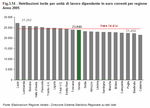
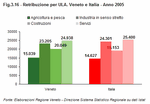
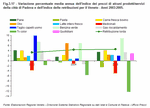
If work dignifies a person, then a good salary dignifies life as it improves social status and behaviour.A table produced by the OECD for 2007 places Italy outside the countries with the highest net salaries: twenty-third out of the thirty countries surveyed. Italy is well behind not only France, Germany and the United Kingdom, but also Greece and Spain. Tax also weighs heavily on Italian salaries. Take a single worker without children who earns the national average of €13,000; the tax wedge (Note 2) is 45.9% (sixth place among the OECD countries), up 0.3% on 2006. The lowest percentage is for a married couple with a single worker and two children. In this case, the tax wedge is 33.8% for Italian salaries (but it was 33.3% in 2006), higher than the OECD average of 27.3% and the EU15 average of 31.9%. However, between 2000 and 2006, the tax burden on Italian salaries dropped by 0.9%, and the greatest drop was in the tax brackets for the lowest salaries. (Figure 3.13) The gross annual salary (Note 3) for a labour unit (Note 4) was almost 24,500 euros in Italy in 2005, but there were net differences among the regions: an employee in Lazio earns on average 5,742 euros more than one in Calabria; Veneto is in an average position with 23,840 euros. Calculating the gross pay index (Note 5) to compare it over time, gross salaries in Veneto are along similar lines to national ones. In the last two years analysed, the annual development rate was more than 4%, i.e. higher than inflation, and in the period between 2000 and 2005, growth was 22.4% compared with the 24.4% national average. (Figure 3.14), (Figure 3.15) e (Figure 3.16) Higher than average pay was earned in the service sector, where in 2005 an employee in Veneto earned an average annual gross pay of 25,000 euros; then came industry in a strict sense with 23,200 euros; then construction with 20,000 euros; and then agriculture with about 15,000 euros. Analysis of figures for the main economic aggregates of the labour market reveal a drop in labour cost, a reversal in labour productivity since 2004, the year it slowly started to rise, and an increase in the number of labour units. As far as inflation is concerned, it is to be noted that the component deriving from the application of collective agreements overall managed to keep pace with prices. (Table 3.1) Below is a rough outline of the dynamics for the prices of some products and services in proportion to pay, in order to monitor variability and to understand how concentrating on one type of product on part of the consumer can distort the perception of purchasing power. Pay values are for Veneto, the product prices used come from a survey (Note 6) of the city of Padova as it is considered a more suitable representation of average regional prices than other provincial capitals, in particular, the regional capital Venezia due to the city's structure and tourism. (Figure 3.17) The figure shows that in 2003 alone, the year after the euro was introduced, as many as five of the products surveyed rose by more than the salary index. Despite a sharp rise in unleaded petrol (2004 and 2005) and in olive oil (2004) variations for all the other consumer packaged goods were below the salary index in the other two years.
Creating employment is already a considerable challenge, but it is even more difficult to improve labour quality. Not only do workers need to be guaranteed suitable pay, they also need job security, equal opportunities and career opportunities.
Lifelong training
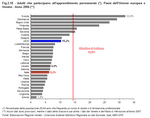
One of the key tools required to ensure quality labour is lifelong training. This is an opportunity that must be offered to everyone because it enables workers to cope with a rapidly changing society, periods of unemployment and transition towards a new job. If employment is to rise, then improvements must be made to the systems that update and improve the skills of adults, a factor which is measured by the European Council with a parameter that calls for a minimum of 12.5% of the population aged 25?64 to participate in lifelong learning by 2010. In 2006, the EU25 was just above 10.2%; in 2007 Italy and Veneto were lower with a rate of 6.2% and 6.6% respectively. The performance of North European countries was very good because they already find themselves well above the target four years before the date established for reaching the objective: Sweden once again leads the way where an estimated 32% of the population aged between 25-64 attend an education or professional training course. Italy's leading regions are Trentino Alto Adige and Lazio, with a share of over 8%. (Figure 3.18) Today it is essential to invest increasing resources in educating and training highly qualified and professionally flexible workers who can meet the requirements of a continually evolving society and cope with a more dynamic and innovative labour market based on increasingly sophisticated and competitive technology. The growing demand for highly skilled professions
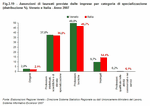
Excelsior (Note 7) has some interesting figures for this matter. The number of enterprises in Veneto that intended to continue taking on employees grew in 2007: the figure was more than 27% compared with a poor 23% the previous year, while the Italian average was 26.5%.Enterprise demand was mainly geared towards professionals who were qualified to work in trade and in services (23.2%) and towards specialised workers (20.4%). Demand for highly skilled professions also increased, especially in the service sector: in 14.2% of cases technical professions were required; in almost 4% highly specialised intellectuals and scientists; and in 0.2% managers. These professionals have a degree, or at least a diploma, and comprise the highest percentage of open-ended contracts (almost 58%). It should also be underlined that there is a growing demand for graduates in Veneto businesses. In 2007, 7.8% of jobs, 2 percentage points more than 2004, required degrees, mainly in economics subjects. These graduates are employed mainly in the service sector and comprise technical or highly specialised professions: almost 50% of graduates found work in technical professions and 37.6% in intellectual, scientific and highly specialised professions, with both figures being above national ones. (Figure 3.19) Graduate employment
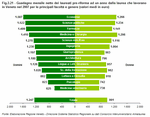
According to the most recent graduate employment survey by Consorzio Interuniversitario Almalaurea in 2007 (Note 8), 53% of young people in Italy who graduated under the pre-reform university system (a five-year degree) had found employment the year after graduating; this figure was 27% for the three-year-degree graduates under the reformed university system (a three-year degree, plus an optional two-year higher degree). An additional 18.4% both enrolled in the higher degree and had found work within a year. The majority of three-year-degree graduates however, 45.5%, decided to concentrate solely on their higher degree, while only 6% sought employment and studied at the same time. The situation in Veneto is better: almost 64% of pre-reform graduates in Veneto were working one year after graduating; this figure was 31% for graduates with a three-year degree, while an additional 20% had both enrolled in a higher degree and were working. The situation is even better for Veneto residents if we consider the employment conditions of graduates several years after their graduation. After three years 80% had found employment compared with 72% at national level.One year after graduating more than 42% of the graduates employed in the Veneto labour market in 2007 had been offered stable employment, and the percentage rises to 74.5% after five years. The most common first employment contracts are of the atypical and flexible sort (46% of the cases overall), however, after a few years they are proposed to less than a quarter of young people. Furthermore, temporary work in Veneto is more commonly converted into permanent employment as time goes by: 70.2% of employed graduates find a permanent job at national level after five years, 4% below the figure for Veneto. (Figure 3.20) But what do the highly qualified recruits earn? Twelve months after graduating, net monthly earnings of graduates of the pre-reform university system who had found work in Veneto in this period were only slightly over 1,100 euros, about 70 euros above the national average. Five years after graduating monthly pay is over 1,350 euros. These earnings are not very high considering all the years of study, the skills acquired in the meantime and the age of graduates when they enter the labour market. Furthermore, there are major differences in average pay according to the degree, as well as an enormous gap between the salaries of women and men. In Veneto, the highest salaries are earned by Economics graduates, while the lowest by those in Veterinary Medicine, a field in which most graduates open their own business, which takes some time to set up. Among the lowest also feature the salaries of graduates in Psychology, Philosophy and Literature, and Education. Although each graduate leaves university with the same education, there is a significant difference in salary between men and women. In general, male graduates earned over 250 euros more than their female counterparts in 2007. The widest gap is for architects. Female architects take home almost 400 euro less than their male colleagues, while the paygap for pharmacists follows with a difference of more than 350 euros. Overall, the disadvantage is partly due to the stereotypical choices made by women, who often choose the humanities, a field in which earnings are not very high. (Figure 3.21) Non-regular labour
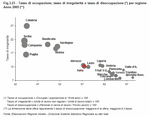
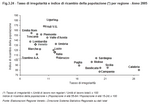
This paragraph deals with another major issue within employment: quality labour in terms of obeying laws and observing social regulations and personal rights. In Italy non-regular labour has reached a critical situation; ISTAT estimates for 2005 reveal how Italy's hidden economy (Note 9) is driven by almost 3 million non-regular labour units (LAU) (Note 10), 78.8% of which are employees.Although the situation in Veneto is better than the national average, vaunting lower levels of non-regular labour and reaching higher employment targets, non-regular labour in Veneto must not be underestimated. The rights and protection of almost 200,000 labour units in Veneto still go unrecognised. Extended coverage of protection networks and continual investment in workplace quality of life must guarantee rights to social security and welfare, two pillars that safeguard those whose efforts contribute to the local economy. The condition of the labour market in Veneto is less worrying than that of Italy; in 2005 in Italy 12% of labour units were non-regular, while in Veneto this figure drops to 9%. Figures for Italy's hidden economy reveal the entity of non-regular labour, which in 2004 produced added value of around 17% of the entire country's GDP, with a peak of 22.1% in the service sector (Note 11). The biggest problems are in the south of Italy, which accounts for almost 45% of Italy's non-regular LAU, a figure that increases even higher in the industrial sector. Non-regular labour in the rest of the country is distributed fairly evenly among the rest of Italy's geographical areas, with a slightly higher share in the north-west. Overall Lombardia, Emilia Romagna, Veneto and Trentino Alto Adige are the regions with the lowest share of non-regular labour; in 2005 their non-regular labour accounted for less than 9% of total employment. (Figure 3.22) Non-regular labour comprises a range of facets: permanent work carried out in breach of tax and social security legislation; undeclared casual work carried out by students, housewives, or pensioners; work carried out by non-resident and non-regular foreign workers; and people with undeclared multiple jobs. In 2005, the largest share of non-regular labour units in Italy consisted of non-regular Italian residents (55.2%); followed by people with multiple jobs undeclared for tax purposes (35.5%); and non-regular foreign workers (9.3%), a share that has dropped sharply in recent years. A range of measures and tools has been introduced to combat non-regular labour and to bring it out into the open. Indeed, European guidelines are imposing strategic policies that will convert non-regular labour into legal employment in order to increase social cohesion and to achieve the Lisbon objectives. From 2001 to 2005 regular labour units in Italy increased by 4%, while non-regular labour units dropped by 10%, in particular in the two-year period 2002-2003 when there was an amnesty for non-regular foreign workers, a measure that brought into the open hundreds of thousands of foreigners who were working in families and enterprises without a contract. This measure brought down Italy's non-regular labour rate by 12.3% from 2001 to 2005 and Veneto's by 12.1%. After a drop in 2002, however, non-regular labour seems to have increased slightly in recent years: from 2003 to 2005 the arrival of 18,500 new non-regular labour units in Veneto increased the non-regular labour rate by almost 10%. Veneto, like all of Italy's northern regions, and some central ones, has a contained non-regular labour rate in conjunction with good employment levels; the situation in southern Italy and the islands is somewhat different as these areas have to deal with high unemployment rates and strong trends in non-regular labour, which comprise almost a fifth of all labour units in the South. It is clear that there are some Italian regions where non-regular labour tends to provide a marginal part of income and some where it is a major contributor. (Figure 3.23) Non-regular labour concerns both adults who cannot find any other type of employment and young people in their first job. Figures for the South show a low population change index, outlining a high level of generational replacement. This suggests how the difficult labour market mainly affects young people seeking independence from their families, but who are forced to deal with the inefficiencies and inflexibility of the local employment market. (Figure 3.24) The situation across Veneto, and indeed Italy, is extremely varied, not only because non-regular foreign workers carry out a wide range of different jobs, but also because each region specialises in different sectors. The distribution of non-regular labour units illustrates that they are largely concentrated in the service sector, in Veneto more than in Italy, in numbers well over three-quarters of all units. The agricultural sector, both in Veneto and in Italy, comprises 10% of non-regular LAU; in Italy, 13.8% of non-regular units work in industry, while this figure is much lower in Veneto, which has 8%. Construction and industry in a strict sense once again experienced the sharpest fall in non-regular labour in the four-year period 2001-2005; the sharpest fall was in Veneto's industry in a strict sense, which saw its non-regular labour rate halve in this period. The only sector to experience a slight increase in non-regular labour was agriculture, which was a little more than 2% in Veneto and over 6% in Italy. (Figure 3.25) and (Figure 3.26)
Quality of life undoubtedly depends on the satisfaction a person draws from his or her job. In order to achieve a satisfactory standard of wellbeing, a person needs to have confidence in his or her job, in the protection and security it provides, and also to feel satisfied with what he or she does day-in day-out.
According to figures from ISTAT's survey "Multiscopo sulle famiglie. Aspetti della vita quotidiana", many people were generally satisfied with their job in 2006. In Italy almost 77% of workers said they were happy with their job, a figure that rose to more than 78% in Veneto. Veneto housewives were more satisfied with their domestic work than Italian housewives: 65.7% of Veneto housewives were satisfied compared with 54.6% of the national average, which was up on the previous year's figure of 51%. (Table 3.2) Overall there was a national divide as to the perception of wellbeing. Employed persons in the North were the most satisfied with their job; employed persons in the South were much less so with 73%; while on the islands only 68.3% were satisfied with their job. The lowest figure was for Sardinia with 67%. Employed persons in the South were, in general, less satisfied with every aspect of their daily life than their counterparts in the North; they were less satisfied with their financial situation, but also with their health, relationships with family and friends, as well as free time. This phenomenon can be explained partly by a subjective factor, namely the character of the people in these regions, who are unwilling to express satisfaction with their lives and always aspire to something more, and partly by an objective factor, namely a genuine lack of job opportunities and unfavourable conditions. (Figure 3.27) Job satisfaction is more widespread among employed women than it is among men. Italian female workers are very or fairly satisfied with their job in 78.1% of cases, more than 2% above their male counterparts; the highest figures were in Veneto where 79% of women were satisfied with their job compared to 78% of men. Better qualifications mean greater satisfaction. In Veneto, the highest satisfaction rates are among managers, entrepreneurs and the self-employed, while the least satisfied are male and female factory workers, figures in line with the national average. (Figure 3.28) e (Figure 3.29) Job satisfaction among graduates
According to a survey on the employment conditions of graduates carried out by the Consorzio Interuniversitario Almalaurea (Note 12) in 2007, the wages of the people questioned are not among the best. In compensation graduates evaluate their working conditions as generally positive.In line with the national figure, on a scale from 1 to 10, job satisfaction among graduates who were working in Veneto one year after graduating was 7.2, an opinion that was fairly common to both men and women. Relations with colleagues was the aspect of work that was most satisfying, followed by independence and acquisition of professionalism. Free time, salary prospects and a career, however, were the aspects that new graduates deemed less rewarding. As time goes by, satisfaction increases, but not by much; the only aspect that shows a jump in quality is satisfaction with the type of contract, which rose from a score of 6.5 to 7.1, and was prevalent among men.
|
|
Data elaborated by the Statistics office of the Veneto region are collective property; reproduction of this material is authorised for non-commercial purposes only, provided the source "Regione Veneto - Regional Statistics System Management" is acknowledged.


 Index
Index  Home
Home 