11 - EU enlargement and inter-regional benchmarking
 European Union Enlargement European Union Enlargement
On 1st January 2007, Romania and Bulgaria joined the European Union (EU), which is continuing its process of enlargement, bringing the number of member states to 27. The promotion of Bulgaria and Romania is the result of both countries' continuous progress over the last year and, in particular, compared to the last report of May 2006. The go-ahead for their entry into the European Union depended on the due countries satisfying precise political and economic conditions established in the Copenhagen criteria. Aspiring EU members are required to demonstrate that they have stable, democratic institutions, respect the principle of legality, protect and promote human rights, recognise the rights of minorities, have a strong, efficient market economy, and have political and administrative organisations in a position to implement all aspects of the Community acquis, i.e. the body of current European norms regarding market, economy, social policy, culture, education, environment, justice, finance and institutions.
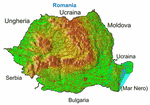
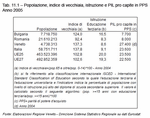
Romania is located in the north of the Balkan Peninsula and its territory is characterised by extensive fertile plains and the Carpathian mountains. Its population of 21,610,213 inhabits an area of 238,391 km2 and more than 50% of them live in towns. The population is relatively young when compared with EU figures, and even younger compared with those for Italy and the Veneto. Romania's level of university education is similar to the Veneto's. GDP per capita, however, is much lower than the European average (Figure 11.1).
Bulgaria is located in the south-east of the Balkan Peninsula and covers an area of 110,994 km2. Its geography is predominantly mountainous with plains to the north and south-east. It has a population of 7,718,750 inhabitants and the number of elderly inhabitants is higher than the European average. The level of university education is very good, whilst the GDP per capita is a third of that of the European average (Figure 11.2) and (Table 11.1).
Migration flows
Enlargement is characterised by two major features: migration flows and new opportunities for investment and trade with these two countries.
With the accession of Romania and Bulgaria, Europe has gained around 30 million citizens and consumers, thus broadening its internal market and creating new business opportunities.
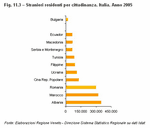
Migration flows, and the possible influx of labour from new member states, are one of the most sensitive issues of the enlargement process. Indeed, free movement of persons is considered to be one of the fundamental freedoms guaranteed by community law, as well as a cornerstone of the internal market and European citizenship. Furthermore, the demographic trends in many EU states where society is ageing and labour requirements dictate a need for experience in certain sectors make free movement of labour increasingly desirable for the future in order to ensure the continued improvement of the economy. On the other hand, labour from new member states is also feared and tends to influence public opinion. It is in response to these concerns that the Treaty of Accession of Romania and Bulgaria has placed some restrictions on the free movement of workers from these two countries for a transitory period following 1st January 2007. In Italy, where Romanians are the third largest migrant population (297,570 Romanian residents, which is 11.1% of the overall foreign resident population), some restrictions on the free flow of migrants from these two countries will be in place for a one-year transitional period (Figure 11.3).
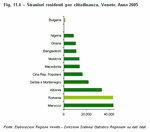
In the Veneto, the number of Romanians is second only to that of Moroccans, with 43,093 residents (13.4% of the total population of foreign residents). Padova is the third province in Italy, after Torino and Arezzo, and followed by Rome, for the percentage of Romanians in the total population of foreign residents.
Foreigners of Bulgarian origin, on the other hand, are currently a minority, both at a national level (17,746, or 0.7%) and regional level (981, or 0.3%). An increase, however, is expected as a consequence of Bulgaria's entry into the EU (Figure 11.4).
As concerns employment, the Romanian community in particular seems to have been successful, considering that in Italy in 2006 more than seven out of ten workers were employed, while only just over two out of ten were not working. In the same year, the Veneto was the fourth region in Italy, after Toscana, Lombardia, Piemonte and Lazio, for the number of Romanians in Employment Areas, in particular in the group of systems of wood and furniture.
Economy
Structural reforms and trade with the EU have enabled the Bulgarian and Romanian economies to make up some of the ground between them and other central-eastern European countries. Today Romania and Bulgaria offer the rest of Europe extremely competitive labour costs, specialisation, a good knowledge of English, a strategic position between Asia and Europe, as well as low taxes for companies and people.
The main economic indicators for the two new member states illustrate the overall growth of their economies and the positive effects that their policies have had (Table 11.2).
Regarding production sectors, Romanian industry has long been the powerhouse of the economy, especially within the fields of heavy industry, refineries and the petrochemical industry. Today, these sectors are suffering the consequences of technological lag with industry contributing to only 35% of added value. Half of its national income is created by the tertiary sector and the remaining 14% by agriculture.
Bulgaria's recent history is characterised by a major overhaul of its economic structure, which has led to a considerable downscale in the role of its agricultural industry. As recently as 1990, agriculture contributed about 20% to national wealth, whereas its contribution had fallen to about 11% by 2004. At the same time, industry - especially the electrical, chemical, food, gas, petrol refinery and tobacco industries - and the service sector developed, and today they make up 30% and almost 60% of added value respectively (Table 11.3) and (Figure 11.5).
Trade
Italy shares strong economic links with Romania and Bulgaria.
Trade with Bulgaria has increased substantially over the last few years and the current flow of Italian direct investment has made Italy one of Bulgaria's main foreign investors.
Italy has even better relations with Romania, which today is a key partner of Italy's economy; indeed Italy is a major presence in terms of capital and businesses (Table 11.4) and (Table 11.5).
Although the Veneto has only minor trade links with Bulgaria, its economic relations with Romania are flourishing. In 2005, Romania was the sixth largest exporter to the Veneto (€1,325 million, equal to 4.1% of total Veneto imports) and the seventh largest importer of Veneto goods (€1,283 million, equal to 3.2% of total Veneto exports). Regarding the type of goods traded between Veneto and Romania, footwear and clothing were the main imports, and footwear, once again, as well as the leather preparation and tanning industry, were responsible for the main exports (Figure 11.6) and (Figure 11.7).
An analysis of the main product groups traded revealed a sort of production network between the Veneto and these two countries; figures for temporary exports suggest that there is a consistent relocation of Veneto fashion businesses, especially to Romania.
|
| Figure 11.1 |
 |
| Figure 11.2 |
 |
| Table 11.1 |
 |
| Figure 11.3 |
 |
| Figure 11.4 |
 |
| Table 11.2 |
 |
| Table 11.3 |
 |
| Figure 11.5 |
 |
| Table 11.4 |
 |
| Table 11.5 |
 |
| Figure 11.6 |
 |
| Figure 11.7 |
 |
|
|
 Benchmarking Benchmarking
The new members states were able to join the European Union because the Commission judged them to be sufficiently ready to satisfy political and economic criteria as well as the provisions of the Community acquis by last January 1st. However they still have to make progress in certain fields and maintain the pace of their reforms even after their accession. Their progress will be monitored and followed step-by-step within the Community enlargement strategy which focuses on three principles: consolidation, conditionality and communication. For some decades enlargement has been at the centre of EU development and the accession of Bulgaria and Romania on 1st January completed the fifth enlargement round which began in May 2004 with the accession of ten member states. Enlargement has contributed towards the increase in economic prosperity and potential, allowing the larger Union to become more competitive at an international level and to respond more effectively to the challenges of globalisation, with direct advantages for the whole of Europe. Enlargement has given the EU greater weight and more say on the international scene. This historic project is based on a vision of a united Europe and of its role in the world. This role was launched by the Strategy of Lisbon, and reformed in 2005 as a strategy for growth and employment, with the aim of improving the competitiveness of the European Union and of achieving sustainable economic growth with new and better workplaces and increased social cohesion.
The entry of the new member states, ten in 2004 and the last two last January, means reaching these objectives has become more of a challenge, especially considering the internal differences faced by these countries. Despite the progress achieved thanks to European Community support, the results so far are inconsistent and less satisfactory than expected.
The need to adopt a global strategy of intervention with coordinated and integrated actions in the economic and social sectors has been recognised. For a sustainable economy it is essential to modernise the European social model by investing in people and combating social exclusion. The positive effects of economic and social cohesion policies on those areas of the European Union that are in difficulty and need more support must be recognised. This would also help face the challenges of enlargement. Indeed there is considerable socioeconomic disparity between the member states and between the regions. This disparity in terms of income and development stem from structural weaknesses in some key factors of competitiveness such as investment in material infrastructure, innovation, human resources and sustainable development. As a result, some regions grow at twice the speed of the group's average and others develop at rates lower than the 1% per year average. The challenge of the cohesion policy lies in investing in competitiveness to allow the member states and the regions to overcome their respective structural problems. The concentration of resources will benefit the less prosperous member States and regions, favouring laggard newcomers.
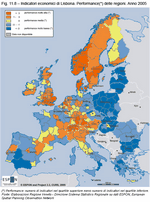
The indicator obtained as a combination of seven (Note 1) of the fourteen indicators identified by the Lisbon Agenda may be useful to highlight the differences between European regions: an area that stands out for its high performance is made up of the region of Stockholm, a part of Norway, Denmark, East Scotland and South-East England, as well as some areas of Germany, the Netherlands, Austria and the whole of Switzerland. Regions with an above-average performance are also found in Italy, Portugal, Spain, Ireland, France, Finland, Slovakia and Cyprus. In some countries, cities distinguish themselves from the surrounding area and from the rest of the country. This is the case for zones of the capitals Prague, Bratislava and Budapest, but can also be seen in the metropolitan areas in Belgium, Germany and Spain.
At a regional level, the combined performance indicator highlights the diverse strategies that the regions should consider adopting, based on their potential, in order to reach the objectives established in Lisbon (Figure 11.8).
Even when considered separately, the indicators highlight different results for different areas. As concerns growth and competitiveness, between 2001 and 2005, the European Union as a whole went through a cyclical weak phase, although there were still good performances in terms of economic growth, level of income and productivity, especially in the new member States. Research and information technology, identified by the Lisbon Strategy as driving forces behind development, showed notable differences between countries and regions. There was disparity and clear delays for new member States and those of southern Europe. The same is true of investment in human capital, measured by learning during the course of one's life: on one hand the Baltic countries and the United Kingdom have shown very high performances, on the other the new member States and some Mediterranean countries have dissatisfactory results for the period concerned.
The tables below show the indicators considered significant for the topics dealt with in the first part of the Statistical Report. In each one the Veneto is compared with the regions considered as competitors: Lombardia, Piemonte, Emilia-Romagna, Toscana, Baden-Württemberg, Bayern, Cataluña and Rhône-Alpes; and with Italy and the European Union.
For each indicator chosen there are three graphs, the first refers to time series of the last five years, the second to the value for the most recent year available, and the third, slightly more detailed, to the percentage variation for the five years in question, to the percentage variation on the last year and to the value of the last year.
Important information
Most of the data used for the analysis comes from Eurostat and BAK. For each topic attempts have been made to show the tendency of the phenomenon through the study of the time series. However, as it has not always been possible to reproduce the same years, the most recent updates available are given. For the Veneto, the most recent data is available for almost all the topics, but to make necessary comparisons, values of the same time period for all the regions analysed have been used. Indeed some differences may be noted between the data presented in the first part of this report and those that follow: this is due to the need to make them homogenous amongst themselves and with some Eurostat definitions that do not always exactly correspond to the official ones used at a national level.
|
| Figure 11.8 |
 |
|
GDP PER CAPITA
On a European level, the Veneto has kept its good status as regards GDP per capita in Purchasing Power Standards. The last year for which there is data for comparison with other European regions is 2004 and the Veneto's GDP per capita was 28,310 euro, 18.6% above the national average.
In 2004 the regions with a GDP per capita above 30,000 euro were Bavaria, Lombardia and Baden-Württemberg.
In terms of annual growth the Veneto's GDP per capita increased by 3.8% in 2004, 0.8 percentage points above the national average. This is the highest growth after Cataluña (+4.9%).
If we look at a longer period, from 2000 to 2004, the rise in GDP per capita was in line with that of other Italian and European competitors. Of the regions selected, only Cataluña's increase in GDP per capita is above 20 percentage points.
|
| Figure 11.9 |
 |
|
Added value from services as percentage of total added value
Analysis of the dynamics of added value confirms that the most industrialised countries are still in the process of tertiarising their economies: the manufacturing sector is becoming less important and the service sector is on the rise.
Of all the regions selected, Rhône-Alpes has the highest share of added value from services. In 2004 the added value from the service sector in Rhône-Alpes was equivalent to 72% of the entire wealth generated from the French region, growing from 69.5% of total added value in 1990 to 72.2% in 2004.
In 2004 the Italian regions with the greatest contribution from the service sector to total added value were Toscana (69.5) and Piemonte (67.9). The Veneto ranks last of the Italian regions with services contributing 63% to total added value.
As regards growth in services from 2000 to 2004, the performance of Piemonte (+6.8%), Rhône-Alpes (+3.9) and Veneto (+3.5%) are noteworthy.
|
| Figure 11.10 |
 |
|
Added value per capita in the new economy
The new economy is made up of sectors related to IT services and telecommunications, hardware production - that is those sectors characterised by innovative instruments with high technological content and considerable research and development. This sector developed considerably in the 90s and has recently seen above average growth and a high level of hourly productivity. The added value per capita of this sector is clearly higher in regions with high-technology, innovative firms such as those in northern Europe: the value of Bavaria, for example, is over double that of the Veneto. The Veneto ranks higher than Catalonia and also comes above other Italian regions such as Emilia Romagna and Toscana. Despite recent efforts, Italy is still far from European levels. Even in terms of temporal dynamics, Bavaria, Rhone Alpes and Baden Wurtemberg are top.
|
| Figure 11.11 |
 |
|
Added value per capita in the urban economy
The urban economy sector is made up of trade, tourism, transport, financial, business and personal service sectors.
Of all the competitors selected, Bavaria has the highest added value per capita from the urban economy. In 2004 the added value per capita for Bavaria was 13,729 euro, 31.9 percentage points above the European average.
Lombardia ranks second with an added value per inhabitant of 12,387 euro.
The added value per capita of urban services for the Veneto (10,538 euro) was slightly above the European average.
Bavaria wins the record for growth from 2001-2005, with a 6.4% rise, followed by Rhône-Alpes and Cataluña with annual increases of 5.9%.
In the same timespan, all the Italian regions selected recorded a drop in added value per capita from urban services, with a negative peak of -3.2% in Lombardia.
|
| Figure 11.12 |
 |
|
Added value per capita in the traditional sector
The traditional sector is made up of traditional industrial branches, which tend to have low added value. It has become less important in western Europe since for many firms it is more economical to relocate production to emerging countries, where labour costs are lower. Regions are forced to reduce the share of this sector to allow a more efficient allocation of resources and to perform better.
Nonetheless in certain regions these industries remain attractive, particularly if highly specialised in top-quality, profitable goods.
From 2001 to 2005 the added value per capita in this sector decreased in all territories selected for comparison, with the only exception being Cataluña (+0.7%).
Veneto is particularly specialised in the traditional sector, which generates about 30% of the region's wealth. In 2005 the added value per capita of this sector was about 5,825 euro and was over 1,900 euro above the national average (3,918 euro).
Among the competitors, Lombardia has the highest added value per capita (6,259 euro).
Veneto comes third, after Baden-Württemberg (5,908 euro).
|
| Figure 11.13 |
 |
|
Number of cross-border greenfield investments and expansion of activity projects per million inhabitants
Since the early 1990s internationalisation through foreign direct investment (FDI) and other forms of non-trade internationalisation has had such an impact on firms in the Veneto that it is now one of the defining features of our model of regional development.
International comparison is possible by referring to the number of cross-border greenfield investment and expansion of activity projects per million inhabitants. With reference to these data the performance of the Veneto can be compared with that of competitor regions.
At the beginning of 2006 the most attractive regions, among those selected, were Rhône-Alpes, with 9.7 projects per million inhabitants, and Cataluña (9.2).
There seems to be a rather wide gap with respect to the attractiveness of the strongest European regions; Lombardia is the only Italian region which can compete with them, with 5.6 projects per million inhabitants.
A comparison with other Italian regions is more balanced. After Lombardia, the most attractive Italian regions for foreign investors are Veneto, Emilia Romagna and Piemonte.
Reasons for this limited presence of foreign-invested enterprises in the Veneto probably include the structure of the region's economy which makes it intrinsically less attractive to foreign MNEs. It is still characterised by medium-low technological intensity and by small and medium-sized enterprises which reduce investment opportunities for international operators. The high concentration of small family-run businesses reduces investors' chances of acquiring already existing activities.
|
| Figure 11.14 |
 |
|
Employment rate for 15-64 year-olds
In 2005 the European Commission relaunched the Lisbon strategy, concentrating mainly on establishing more stable and lasting growth and on the creation of new and better jobs, in light of the rapid economic changes and the considerable ageing of the population.
Five years after the initial definition of the strategy the employment situation is generally better in non-Italian regions, whose employment rates in 2005 were all above the European average. Baden-Württemberg and Bavaria reached the European target of 70% which was set for 2010. Of the Italian regions compared, Emilia Romagna had the highest rate in 2005, 68.4% and it also established itself at the top of all Italian regions for 2006 with a 69.4% rate. The Veneto's position in 2005 is intermediate, with 64.6% of 15-64 year-olds employed, seven percentage points above the Italian average. The Veneto's position compared with Italian regions is also good for 2006, with a 65.5% employment rate. But midium-term observations show that Italian regions are rapidly catching up: national average rates for 2005 compared with 2001 are +3 percentage points, with respect to the European Union's +1.6, and +2.7 in the Veneto.
|
| Figure 11.15 |
 |
|
Employment rate for 15-64 year-old females
In a context of rapid economic changes and continuous reduction of the economically active population and the increase of elderly persons in our society, it is necessary to attract and keep more people in the labour market through specific policies.
Greater participation of women in the labour market is essential in order to reach the economic targets. Though it is at a lower level, the employment rate for females has grown more in Italian regions than in European regions in recent years. German regions reached the 60% European target for 2010 a few years ago, with a rate of 63% in 2005. In the same year Rhône-Alpes also reached the target and Catalonia also came close. Of the Italian regions compared, only Emilia Romagna has reached the 60% target for female employment. The Veneto ranks last among the regions compared here: 53 women aged 15-64 years worked in 2005, compared however with the Italian average of 45 women. Nonetheless in 2006 the female employment rate has continued to grow both in terms of the Italian average and in the Veneto, and reached 43.6% and 53.6% respectively.
The European average was already closer to the target than Italy was in 2005 with 56 out of 100 women in the labour market. Even if 3 out of 4 new jobs in the EU appear to be taken by women, it is important to specify that there are still strong gender imbalances and there are many obstacles preventing women from realising their full potential.
|
| Figure 11.16 |
 |
|
Total unemployment rate
Although the participation in the working world is greater in the European regions they have, on average, registered higher unemployment rates compared with those in Italian regions: in 2005 it was 8.4% in Rhône-Alpes, still below European average (9%), and 7% in the German regions and in Catalonia. The Veneto's 4.2% of unemployed people as percentage of labour force is higher only than the rate in Emilia Romagna, 3.8%, and in Lombardia, 4%, and is more than three percentage points better than the Italian figure. In 2006 the Veneto maintained its good position with 4%. On a national level there has also been a significant reduction in the number of people seeking work in the last two years, and the unemployment rate for Italy has dropped to 6.8% in 2006, compared with 7.7% the previous year. This is the lowest rate in the last ten years. On the other hand, German regions have been witnessing a steady, considerable increase in unemployment levels in recent years: the rates have almost doubled in the last 5 years.
|
| Figure 11.17 |
 |
|
Employment rate for 55-64 year-olds - Adults in lifelong learning
On a European level, the Veneto has kept its good status as regards GDP per capita in Purchasing Power Standards. The last year for which there is data for comparison with other European regions is 2004 and the Veneto's GDP per capita kept its excellent position: 28,310 euro, 18.6% above the national average.
In 2004 the regions with a GDP per capita above 30,000 euro were Bavaria, Lombardia and Baden-Württemberg.
In terms of annual growth, the Veneto's GDP per capita increased by 3.8% in 2004, 0.8 percentage points above the national average. This is the highest growth after Cataluña (+4.9%).
If we look at a longer period, from 2000 to 2004, the rise in GDP per capita is in line with that of other Italian and European competitors. Of the regions selected, only Cataluña's increase in GDP per capita is above 20 percentage points.
|
| Figure 11.18 |
 |
|
Gross Domestic Expenditure on R&D
In economics literature the great importance of investment in Research and Development has been recognised and it has been proven that productivity increases proportionally with increased expenditure on R&D.
Europe is still far from the objective set in Lisbon in 2000 which aims for 3% expenditure by 2010. Equally distant is the 2.5% set for Italy.
The last year for which there is data available for a comparison with European regions is 2003 and the Veneto recorded a slowdown in growth of R&D expenditure as a percentage of GDP (-2.4%).
In 2003 expenditure on R&D amounted to 0.72% of regional GDP.
Baden-Württemberg is the only region which has already surpassed the Lisbon target with 3.88% of GDP for R&D.
Bavaria (2.95%) and Rhône-Alpes (2.61%) are very close to the 3% target, while all the other selected regions are below the European average (1.9%).
Looking at growth from 2000 to 2003, while remaining the lowest, the Veneto's expenditure on R&D grew more than that of all the other competitors (+34.1%).
|
| Figure 11.19 |
 |
|
Gross Domestic Expenditure on R&D financed by industry
In recent decades, community institutions have paid particular attention to the promotion of research and development as a driver of Europe's economic and social growth. This culminated in the definition of the Lisbon strategy during the European Council in March 2000.
The Lisbon objective of having two thirds of expenditure on R&D financed by the industry sector has already been attained by many countries in northern Europe, and has been more or less met by the EU15 and is close for the EU25.
In the German regions considered, the share of firms' expenditure on R&D is about 80% of the total expenditure. Rhône-Alpes and Cataluña have also met the Lisbon objective with almost a 70% share financed by firms.
Of the Italian regions only Piemonte is managing to keep up with its European competitors, with 77% of expenditure on R&D coming from the private sector.
The smaller size of Italian firms is one of the main obstacles to research and development. Not only can larger firms innovate more, but they are also in a position to employ more highly qualified staff.
In 2003 Veneto firms' expenditure on R&D was 0.30% of the regional GDP and was down -3.9% on the previous year.
Expenditure on R&D is spread almost equally between firms and university, with 41.7% coming from firms.
|
| Figure 11.20 |
 |
|
Indicator of global accessibility
A region's infrastructures are crucial for its competitiveness as they determine the extent to which it can be reached by other regions. Accessibility can be defined as the main "product" of a transport system, and the main function of its infrastructures is to favour geographical interaction, that is the mobility of goods and people for social, cultural or economic activity. It is important not only that firms can easily obtain the supply of raw materials necessary for their production cycle or reach their end markets, but also that individuals can use the means of transport and services which facilitate their movement and the development of both their work and leisure activities and their social ties and interests.
The European Community has set the development of the accessibility of its territories as an objective since it believes that "good accessibility of European regions improves not only their individual competitiveness but also the competitiveness of the whole of Europe".
The rate of accessibility calculated by the Bak Basel Economics Institute measures the connection of a region with those of other continents. In the five years taken under consideration, of all the regions looked at Baden-Württemberg always had the best global accessibility, followed by Bayern, Lombardia and Rhône-Alpes; the Veneto comes fifth, with a significant break. The data highlight a positive change in the last year for all the regions, in particular for Bayern (+3.2%).
|
| Figure 11.21 |
 |
|
Indicator of contintental accessibility
The previous section was about global accessibility, a driving force for Europe's competitiveness towards the rest of the world. Equally important is continental accessibility, that is connection between European regions, especially after the entry of new member states and the subsequent eastwards movement of the continent's barycenter. The basic assumption is that areas with the best access to supplies of raw materials and to end markets, ceteris paribus, are more productive and competitive and thus are more successful than more distant, isolated regions.
If we take into consideration the indicator of continental accessibility calculated by the Bak Basel Economics Institute, we do not get the same results as for the global indicator. Even Baden-Württemberg, which remains by far the best region, in the five years considered registers a slight drop. In the last year, however, two Italian regions, Lombardia and Piemonte, recorded a negative change (-0.7 and -1% respectively).
Cataluña, however, has made the most progress: +5.2% in five years and +2.2% in the last year. Together with Bayern, in the last two years the Veneto has had the second highest percentage variation (+1.8%), but for the last available year it has ranked 6th of the 9 regions compared, confirming the presence of strong weaknesses/criticalities in its transport system, as reported in chapter 5 of the first part of this Statistical Report.
|
| Figure 11.22 |
 |
|
Indicators on urban centres
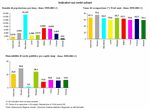
Also compared in this section are some of the main cities of the regions considered.
Barcelona has the highest population concentration with over 15,000 inhabitants per square km from 1999-2003. Its density is thus more than double that of Italian cities such as Milano and Torino. Venezia has the lowest population density with 650 inhabitants per square km.
Cities do not however have the highest employment rates, indeed they are generally lower than the regional figures. The exception is Munich, whose employment rate is higher than ever (on average over 75% of the population is employed) and well above the high employment rate (around 70%) of its region, Bavaria. Of the cities considered, the other German city mentioned also stands out for its higher employment, while in third place is Bologna, the top of the five Italian cities. On the other hand Emilia-Romagna is the region with the highest employment rate, which is now close to the 70% objective set in Lisbon.
The effort to improve the quality of life in city centres also involves the restoration of the urban environment and the reduction of polluting factors. For instance to make urban areas more inhabitable it is essential to dedicate part of the areas to public green areas, a factor which varies considerably in the different centres considered. Once again it is the German cities and Bologna which have the highest amount of green areas, particularly Munich with 37 square metres per person. Most of the other cities are below the threshold of 15 square metres, particularly low is Barcelona which is also the most densely populated centre.
|
| Figure 11.23 |
 |
|
 Back Back
Notes
- The seven indicators calculated by ESPON - European Spatial Planning Observation Network - are: GDP per capita, GDP per employed person, Employment rate, Employment rate of persons aged 55-64 years, Spending of GDP on R&D, Dispersion of regional (un)employment rates, Long-term unemployment rates. For the remaining seven there are no available regional data. The analysis thus focuses on economic indicators and does not take into account all the aspects of the Lisbon Agenda (for instance environmental indicators are not included).
|
|
Verify the accessibility :

|


 Index
Index 


