9 - Local authority spending
A few years ago, many European states set processes in motion to decentralise the central government's functions
towards the local authorities. (Note 1) Of particular importance to this regard was the increased autonomy in terms of spending and revenue granted to the decentralised bodies, with an increase in available resources and spending power attributed to local government budgets. In some countries, this process was developed alongside constitutional reforms which caused the evolution of the states' structures from unitary to federal. The strategic aim is to streamline the bureaucratic mechanisms in order to make the services for citizens even more efficient, improving the quality and speed of delivery and guaranteeing optimum allocation and use of resources.
Within this context of institutional change, the distribution of spending to the different levels of government in the public sector is analysed, taking research carried out by the ISAE [Institute of Economic Research and Analysis] as a starting point. This distribution differs among the various European states depending on their respective institutional structures.
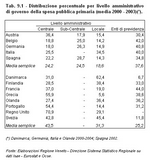
The constituent structure of a state can be seen through the total share of spending managed by the different institutional levels. The average share (Note 2) managed by the central governments of the federal states (Note 3) for 2000-2003 came to around 24% of total spending, less than that of the so-called unitary states whose average was around 44%. A remarkable variety was revealed among the spending shares assigned to the central governments in the different federal states. It varies from the minimum of around 19% in Belgium to the maximum of 36% in Austria. While, in the unitary states, the minimum is recorded as 27% in Holland and the maximum as 71% in Great Britain. This last value is so high due to the fact that the functions which are carried out by the departments of social security in other states were here included in with those of the central government. (Table 9.1)
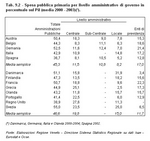
As can be expected, the total amount of resources managed by the central governments in the unitary states is a lot larger than in the federal states. On average it comes to almost the double, as can be demonstrated by putting these quantities in relation to the GDP. There are remarkable differences in performance between the countries; to equal levels of spending correspond widely differing degrees of decentralisation. (Table 9.2)
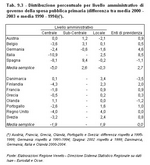
The reduction of the central government's share of the total spending, which started in the 90s, involved all the countries. The average primary public spending by central governments in the federal states decreased by 5 percent during the three year period from 2000-2003 in comparison with the1990-94 average, whereas in the unitary states it decreased by 2%. A more pronounced contraction of this spending can be observed in Italy and in the countries whose constitutional structure underwent the institutional alteration from a unitary to a federal state. (Table 9.3)
 The main spending areas of the local authorities The main spending areas of the local authorities
The complex web of areas and institutional levels leads to a public system which is constantly reorganising itself. To gain a better insight we would like to analyse the current distribution of areas among the different institutional levels.
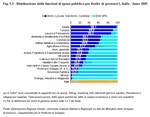
Out of the main spending areas (Note 4) which occupy the decentralised administrations in Italy, health, 98% of which are financed by such bodies, took up 42.2% of the total local spending in 2005, or 45.7% together with interventions in social and charitable areas. The local authorities have a larger spending share than the central bodies for the areas they are directly concerned with such as tourism, trade, labour, agriculture, housing and urban development. These cover very small shares of decentralised public spending; less than 2%.
The second-largest figure in terms of spending of local authorities regards the activities of general administration (Note 5), which amounts to 17.1%. This expenditure is used to guarantee the functioning of the bodies and the maintenance of their property, but the majority is taken on by the central bodies with 62% of public spending.
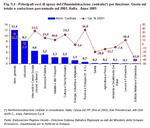
One field which has been strongly affected in recent years by the devolution processes towards local authorities is education. In 2005 33% of total public spending for education was mamaged by the local bodies, which corresponds to 9% of the total local authorities' spending. (Figure 9.1) and (Figure 9.2)
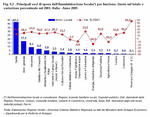
The enlarged public sector (EPS), which consists of both central and local bodies (Note 6), manages and distributes services in addition to the PA (Public Administration). In the light of the structural changes to the public institutions, which took place in recent years, the EPS continues to grow and to make its presence felt, above all in certain sectors. In the energy, industry and crafts sectors, for example, 94% of total public spending in this sectors is managed by the EPS - an amound which corresponds to 61.7% of the whole enlarged public sector spending in 2005. In the transport and roads sector 54.6% of total public spending are managed by the EPS. (Figure 9.3)
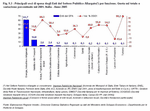
In 2005, central public administration, not including their budgets' most important spending as has already been looked at, such as spending on pensions, defence, law and telecommunications (to verify) which are areas which concern exclusively the state, spent a share of 12.1% on the activities of general administration, followed by 8.2% on education, 4.6% on social and charitable aspects, 3.2% on public security and 2.3% on transport and roads (check the graph label). (Figure 9.4)
 Spending on education Spending on education
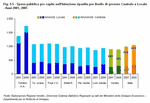
One of the strategic functions of public administration, closely linked to the growth and boosting of the human capital and which increasingly concerns the decentralised bodies, is education. Spending per capita on education in Italy increased by 5.6% from 2001 to 2005.
In all of the regions compared (Piemonte, Lombardia, Trentino Alto Adige, Veneto, Friuli Venezia Giulia, Emilia Romagna and Toscana) there is the tendency to increase the level of spending per capita, except for in Veneto and Friuli Venezia Giulia. There is, however, an increase in the share of spending taken on by decentralised administrations in all the regions. Trentino Alto Adige maintains the highest spending per capita, i.e. €1,733 in 2005, which corresponds to an increase of 26.4% since 2001, due to the higher amount taken on by local authorities (Note 7). (Figure 9.5)
However, in 2004 Trentino ranked lowest for the number of graduates per 100 university students. In this respect Friuli Venezia Giulia was the region showing the most dynamism with .. graduates for every 100 students in 2004, with a spending per capita of €1,105 per inhabitant in 2001, second in this respect only to Trentino. In 2005 this figure was on the decrease at €1,082. (Table 9.4)
The Veneto is in penultimate position, with Lombardia last, with regards spending per capita on education, with an amount which decreased even further during the period of time taken into account, reaching €878 in 2005. But here the actions of public administration prove to be efficient, in as much as the Veneto takes 3rd place for graduation rates in 2004 and shows an equally good performance in terms of the lowest number of high school students in every 100 having to repeat a year, where it comes second only to Trentino. (Table 9.5)
However, it took a certain amount of effort for the Veneto to achieve these results, which is probably due to the fact that the management of the schooling system is still too centralised: in fact, it can be underlined that in Trentino Alto Adige, where the management of spending on education is mostly in the hands of the local authorities, 6% is the percentage of people who judge the schooling system to be inefficient, which is lower than the national average of 7%. Whereas, despite the good rates with regards numbers of people finishing their studies, in the Veneto the percentage of people who judge the schooling system to be inefficient is a little higher at 8.6%.
 Spending on health Spending on health
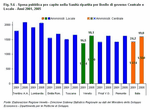
The decentralised bodies largest commitment on spending is on health. Spending per capita on health increased in Italy by almost 12% from 2001 to 2005, a trend which was generally repeated in all of the regions compared. The Veneto shows a rather pronounced growth in this period compared to the other regions, however there is no manifestation of substantial changes in the interregional structure. Trentino Alto Adige and Lombardia are the regions with the highest spending per capita: €2,111 and €2,084 per inhabitant respectively in 2005. Piemonte is the region with the lowest level of spending with respect to its population, Veneto and Friuli Venezia Giulia are both at €1,635, and even though they are above the national average they are behind Emilia Romagna and Toscana. (Figure 9.6)
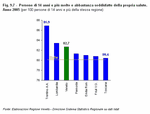
Confirming Trentino Alto Adige and Lombardia's commitment to higher spending, in 2005 the residents aged 14 or above of the two regions proved to be happier with their state of health than the residents of the other regions compared. However, over 80% of the population in all the regions were satisfied, but it has to be said that the Veneto's public administration, even though it spends less than Emilia Romagna and Toscana, seems to make a better impression on its population with 82.7% claiming to be satisfied with their state of health, more than in Piemonte, Emilia Romagna and Toscana. (Figure 9.7)
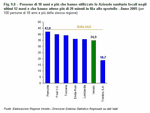
The local health authorities in Trentino provide an undoubtedly more streamlined service, here only 18.7% of over 18 year olds had to spend more than 20 minutes in the queue at the desk. In the other regions this percentage more than doubles. The Veneto, however, at 34.9%, has a more efficient local health authority service than all the other regions which, in 2005, saw larger numbers of people having to spend a long time waiting in queues; for example from 36% in Lombardia up to 42% in Piemonte.
It is Trentino once again, which has a higher spending power, to have the largest percentage of people - 95.5% - satisfied with the medical care received while in hospital. However, Toscana, Veneto and Friuli Venezia Giulia also reach percentages of over 90%, whereas Emilia Romagna is in last place with 86.6%. (Figure 9.8)
 Spending on institutional processes Spending on institutional processes
We'll now look into certain aspects concerning public administration, starting from how much is spent on the functioning of its administrative structures and institutional bodies, and on the management and conservation of its property.
In Italy spending on these activities of general administration increased by 21% from 2001 to 2005. This is a trend which manifested itself in all the regions compared except for Trentino, where this type of spending remained essentially stable.
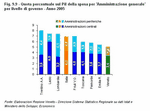
This type of spending takes up 7% of the gross internal product in Italy, this number is further divided into 4% for the central administrations and 3% for the local authorities. The Veneto's public administration stands out for its virtuosity: only with 5% of the GDP used to maintain its public institutions and its patrimony, it falls into last place among Italian regions. Trentino Alto Adige shows a higher level of spending in this area, 8% out of its total product, higher than the national average of 7%, which is probably the reason for its stability shown in these five years. (Table 9.6) and (Figure 9.9)
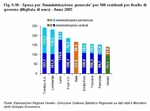
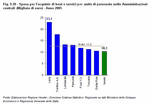
In general the central public administration spends a smaller share on the activities of general administration than the local public administrations. But, in monetary terms compared to the GDP, it is precisely these bodies which spend more, a development that is reflected also in the national average. This is true for all the regions, except for Lombardia where the local authorities dedicated 4% of the GDP to this area - more than its own central administrations which dedicated 3.2%, and Trentino Alto Adige where the decentralised administrations' spending is more than 4% of the GDP. Trentino Alto Adige's excessive spending on general administration is shown also by the fact that it dedicates 241,000 euros per 100 residents to this area, this is more than one and a half times the Italian average of 167,200 euros.
In almost all of the regions the public central administration requires more than 100,000 euros per 100 residents for these activities, only in the Veneto and Piemonte do they keep to 94,400 euros and 99,700 euros respectively. As far as the local administrations are concerned, Veneto with 44,900 euros ranks penultimate, just in front of Lazio with 43,100 euros. (Figure 9.10)
 Personnel Personnel
Understanding how the main productive factor of the public administration is distributed, and trying to identify the critical elements to be faced and the best practices to value and pursue is a fundamental element in the evaluation of the processes in public institutions.
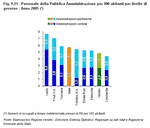
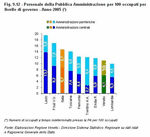
In 2005, for every 100 inhabitants in Italy, 5.7 worked for Public Administration (Note 8), this is 14.8% of the employed population. The central administrations have more weight with 3.3 employees per 100 inhabitants, 8.7% of the employed population, than the local authorities with 2.4 employees per 100 residents, 6.1% of the employed population.
In the comparison between regions, Lazio, considering it is the region which hosts the capital city and therefore has an evident impact on indicators referring to personnel working for the PA, has the most public employees; in fact in 2005 it counted 7.7employees per 100 inhabitants, 19.5% of the employed people in the region. This figure is divided into 5.4 employees per 100 inhabitants working for the central PAs, and 2.3 working for the local authorities. Lazio evidently has much larger central structures than the other regions. Friuli is next, with 7 employees per 100 residents, 16.8% of the employed population, of whom 3.8 work for central administrations and 3.2 for the decentralised administrations. (Figure 9.11) and (Figure 9.12)
Veneto's PA seems to have adopted more restrictive measures in terms of human resources, and it comes in front of only Lombardia for the number of employees compared to the number of inhabitants - 4.8%. This percentage is split into 2.6% for the central administrations and 2.2% for the local authorities. Lombardia has only 4.4 employees per 100 residents.
Trentino Alto Adige stands out in this respect as, as opposed to the other regions, the staff of the decentralised administrations outnumber those of the central PA by almost three and a half times. In fact it has 4.2 employees of the local PA per 100 residents, as opposed to 1.2% working for the central administrations in the region. This can be explained as a consequence of Trentino's status as a region with political autonomy in certain matters, which gives its local government the possibility to carry out administrative functions directly which in the other regions are still carried out by the State.
 Management Management
In recent years also the public administration's management has been faced with the general trend towards saving resources. The consequence is a reduction in the number of managers and the improvement of their competence through the promotion of better leadership skills tailored towards the achievement of the strategic aims defined by the different bodies.
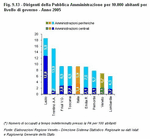
There are 15 managers of the Trentino PA per 10,000 inhabitants, 6 more than the Italian average, in this way Trentino separates itself from the other regions once more. Lombardia ranks last in this respect with only 6 public administration managers per 10,000 inhabitants, whereas in the Veneto there are 7. In Lazio, there are actually 19 per 10,000 residents, a sign of the presence of the central public administration's strategic organisational sectors in this region. (Figure 9.13) and (Table 9.7)
The local authorities in all the regions apart from Lazio, have a larger quantity of managers than the central administrations, both with regard to the ratio of managerial service to population, and with regard to their number compared to the rest of the staff: the regional ratings on the ratio of managers to inhabitants does not change particularly, Trentino is still in first place with 14 units, in last place are Veneto and Lombardia with 5 and 4 managers per 10,000 inhabitants respectively. Even compared with the total number of staff present, Trentino is in first place with a share of 3.3%, and this time the last three regions are the Veneto with 2.2%, Friuli Venezia Giulia and Lombardia with 2.1%.
It has to be said, however, that most of the differences shown have to do with the different types of contracts the bodies refer back to, since the logics behind their organisation, although they all tend towards a general containment of all public management, can leave room for different systems, also with regards the increased possibilities of recourse to decentralised marketing.
 Spending on personnel (Note 9) Spending on personnel (Note 9)
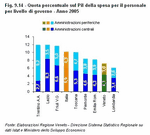
Spending on public administration staff in 2005 equals 10% of the GDP, and reaches 12% in the two regions with political autonomy in certain matters and in Lazio. Veneto and Lombardia are ranked last, at 7% and 6% of their own product respectively. In Piemonte, Veneto, Friuli Venezia Giulia and Lazio, the employees of their respective central bodies are more of a burden to their regional product than the local authories' employees. This reflects the national trend, where spending on employees of the central bodies equals 6% of the GDP and spending on the local authorities equals 4%. Trentino Alto Adige stands out because, as a consequence of its local authorities larger number of staff, it spends 9% of the GDP on personnel, as opposed to Veneto and Lombardia's 3%. (Figure 9.14)
The central administrations use 16.5% of their overall spending on personnel, adding another 5% for the purchase of goods and services. The largest expense for these bodies is, at a percentage of 55.2%, the transfers to families and social institutions' bank accounts, which involve mainly social security payments and income support.
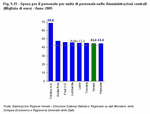
Lazio's central public administration spends 19.2% on its staff, which is more than the other analogous territorialised public institutions. Friuli is next with 16%, then the Veneto, 15.7%, and in last place is Trentino Alto Adige with around 11% of its total spending.
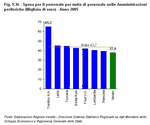
It's interesting to note how the regional ranking based on the unitary rate of spending on staff puts Trentino Alto Adige in first place once again with more than 65,000 euros spent by the public administration on each employee both in the central administration and the local authorities. Whereas Veneto's local authorities are in last position, and with less than 38,000 euros prove to be paying particular attention to the containment of this type of spending in comparison with the other regions. (Figure 9.15) and (Figure 9.16)
 Main spending within local authorities Main spending within local authorities
The staff of the local authorities in Lombardia take up only 17% of the total decentralised spending, the rest is spent mainly on the purchase of goods and services. Moving up through the ranking we find Veneto and Piemonte with 25%, all the way up to Lazio with 34.3%. (Table 9.8) and (Table 9.9)
This expense, along with the purchase of goods and services (Note 10) on the decentralised administrations' part, is the one mainly subjected to the restrictions imposed by the internal stability pact which started with the Maastricht treaty and which restricts the local authorities considerably by containing spending. In fact, most of the local authorities' spending is taken up by the purchase of goods and services, 38%, which, along with the spending on personnel, 27%, makes up 64.6% of the consolidated decentralised spending in 2005.
In all of the regions, this percentage easily exceeds 50% of the respective total spending, although it varies greatly from region to region. It ranges from 52.4% of spending in Trentino Alto Adige to 73.2% in Toscana.
The local public administration's direct commitment to the production of services is therefore high, especially since the institutional reforms of the last two decades and the decentralising of administration. Despite the various restrictions, the expenses in this area have further increased in recent years and, as can be seen from a study carried out by the ISAE [Institute of Economic Research and Analysis] on the effects of the implementation of federalism, a considerable increase in decentralised bodies' expenses in 2003 and 2004 can be attributed to the wages of employees. This is due to the effects of the transfer of authority, especially in the areas of education and welfare, to the local authorities in those years.
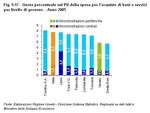
The trend in spending on the purchase of goods and services has repercussions in monetary terms on the spending rate with relation to the GDP. In Italy, spending by local authorities on the purchase of goods and services was 6% of the GDP, spending by the central administrations, 2%. This trend is repeated in the other regions too, except for in Lazio, where the extra weight of the duties of its central public administration makes itself felt as always. Veneto and Emilia Romagna spend 6% of their GDP on purchasing goods and services, purchased as input towards the production process, mostly for the local authorities; this is less than the all other regions which spend around 7% or 8% of the GDP, on a par with the national average. (Figure 9.17)
 Efficiency of the public administration Efficiency of the public administration
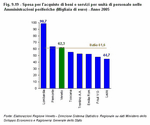
With a view to improving efficiency and making the public administration's management of services more cost friendly, we'll now consider the unitary spending on purchasing goods and services (Note 11). This, as can be deduced from the previous considerations, is a lot higher in the local public administration than in the central administration, in the Veneto as well as in the rest of Italy. It has also shown a further increase at the decentralised level if we compare 2005 to 2001, differently to what has happened in the central public administration, as an effect of the greater spending power granted to the local public administration after the institutional reforms.
This indicator can give an idea of the volume of current administrative activity carried out by the bodies: a higher unitary monetary value of this type of spending may indicate, on the one hand, a more consistent managerial activity being carried out by the bodies, on the other hand, however, it could be the sign of resources being used inefficiently in current activities to the detriment of investments intended for development. Only the consideration of the impact of this type of spending on society and on the economy can give an account of the rational use of resources.
The current orientation of the public administration, set to de-bureaucratise and to streamline procedures, is directed towards the saving of resources, also using systems of process rationalisation and new technologies. The e-procurement programme, promoted by the Ministry of Finance and Economics with the contribution of CONSIP S.p.A., was created to this aim: the portal for the public administration's online purchases is intended to rationalise purchases of goods and services and to achieve lower spending, in order to improve the efficiency and effectiveness of administrative processes through innovation and sound management in a changing environment. (Figure 9.18) and (Figure 9.19)
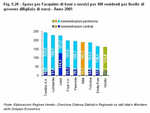
Lazio's central administrations spend around €23,000 per employee on goods and services, this is almost double that of the same institutions in the other regions. But what we are most interested in is understanding the very noticeable differences in behaviour between the local public administrations in the various regions: Lombardia's local PA spends €98,700 per employee on goods and services as input towards the annual productive process, standing out considerably in this respect. Piemonte follows with €63,400 and Veneto with €62,300, both above the national average of €61,600. Bringing up the rear is Lazio with €44,700 per employee spent by its local PA in 2005 for the purchase of goods and services. This ranking is by nature highly influenced by the size of the staff, in fact in Lombardia the local authorities had a more restricted number of staff, which had an effect on the value of the indicator. If the bodies' spending is considered in relation to the population, Trentino Alto Adige's PA finds itself in first place once again with €222,000 spent in 2005 on goods and services per 100 inhabitants. Lombardia maintains one of the highest values, 198,000 euros spent in 2005, while the Veneto moves into last place with €134,800 spent on the purchase of goods and services in relation to its population. (Figure 9.20)
 Simplifying administration Simplifying administration
From the available information it is difficult to understand what could be the optimum balance between the amount of activity the administrations carry out and the amount of money spent on their correct functioning, so as to be able to provide services which have a positive impact on the citizens.
As already mentioned at the beginning of the chapter, it would be necessary to carry out further analyses in the education and health sectors.
To conclude this study, in order to evaluate in some way the adequacy of the spending commitments highlighted before, we will go into a supply-demand type analysis of some of the most common services provided by public administration and currently used by the citizens. We will highlight some of the aspects to be looked at with reference to the evolution of communication and information technologies.
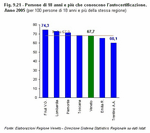
As an indicator of the demand for administrative activity carried out by the PA, we will look at the applications for certification at public offices which are affected by the regulations aiming to streamline procedures. In Italy 68% of over 18 year olds know how to do "autocertificazioni" or self-declarations. The remaining 32% who do not, however, are still too many considering that around ten years have passed since the law L. 127/1997 was introduced to simplify administrative certifications. 74.3% of the population of Friuli, more than in the other regions, know about this way of simplifying administrative practices. Also in Lombardia, Piemonte and Toscana, a percentage of the population which is higher than the national average claims to know about it. Veneto's figure is around the average at 67.7% and Trentino Alto Adige is in last place with 60% of the people knowing about it. (Figure 9.21)
In 2005, certificates regarding personal data, were the ones most requested by the population: in all of the regions more than 25% of over 18 year-olds declared to have applied for one during the previous year. In first place are Lombardia and Trentino where 32.7% and 32.2% of the population respectively turned to public offices for this reason. There is generally a lower demand from the population for other kinds of certification which regard mostly the central government's offices, such as certificates concerning cars, schooling, land and real estate property, and other types of certificates. This is probably linked to the lower number of uses connected to these. The people of Trentino are also shown to be more likely to ask for different types of certificates than the residents of other regions. This may be explained, apart from the fact that they are less aware of the practice of self-declaration than the people in in other regions, by the greater number of small municipalities where there is probably a more direct relationship between the citizens and the public administration. (Table 9.10)
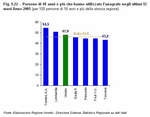
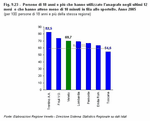
Taking a closer look at the registry offices, which resulted to be the type of service which is most requested by the population, we can see that in Italy in 2005, 46% of over 18 year olds went to these offices: the residents of Trentino Alto Adige, Lombardia and Veneto went in larger numbers than the other regions, 54.5% of Trentino residents, 50.7% of Lombardia residents and 48% of Veneto residents. Along with Friuli Venezia Giulia, these are the regions where the highest percentage of the population had to wait in the queue for less than 10 minutes, which shows the service is more organised in these regions. (Figure 9.22) and (Figure 9.23)
 Services offered through information and communication technologies Services offered through information and communication technologies
Considering this particular form of service demand, there are supply conditions which still do not optimally respond to it. In recent years the aim has been towards the improvement and rationalisation of the offer of public services, mainly through the use of information and communication technologies. In 2005 three important strategies were adopted, which were backed by regulation acts and intended to have a profound influence on the activities of the public administration in the next few years: the digital administration code which provides a homogeneous and unitary framework aiming to regulate the application of the new digital technologies in the public administrations; measures to rationalise the use of data processing programmes and services to improve the operative efficiency of the public administration and to reach a further cuts in public spending; the starting up of the public system of interconnectedness and cooperation, and the public administration's international network with the aim of developing, sharing, integrating and spreading the PA's wealth of information.
According to the data published in the report on innovations in Italian regions, out of the total number of services offered online by the municipalities with a population of over 10,000 inhabitants, the services of online certification and authentication are provided by 11.8% of these municipalities. This consideration, along with what has already been said about the demand, brings us to understand that there is still a large number of the population who need to have direct contact with the public offices both out of habit and because of a certain reticence about the use of innovative systems, and also because of the continued presence of certain problems related to the provision of services.
 The tendency towards the use of information and communication technologies The tendency towards the use of information and communication technologies
The activities carried out through the offices in direct contact with the public still play a prominent role, also considering that the number of Italians who tend to use information technologies is still not very high. This number has increased from 27.1% to 31.8%, greatly encouraging the cultural evolution of the Italian population with respect to a public administration equipped with technological innovations.
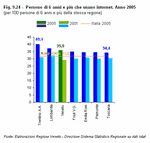
It is the people of Trentino who used the internet the most in 2005, namely 40% of the over 6 year olds. This percentage is much higher than the national average. In second place ranks Lombardia with 37.3%. The other regions reach shares of around 34%-35%. The percentage is on the increase in all the regions. (Figure 9.24)
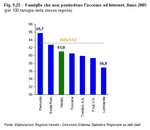
It must be kept in mind, however, that in the same year there were also a lot of households who still did not have access to the internet: Piemonte is the region with the most of such households at 65.7%, which lies above the national average of 63.2%. In Lombardia the number is 57% and the Veneto is ranked somewhere in between with 61%. This aspect would obstruct the chance to renew the direct link between public administration and the citizens, as well as the Italians' tendency to still be too precautionary: in fact there are still a lot of people who have never ordered or bought goods and/or services off the internet, 83.5% of over 6 year olds in Italy in 2005, mostly due to problems of security linked to the idea of communicating one's credit card details over the internet. In this case there is a clear sense of distrust linked to the protection of one's own income, this is a problem which should not affect the relationship between the citizen and the public administration over an IT network. (Figure 9.25)
 The citizens and online public administration The citizens and online public administration
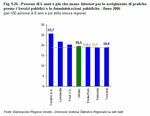
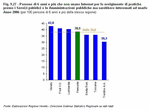
Let us now look at how the citizens behave with regards the computerised public administration. There were still few people who in 2006 carried out administrative practices with the PA over the internet rather than going to the office in person: only 19% in Italy. There were a lot more in Trentino, at 25.7% this is the highest percentage out of the Italian regions. In Veneto the share was 19.5%, which is ranked in the middle of the regions compared. But 42.8% of the people interviewed in the Veneto would be prepared to do so, which is the highest number out of all the regions, even though the people do not actually use the internet for this purpose. This demonstrates a certain willingness to receive favourably the innovations proposed for the provision of public services. (Figure 9.26) and (Figure 9.27)
 Businesses and online PA Businesses and online PA
As far as businesses are concerned, there is no available data at a regional level, but different amounts of use of the PA's online services are shown as their degree of interactivity increases. Around 93% of Italian businesses with at least 10 employees with an internet connection have relations with the public administration. In the North East it is 93.6% of the businesses, slightly more than in the other areas. 81% of Italian businesses use the Internet in order to obtain information, 79.3% to download forms, 53.2% to send completed forms, 39.3% to carry out entire administrative procedures electronically. The businesses in the North show a higher level of familiarity with downloading forms compared to the other areas, they are, however, less likely to use further levels of IT interaction with the PA, both as far as sending completed forms and carrying out whole bureaucratic practices are concerned. This may be influenced by various factors both on the part of the demand and supply. On the demand side it could be wariness or the user's limited technical capabilities, or the decision to delegate the management of practices with the PA to an intermediary. On the supply side the hesitation could have to do with the still limited presence of transactive services above all among the local authorities, because they are more complex, although, as can be seen later on, this is less common in the North East. The lack of availablity of data on a regional level means we are unable to examine the differences between the various regions, which are often important, as we have already seen. (Table 9.11)
 The provision of services in the municipalities The provision of services in the municipalities
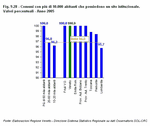
On the part of the supply, according to the report on innovation in the regions which analysed the conditions of the municipalities' online services for citizens and businesses, it can be understood that among the municipalities with more than 10,000 inhabitants, the presence of a website is by now well-established. Furthermore, the model of the so-called "shop window website", which was characterised by static information about the administration and about procedures is now outmoded, in favour of the citizen's need to access services, such as the distribution of forms, which constitutes the main type of service. In 2005 more than 90% of the municipalities with over 10,000 inhabitants provided services of this type in all the regions compared.
When the performance of the more interactive services is considered (Note 12), a clear improvement can be seen in municipalities of over 60,000 inhabitants. (Figure 9.28)
The larger bodies manage to face higher costs, while the smaller ones, due to their facilitated contact with the citizens and lower demand, are less inclined to adopt systems of remote interaction. The dimensions of the municipalities have an influence on the average regional result, and it is generally the municipalities in the north which provide services at a more interactive level. In the comparison between the regions it can be seen, however, that Lombardia and Veneto are the ones in which there is a lower percentage of municipalities of over 10,000 inhabitants that provide at least one interactive and transactive online service than in the other regions. But even where the regions are more active in this respect, the interactive services provided are few, so the data represents more or less isolated cases. For example, in Emilia Romagna, which has one of the highest percentages of municipalities with at least one transactive service, these are not more than two. (Table 9.12)
The new European strategy for the Information Society will provide new nourishment for the central public administration bodies' projects and especially for the local PA's ones which, as they represent the front-end of the PA, are the first to have to embark on this path towards the improvement of public services outlined in the new eEurope plan. Italy, as can be seen from the European benchmarking (Note 13), has improved its position in the European ranking of PA's online services, moving from the 12th place it held in 2001, to 8th place in 2004, with a percentage of services provided online, out of the 20 monitored at a European level, of 53%, this is more than the EU15 average of 46%.
 Tecnological resources in the local PA Tecnological resources in the local PA
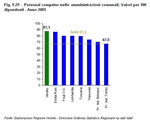
As for the IT facilities, as can be seen from the data based on the experimental investigation carried out by Istat on information and communication technologies in the Italian municipalities for the years 2004-2005, the Veneto's local public administration, with 87.3 employees out of 100 having a personal computer, has more facilities available than the other regions. Among the regions compared only the two autonomous provinces of Trentino Alto Adige are close to the national average of 67.4%. (Figure 9.29)
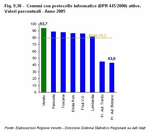
Among other things, Veneto is the region which has the highest percentage of municipalities with an active computerised registry, namely 93.7%. This system was introduced by the DPR [presidential decree; note of the translator] 445/2000 which has greatly simplified most of the administrative management. Along with the management of documentation, the innovation of the obsolete guidelines mainly in the accounting-administrative area and the introduction of solutions aimed at the Controllo Direzionale Sanitario nelle Regioni constituted most of the spending on IT by the local public administrations in 2005. (Figure 9.30)
All in all, a parallel development on the one hand in the users, citizens and businesses' level of culture and flexibility and in their ajustment to the evolution and innovative processes of the PA, and on the other hand in a public system ready to cater to needs and rationalising its organisational systems, traces a path towards the setting up of more fluid relationships between the public administration and its direct users. These need to be built up by varying the supply and eliminating the rigidity which up to now has given rise to negative evaluations of the public offices and their personnel.
 The perception of the problem of the public debt The perception of the problem of the public debt
The simplification of procedures, the user's satisfaction, the rationalisation of the ever decreasing financial resources are the public administration's most important aims. Therefore, measuring the efficiency and effectiveness of public action is extremely important to guide the managerial and organisational choices with the aim of improving territorial competitiveness and, as has already been mentioned more than once in this chapter, to best face the urgent external challenges.
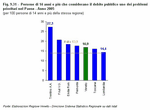
Out of the problems considered as priorities for the country, the public debt is really considered as such by only 14% of Italians, but if we look at the opinions of those who live in Central and Northern Italy, this percentage rises almost to 19% as we reach the North-East. Out of the regions we put under scrutiny, it seems that the people of Lombardia are least interested in this problem (14.4%), the people of Tuscany are a little more worried about it, followed by the people of the Veneto, 15% of whom consider the problem of the public debt to be a priority for the country. There is therefore a higher awareness among the population of these regions of the impact that this aspect of political life has on the citizens. This is felt even more by the inhabitants of the two regions with special autonomous status in certain political matters, above all in Trentino Alto Adige, due to the effect of its different relationship with the central government. (Figure 9.31)
Aside from the differences in opinion, the principles of efficiency and effectiveness need to be given maximum priority in the carrying out of administrative activities, providing the citizens-users with services which match the demand in terms of quality and quantity. All of this within the context of relationships which must be characterised by helpfulness and correctness and respect for the rights of everyone.
 Back Back
Notes
- As Local Authorities we consider the public territorial bodies whose authority extends to a part of the economic territory (Autonomous Regions and Provinces, chambers of commerce, local health authories, hospitals, Provinces, Municipalities, Mountain Authorities, universities, other local bodies); as Central Governments we consider all of the administrative bodies of the state and the other central bodies whose authority extends over the whole of the economic territory, along with the Departments of Welfare and Social Security; the sub-sector of sub-central administrations can be defined as all of the institutional units which carry out some of the administrative duties at a lower level than the central governments and a higher level than the institutional administrative units which exist at a local level.
- Public administration's method for consolidated accounts.
- We consider as federal states: Italy, Austria, Belgium, Germany and Spain. While as unitary states: Denmark, Finland, Greece, Holland, Portugal, the United Kingdom, Sweden and France - for France there are still no indications about the implementation of the constitutional reform.
- The 'Territorial Public Accounts' database (Minstry of Finance and Economics - DPS [the Department for Development Policies]) has been created to reconstruct all the spending and income movements at a regional level, for all the bodies belonging to the public administration and the enlarged public sector, with the objective of achieving consolidated accounts for each Italian region.
The total consolidated spending by the public administration alone, reported in chapter 8, is slightly lower than the total analysed here, resulting from the sum of the central governments and the local authorities' spending. This difference can be explained by the different consolidation process: in this chapter, in the original datum the enlarged public sector's spending is considered as internal to the system and therefore the entry on capital transfers to public businesses is not considered.
- The regular administrative investments of the authorities, including spending on institutional bodies, the management and conservation of property, the purchase of goods for the functioning of the structures, registry services. To this must be added the capital transfers to the businesses involved in the 'programmazione negoziata' [development project based on the collaboration of public and private institutions] mananged by the Cassa Depositi e Prestiti [Bank for Deposits and Loans].
- According to the community criteria used to verify the principle of additionality of national spending with respect to community contribution, the European Union required reference to be made, for this verification, to an enlarged public sector demarcated according to the following criteria: substantial membership of the sector which produces services for the public good, formal membership of the public sector, in the sense that a check by the public authorities (either direct or indirect) of the management and/or an intervention in the financing of the structures in question can be made; past obtainment or possible future obtainment of shares of the community structural funds.
- Regions and other territorial bodies
- The total of the personnel in Italy is calculated as the sum of the regional totals, not including some individuals to whom it was impossibile to allocate a region.
- It comprises gross pay for the working personnel, or rather the net pay, the national insurance and welfare contributions paid by the body, fiscal deductions, overtime pay, special payments, travel allowance, severance payments, contributions to pension funds.
- Not including those of fixed capital nature usable in the productive process for a period longer than a year.
- Equals the spending on the purchase of goods and services carried out in the year in question compared to the number of employees working for the PA.
- First level - forms that can be downloaded and filled in; second level - public and confidential interactive information; third level - sending data to activate the process and conclusion of online transactions.
- Assinform Report on information technology, telecommunications and multimedia content
|
| Table 9.1 |
 |
| Table 9.2 |
 |
| Table 9.3 |
 |
| Figure 9.1 |
 |
| Figure 9.2 |
 |
| Figure 9.3 |
 |
| Figure 9.4 |
 |
| Figure 9.5 |
 |
| Table 9.4 |
 |
| Table 9.5 |
 |
| Figure 9.6 |
 |
| Figure 9.7 |
 |
| Figure 9.8 |
 |
| Table 9.6 |
 |
| Figure 9.9 |
 |
| Figure 9.10 |
 |
| Figure 9.11 |
 |
| Figure 9.12 |
 |
| Figure 9.13 |
 |
| Table 9.7 |
 |
| Figure 9.14 |
 |
| Table 9.8 |
 |
| Table 9.9 |
 |
| Figure 9.15 |
 |
| Figure 9.16 |
 |
| Figure 9.17 |
 |
| Figure 9.18 |
 |
| Figure 9.19 |
 |
| Figure 9.20 |
 |
| Figure 9.21 |
 |
| Table 9.10 |
 |
| Figure 9.22 |
 |
| Figure 9.23 |
 |
| Figure 9.24 |
 |
| Figure 9.25 |
 |
| Figure 9.26 |
 |
| Figure 9.27 |
 |
| Table 9.11 |
 |
| Figure 9.28 |
 |
| Table 9.12 |
 |
| Figure 9.29 |
 |
| Figure 9.30 |
 |
| Figure 9.31 |
 |
| Chapter 9 in figures |
 |
|


 Index
Index 


