6.2 - Productive, commercial and tourist clusters
 Concentration of productive activity Concentration of productive activity
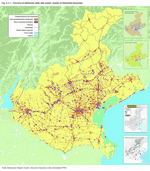
If we take another look at the studies carried out for the Regional Territorial Plan of Coordination (PTRC) the Veneto is described as a region where "productive growth is accompanied by a growth in settlement, creating a high degree of intermixture. 12% of the territory of the Veneto is occupied by urban or small communities where about 92% of the population live. In this, highly fragmented, part of the region there are 95% of the local units, 27% of which operate in the industrial sector and 72% in service sector." (Figure 6.2.1)
As already observed for the distribution of the population, also the location of businesses follows the aforementioned continuous and dense metropolitan model that characterises the central stretch of the territory of the Veneto, with the provincial capitals as its central hubs.
A positive sense of competitiveness can also be found within the territory of the region. The competition between urban environments, areas and districts, is characterised by the ability to retain people through an increase in the demand for labour, through better prospects for socioeconomic advancement and through the opportunity for a better quality of life.
This section explores the phenomenon of local units of production and their employees as well as the commercial, tourism-related, and cultural features that define the territorial competition and attractiveness.
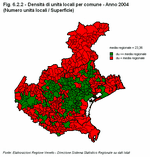
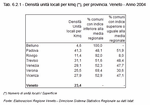
In 2004 the density of local units in the Veneto was 23.4 per km2, greater than the national average of 14.2, with its peak in the province of Padova, 41.3, where 51.9% of the municipalities have a concentration greater than the regional average. Treviso, Vicenza, Verona and Venezia are also above the average, whilst Rovigo and Belluno are below it. On the territory of the latter province, which is nearly entirely mountainous, there are 4.6 local units per km2 (Figure 6.2.2) and (Table 6.2.1).
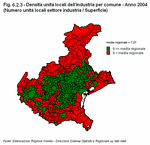
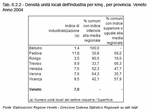
Looking at the regional density of industrial local units, the concentration of manufacturing facilities around the Verona - Padova -Treviso axis becomes clear, where the value of the index is greater than the regional average, which lies at 7 industrial local units per km2. The provinces with the highest densities are Padova, 11.8 km2, and Vicenza, 9.5. The municipalities of the Veneto are quite uniformly distributed in respect to the regional average, except the industrial concentration in the province of Treviso, which, whilst not having an excessively high index (9.9), 66% of its municipalities have an index of industrialization greater than the regional average (Figure 6.2.3) and (Table 6.2.2).
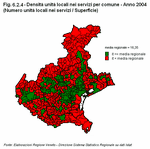
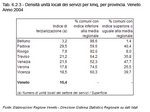
The regional density of local units in the service sector is on average 16.4 establishments per km2, but 70% of the municipalities have a value that lies below the regional level. Indeed the concentration around the provincial capitals is marked. The provinces with the highest levels are, in order, Padova, Venezia, Treviso, Vicenza and Verona (Figure 6.2.4) and (Table 6.2.3).
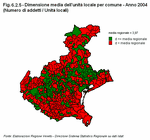
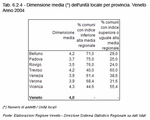
In terms of territory, the small size of the local units, which count an average of 4 employees, brings out several interesting facts: Belluno, for example, which has the lowest density of local units, is the province, together with Vicenza, with the highest concentration of medium-sized enterprises, which is due in particular to the presence of important firms in the fields of eyewear and tourism. On the other hand, the local units of Padova have an average size of 3.7 employees, which demonstrates the plethora of micro-enterprises (Figure 6.2.5) and (Table 6.2.4).
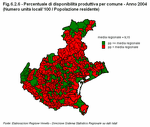
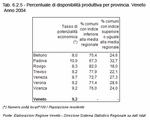
Finally, productive potential is considered. The index of productive potential is the percentage of local units in relation to the population in the municipality, and indicated the economic potential of the municipality. On average in Veneto, there are 9.2 local units per 100 inhabitants, but 74% of the municipalities are below the average. The greatest potential is found in Padova, with a value of 10, the lowest is in Belluno with 8. Generally, the various tourist areas stick out: the mountain municipalities of the province of Belluno, the high plain of Asiago, Lake Garda, and the seaside municipalities of the provinces of Venezia and Rovigo have a modest population, but they have a considerable number of tourist establishments and their related personnel. (Figure 6.2.6) and (Table 6.2.5)
The productive activity index, given by the percentage of employees in local units in relation to the population of the municipality, represents the real density of firms in relation to the size of the municipality. In Veneto, there are 36.3 employees per 100 inhabitants, a value exceeded greatly in the province of Vicenza, 39.4, where 41.3% of the municipalities showed values above the average, and by Treviso, 38, where 47.4% exceed the average value.
 Commercial clusters Commercial clusters
The retail and wholesale sector, which combines numerous aspects related to the development of firms, the economy and the society, is undoubtedly strategic for the economy of Veneto. For the development of this sector it is fundamental that the distributive network is able to adjust to continual changes both in the demographic structure and the buying habits of citizens.
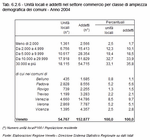
Its structural configuration shows a certain fragmentation in sales facilities: in 2004 the retail distribution network of Veneto was comprised of 54,767 local units. Most of them are located in the province of Venezia, which hosts more than a fifth of the establishments of the region. The number of local units was slightly inferior in the provinces of Padova and Verona, respectively 19.7% and 17.2% of the total, and in the provinces of Vicenza and Treviso, which host about 15% of the local units. About 5% was the percentage of retailers in the provinces of Belluno and Rovigo.
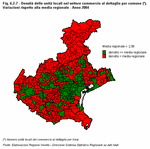
The density of local retail units, which gives an idea of the retailing services available within the territory, shows how the values of the provincial capitals and the surrounding municipalities are higher than the regional average, which is a little less than 3 establishments per square kilometre, while in the entire mountain area and in the South-East the density is lower. (Figure 6.2.7)
The distribution of establishments is strictly linked to the demand of consumers. Therefore it is important to evaluate the number of consumers, which is made up not only of the resident population but also of the number of tourists who come to the Veneto, which is at times extremely significant.
Only 15% of the shops of the Veneto are located in the 320 municipalities with less than 5,000 inhabitants while 33% are in the 15 with more than 30,000. The concentration in the largest municipalities is clear-cut: more than a quarter of the retail establishments in the Veneto are located in the seven provincial capitals, with a range that varies from nearly 9% in Venezia to 0.8% in Belluno. In terms of employment, the workers in the sector are distributed over the territory in a similar manner to that of the local units. (Table 6.2.6)
Large-scale distribution
In recent years in Veneto, as in Italy and in the rest of Europe, large-scale distribution has become the preferred channel for retail trade. Consumers ever more often choose to go to department stores, superstores and supermarkets, rather than to small neighbourhood shops, even though a considerable part of the population is particularly fond of them, especially the elderly, who choose them for their greater trustworthiness and ease of access.
In 2005 there were 1,148 establishments of large-scale distribution in the Veneto (Note 1), an increase of 5.7% on the previous year, with an average sales floor space of more than 1,200 m2.
The department stores, establishments for the sale of non-food products, rose to 80 units, 9 more than in 2004 (+12.7%), sign of a distinct recovery after a period of difficulty in recent years that witnessed a drop of 10% between 2001 and 2004.
Also supermarkets, establishments operating mainly in the food sector, have increased between 2004 and 2005, surpassing one thousand units for an increase of 5.3%.
For superstores, establishments that have features of both supermarkets and department stores, there were 2 more in 2005 than the preceding year to reach a total of 50.
Taking a look at the territorial distribution, it turns out that there is a large concentration of establishments in the province of Verona, in first place for the number of supermarkets and superstores and second in the number of department stores, followed by the province of Treviso. The provinces of Padova, Treviso and Vicenza each host about 200 large scale retailers, while the provinces of Rovigo and Belluno are less well-served, in each of which there are about sixty establishments whether department stores, supermarkets and superstores.
Due to the rise in the number of local units in 2005 on the previous year, the total sales surface area also increased by 4.8%: a slightly smaller figure than that recorded for the number of local units.
In particular, it was the increase in the sales surface area of supermarkets, which approached a million m2 (+5.5%) and that of superstores (+5.7%). The sales surface area in department stores declined slightly, however, the trend improved compared to 2003 and 2004.
As far as territory is concerned, there is a tendency to expansion in sales surface area in nearly all the provinces and nearly all kinds of establishments, except for department stores in the provinces of Verona and Vicenza, where there has been a notable reduction.
Comparing these figures to the potential customers base, that is, in relation to the number of inhabitants, the picture changes. Verona continues to be the best served province, with nearly 37 m2 of sales surface area per hundred inhabitants, but in second place ranks Rovigo with more than 34 m2 per hundred inhabitants. Belluno is in an intermediate position (28.9 m2 per 100 inhabitants), while there is less space for the consumers of the provinces of Venezia, Padova and Treviso (respectively 24.8 m2, 26 m2 and 27.9 m2 per 100 inhabitants).
Simultaneously with the growth in the number of establishments and in sales surface area, the number of people employed has increased as well. In 2005, it surpassed 25 thousand employees, with a growth of 3.5% on 2004. It is interesting to note how the increase is most marked, namely 9.2%, in those employed in department stores, the only category in which a decrease in surface area was found.
Overall, one out of five establishments of large-scale distribution are found in the provincial capitals, and in these there are on average 6 employees more per local unit compared to the regional average (respectively 27.8 and 22.1).
The largest sales surface area per capita is found in the municipalities with populations between 10 thousand and 30 thousand inhabitants, each of which enjoy about 0.4 m2, that is 40 m2 per 100 inhabitants. In the smallest municipalities with less than 2 thousand inhabitants, the sales surface area was only 3.7 m2 per 100 residents. (Table 6.2.7)
Minimarkets, smaller establishments which mainly sell food products, cover reduced sales surface area (between 200 and 399 m2) and can thus be established within historic city centres and in places with more difficult territorial characteristics.
In Veneto, these establishments have gone up from 426 in 2004 to 476 in 2005, an increase of 11.7%. At the same time the sales surface area and the number of employees have also increased by about 11%, rising to 143,835 m2 and 2,482 employees respectively.
On the provincial level, however, in contrast with this growth, a decline was found in the provinces of Venezia and Vicenza, both in the number of establishments (2.4% and 1.3% respectively) and that of sales surface area (3.2% and 0.5% respectively).
The territorial distribution reflects the situation already found for the other large-scale distribution facilities: more than half of the minimarkets are found in the provinces of Treviso and Verona, which possess more than one hundred local units. In particular in Verona minimarkets have increased by about a third, going up from 88 to 116 between 2004 and 2005, recording the largest change and the highest absolute value in the region.
On the other hand, the number of establishments is less than one hundred in the other provinces of the Veneto. The highest totals are in those of Vicenza and Padova, with about 80 local units, and the lowest in those of Belluno and Rovigo where less than 30 minimarkets were found.
Analogously, in 2005 the sales surface area was greater in the provinces of Verona (+30% on 2004) and of Treviso, both amounting to more than 33 thousand m2, while there is less than 10 thousand m2 of sales surface area in the less well-served provinces.
In relation to population, on the regional level there are about 3 m2 per 100 inhabitants on average, nearly 4 in the provinces of Verona and Treviso. The lowest value in this case was found in Venezia, while Belluno and Rovigo were found to be in line with or even better than the regional average.
The employees, a bit less than 2,500, were distributed over the territory following the distribution of the number of establishments; the number of employees is slightly higher in relation to the number of establishments in the province of Venezia (7.7 employees per local unit as opposed to the regional average of 5.2).
Finally, more than a quarter of the establishments were found in the provincial capitals, where the sales surface area per inhabitant (3.6) and the number of employees per local unit (6) is higher than the regional average.
Overall, however, it is the municipalities with a population between 2 thousand and 5 thousand inhabitants who enjoy the greatest sales surface areas per capita with more 4 m2 per 100 inhabitants.
It should be noted that up to the present there has been very limited information available on the number of small retail establishments, even if the preceding analysis of minimarkets (establishments that by operational practices belong to large-scale distribution, although by their size and location within the urban areas they would quite similar to neighbourhood stores) allows us to make a few comments on the structural nature of neighbourhood stores in the food sector. (Table 6.2.8)
Comparing the Veneto with other regions it turned out that in 2005 the Veneto had nearly half establishments and the sales surface area of large-scale distribution (department stores, superstores and supermarkets) of the North-East, respectively 45.7% and 47.3%.
In Italy, more than one establishment and one employee out of 10 are found in the Veneto. It places second among the Italian regions both for the number of local units and sales surface area, preceded only by Lombardia.
Furthermore, there has been a trend towards growth throughout Italy, the Veneto as well as in smaller geographic divisions, with the increase more marked in the South and in the Islands.
In particular, a recovery of department stores after several years of difficulty can be noted, with a more decided growth in the Veneto than on the national level. In Italy the changes related to department stores are less significant. But in addition to the increase in the number of establishments which had already begun in 2004, in 2005 there was also a recovery in the sales surface area. On the national level, however, the number of employees of department stores fell (-0.2%), but with a tendency of improvement on the preceding two-year period that saw a decrease of 2.4%.
Moreover, the positive trend continues from every point of view for supermarkets and superstores, even if the latter have registered a more rapid growth on the national level than on the regional level, especially thanks to the marked development of this category in the South and the Islands.
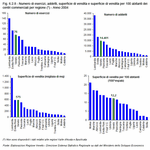
In relation to population, on the national level the median sales surface area of large-scale distibution (excluding minimarkets) is about 20 m2 per 100 inhabitants, nearly 10 m2 less than the figure for the Veneto.
Both in Italy and the Veneto region, it is the supermarkets that have the greatest sales surface area in relation to the population: in Italy there are 12 m2 per 100 inhabitants, whilst in the Veneto, second or the size of establishments, it is nearly 20 sq m.
In relation to department stores and superstores, the Veneto possesses an average sales surface area per capita superior to the Italian average, which is lowered, in particular, by the regions of the South and Islands.
As for the rest of large-scale distribution, the minimarkets of the region made up more than 10% of those in Italy and more than 40% of those in the North-East in 2005.
The growth rate, however, was found to be slightly more moderate in respect to the average of the North-East and half that of Italy. In respect to 2004 the minimarkets have seen an increase on the national level greater than 20% for all the indicators considered, compared to the 11% recorded in the Veneto. The growth on the national level can be attributed in particular to the leading role played by the regions of the South and the Islands, whose variations were about twice the national average.
In relation to the population in the Veneto, there are 3m2 of sales surface area per inhabitant, a figure greater than the national average (2.3 sq m per 100 inhabitants) and in line with the average area in the North-East. (Figure 6.2.8)
In addition to the individual sales facilities of large-scale distribution, such as department stores, superstores, supermarkets and minimarkets, our attention should also be given to shopping centres, i.e. complexes of several establishments that utilise shared spaces and services and thus allow consumers to find in one place a set of products that range from food, through house wares and clothing, to personal care products, so avoiding the inconvenience of having to go to various parts of the city to do their shopping.
In recent years this kind of establishment has experienced rapid development both in Italy and in the Veneto. In 2004 (Note 2) there were 679 shopping centres throughout Italy, 12.6% more compared to two years before. In the Veneto, there were 76 shopping centres, 8.6% more in respect to 2002, which ranked it in third place among the regions for the number of establishments.
Between 2002 and 2004, sales surface area has also increased, with a more marked change on the national level than in Veneto. The median size of shopping centres of our region is found to be slightly less than the Italian average (respectively 12,445 m2 and 12,782 m2), but more than 800 m2 above the average size of shopping centres of the North East.
In terms of population, however, in Veneto the sales surface area was found to be 5 m2 more than the national average, respectively about 20 m2 and 15 m2 per 100 inhabitants.
Finally, in the Veneto region the number of employees have gone up from 11,967 to 12,241, an increase of 2.3%, compared to a growth of almost 10% on the national level.
New tendencies for the competitiveness of the sector
In recent years, both in Italy and in the Veneto, the retail distribution network has been gradually transformed, with the spread of an ever greater number of large-scale retailers and shopping centres.
In the coming years further evolution in the trade sector is foreseen, in number as well as in size. Even if this growth will be most marked in the South of Italy, it will not overlook the North and, in particular, the Veneto.
One probable development is the spread of shopping parks, i.e. rather large areas outside urban areas that bring together distribution facilities that need large exposition space.
In particular, new facilities will continue to appear along the main arteries of transportation, in Veneto, for example, near the Mestre bypass, but they could also be used to enhance the value of less frequented locations, such as the area of Rovigo, or to boost historical city centres. Furthermore, the new facilities of large-scale distribution could be one factor in the reactivation of abandoned industrial areas.
In recent years, however, a new kind of trade has emerged: the "natural shopping centre" or a system of several retailers, artisans and services, including cultural services, located within urban areas and historic city centres and coordinated with the principle objective of enhancing and promoting the urban context to attract consumers who would otherwise be headed for the extra-urban retail areas.
Within this framework, there is the new bill on retail planning for the region of Veneto, intended to simplify existing law with the objective to favour the modernisation and opening of the Veneto market, whilst remembering the different retailing roles of specific areas, without overlooking the needs of environmental protection, of urban centres and of traffic related problems.
The new trends, however, do not only concern the size of the retail establishments, but touch on other features such as the diversification of goods, certification and respect for environmental and social values.
From the point of view of diversification, indeed, it is easy to see how the kinds of products that are found within the stores of the large-scale distribution are ever more numerous. One example can be seen in availability of over-the-counter medicine that in 2006 appeared on supermarket and superstore shelves at more convenient prices than those available in chemists.
Furthermore, ever more retail chains combine retailing with production, which allows them to offer their own items, whose prices are normally lower than those of other brands.
Another evolving feature is that of certification, which represents a key factor in attempts to capture a new segment of consumers. Such certification proves that the facilities, processes and practices of the large-scale retailer respect quality and sustainable standards. Some examples of certification concern the quality of internal management, energy savings and the production of goods according to principles of social responsibility and respect for human rights.
A testimonial of this concern for environment and social questions is the growing offer of biological products, of detergents that are environmentally friendly and of products with recycled packaging on supermarket shelves. Another tendency involves retail facilities with solar panels to save energy and initiatives that allow consumers, by collecting points through their purchases, to make an economic contribution to various humanitarian organisations as their expression of solidarity.
The new orientation of retailers, therefore, is that of attempting to increase sales not only through pricing policies, but also through products that are ever more diverse, of higher quality and that are thus able to satisfy the preferences of consumers of various age groups, levels of instruction and social classes.
 Tourism Tourism
To get an overview of the productive structure that allows the Veneto to satisfy the demand for services generated by the region's considerable inflow of tourists, it is indispensable to understand the quantity and territorial distribution of the productive units of the tourist sector. In 2004 about 26,367 local units were identified, this refers to the general economic category of "hotels and restaurants" and forms a good estimate of the establishments that make up the tourist sector.
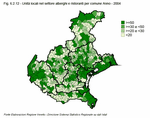
The Veneto ranks second with 9.1% of Italian local units in the sector, after Lombardia which looms above all the other regions with 15%. In terms of the density with which they are distributed over the national territory, our region comes in fifth with 1.4 establishments per km2, surpassing the Italian median that is equal to one. (Figure 6.2.9)
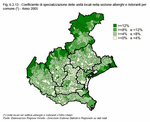
The specialisation in the tourism sector in the Veneto is very similar to the national average: 6.1 local units in the hotel and restaurant sector per 100 establishments versus 6.2 in Italy as a whole.
Considering the provincial details, the provinces of Venezia and Verona are first in terms of the number of local units with shares of 25% and 20% respectively of the regional total. However, from the point of view of the specialisation of the establishments on the territory it turns out that Belluno registers 11.6 local units of the sector per 100 local units in general and Venezia 9% (Figure 6.2.10) and (Figure 6.2.11).
Among the seaside municipalities, Jesolo should be underlined both for the high number of local units in the hotel and restaurant category (924) and for its high level of specialisation, with 24.9% of the total. The most touristic seaside town is Caorle with its very high specialisation index amounting to 25.9%.
Malcesine stands out among the numerous municipalities of Lake Garda, both for the number of its local units (243) and for its considerable specialisation (38.9%).
Among the municipalities specialising in spas, Abano and Montegrotto (with 219 and 133 local units respectively) stand out, while for mountain communities, first place goes to Belluno (208) followed by Cortina (181), Feltre (139) and Asiago (100).
Finally, among the historical cities of the Vento, as could easily be predicted, Venezia dominates (2,411), followed at a distance by Verona (1,408) and Padova (1,182) (Figure 6.2.12) and (Figure 6.2.13).
 Back Back
Notes
- In the following analyses, large-scale distribution refers to department stores, superstores and supermarkets. Minimarkets, establishments that by definition belong to large-scale distribution because of their operating procedures characterised by self-service and payment at a cash register, here are treated separately. The reduced size of sales surface area of the minimarkets (between 200 and 399 sq m) make them different from the other establishments of large-scale distribution. Moreover they are also found in historical city centres or in areas with a more difficult territorial profile, and are thus more similar to establishments of small- or medium-scale retailers.
- Latest available data
|
| Figure 6.2.1 |
 |
| Figure 6.2.2 |
 |
| Table 6.2.1 |
 |
| Figure 6.2.3 |
 |
| Table 6.2.2 |
 |
| Figure 6.2.4 |
 |
| Table 6.2.3 |
 |
| Figure 6.2.5 |
 |
| Table 6.2.4 |
 |
| Figure 6.2.6 |
 |
| Table 6.2.5 |
 |
| Figure 6.2.7 |
 |
| Table 6.2.6 |
 |
| Table 6.2.7 |
 |
| Table 6.2.8 |
 |
| Figure 6.2.8 |
 |
| Figure 6.2.9 |
 |
| Figure 6.2.10 |
 |
| Figure 6.2.11 |
 |
| Figure 6.2.12 |
 |
| Figure 6.2.13 |
 |
|


 Index
Index 


