3.1 - Innovation in the Veneto
Developing innovation is the key to ensuring a lasting position as an important player in the advanced sectors of the international scene of the future. In the past, Italy, and therefore also the Veneto, were competitive due to low manual labour costs and later due to favourable exchange rates. Nowadays, however, without these two advantages, innovation is the only factor able to keep the economy afloat in the international globalisation process.
The growth and competitiveness of businesses in both the industrial and service sectors depend on the ability to adapt to changes quickly and to make use of the potential of innovation. It is crucial to develop know-how which can be applied to modernising and broadening the range of company products and services, along with creating new trade strategies and introducing new methods and procedures in business organisation and management, and in the production, supply and distribution of goods. There are several types of innovation which may be carried out within a company. These range from typical product or process innovation based on work in laboratories and advanced technical skills to architectural innovation which makes innovative use of already available technologies and components in order to create new products and processes. Further types include custom innovation in order to continuously improve products and processes, market innovation which creates new or latent demand, and marketing, organisational, stylistic innovation etc.
This represents a challenge which must be tackled by all businesses regardless of their size, although the task is more difficult for smaller companies.
 R&D R&D
Literature on business and economics generally recognises the crucial role of investments in research and development (R&D). There is substantial proof that productivity increases proportionally to higher expenditure on R&D.
The Lisbon objective of having the industrial sector finance two thirds of R&D expenses has already been achieved in some northern European countries. The EU15 have almost attained it, and the EU25 are close to doing so.
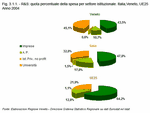
In Italy, businesses account for almost half of the R&D expenditure, roughly one third of the investments are made by universities, 17.8% come from the public administration sector and the remaining very small percentage from private non-profit institutions. In the Veneto, R&D expenditure is practically evenly distributed amongst the business community and the universities, accounting for 43.5% and 45.1% respectively.
Expenditure has risen in all sectors over the medium-term past. From 2000 to 2004, the overall increase amounted to 22.4% for Italy and to 47.3% for the Veneto. Investment activities in this area were considerable in all sectors in the Veneto, however, the sharp rise of 63.4% in university expenses deserves particular notice. The business trend in 2003/2004 was varied. With an increase of 6.7% in public administration spending in the Veneto and of 2.9% in university spending, R&D investments made by the businesses went down by 3.1% (Figure 3.1.1).
This slump in company investments is also reflected by the number of members of staff committed to R&D. In 2004, businesses cut the employment of human resources in this area by 0.9 %, which is more than in Italy as a whole (-0.6%).
The overall expenditure on R&D for every employee involved in this field amounts to 88,116 Euros in the Veneto, 92,983 Euros in Italy and 95,104 Euros in the EU25.
The number of employees in research went up by 2.9% in the Veneto in 2004, compared to the national increase of 1.4%. However, this equals only 2 employees in research per 1,000 inhabitants in the Veneto which is less than half of the European average (4.4) and almost one employee less than in Italy overall (2.8). Efforts to promote this area of employment are mainly made by the public administration sector which raised its figures of employees in research by 21.2% in the past year. This is clearly above the average national increase of 3.9%. However, the universities have also contributed to this development (+1.5%) (Figure 3.1.2) and (Figure 3.1.3).
Nonetheless, the current situation is marked by a slowing down in R&D expenditure growth as a percentage of GDP. Europe is still far from attaining the objective laid down in Lisbon in 2000 which schedules a percentage of expenditure of 3% of the GDP for 2010. Similarly far away is the aim of 2.5% set for Italy.
In 2004, the EU25 achieved a share of GDP of 1.85% which roughly corresponded to the Eurozone's share of 1.86%, but was lower than the 1.91% in the former EU15. This indicates that the latest accessions have made this objective a slightly more distant prospect for the EU.
However, the situation in the individual countries differs. Countries like Sweden and Finland already exceeded the objective in 2001, while other countries still dedicate a more moderate share of their GDP to R&D, Italy is among these with 1.1%. In the past four years, investments of this type have grown in the Veneto. Expenditure went up by 47%, and the ratio of expenditure to GDP by 26%, but nonetheless the European target is far from being met (Table 3.1.1) and (Figure 3.1.4).
Italy may have increased its expenditure (+3.3%) in 2004 more dramatically than the EU as a whole (+2.9%), but in order to attain the Lisbon target in the six years to come, the country should have an annual increase of the ratio of expenditure to GDP of more than 20% compared to the 2004 ratio. In the Veneto, the 2004 share of 0.64% of GDP invested in R&D is still modest. In absolute terms, expenditure had slowed down in the last year under consideration, + 0.4%, with respect to the brisker development of the early years of 2000.
 Trends of Innovation in Europe, Italy and the Veneto Trends of Innovation in Europe, Italy and the Veneto
The European Parliament and the Council of the European Union have proposed a framework programme for innovation and competitiveness for the period of 2007 - 2013. The programme aims to improve the competitiveness and innovation capacity in the European Union and to encourage the development of a knowledge society and sustainable development in the pursuit of the objectives of the renewed Lisbon strategy. It will promote actions for increased competitiveness and innovation capacity within the European Union.
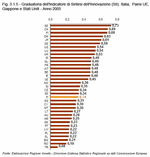
In 2000 the Commission already began to apply various instruments of analysis in order to monitor the progress in the individual areas towards increased competitiveness through innovation. One of these instruments is the European Innovation Scoreboard EIS which issues the Summary Innovation Index SII, indicating the national innovation performances, and the Revealed Regional Summary Innovation Index RRSII, an indicator which considers the innovation performance of a region with relation to both the EU average and the country it is part of in an integrated manner (Figure 3.1.5).
The European Innovation Scoreboard 2006 confirms the weakness of the EU in terms of innovation compared to its main competitors, the United States and Japan, but also highlights the faster progress of the EU compared to these countries. As regards the individual countries, the EIS 2006 confirms that the global leaders are members of the European Union; the small economies of Northern Europe, i.e. Sweden, Finland and Denmark, and Switzerland. The most innovative of the larger economies is the United Kingdom. Italy's indicator of 0.34 reflects a general performance lag compared to the European mean value of 0.45 and its lack of development in the period of 2001 - 2005 ( -0.9%).
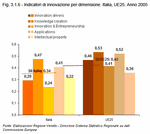
The reason for Italy's lag can be identified through the analysis of the data sets used to draw up the EIS which are classified into 5 dimensions: "Innovation drivers" measure the structural and educational conditions required for a certain potential of innovation; "Knowledge creation" measures the investments in R&D activities; "Innovation & entrepreneurship" measures the degree of innovation at a company level; "Applications" measures the performance expressed in terms of labour and business activities and value added in high-tech sectors; "Intellectual property" measures the achieved results in terms of successful know-how.
Italy shows a low value for the "Innovation drivers" due to low indicators of tertiary and continued education (life-long learning) and the scarce availability of science and engineering graduates. Italy is also doing badly in "Innovation and entrepreneurship", as the indicators of innovation oriented co-operation between SMEs, availability of venture capital and also of ICT investments are low (Figure 3.1.6).
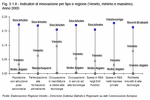
In this context, examination of the Revealed Regional Summary Innovation Index RRSII shows that the Veneto is in a comparable situation to that of Italy. The Veneto ranks 122nd out of the 203 regions under scrutiny, achieving an RRSII of 0.40 in 2005 which is close to the average value of 0.43. The variation of this figure compared to 2002 is not significant as changes were minimal and the values were always around the average.
The RRSII is the summary of the following five indicators: share of population with post-secondary education, participation in life-long learning, employment in medium-high and high-tech manufacturing, employment in high-tech services, public R&D expenditures, business R&D expenditures, number of high-tech patent applications.
Analysis shows the Veneto's lower-than-average level of education. Despite a good level of employment in medium-high and high-tech manufacturing businesses, investment in research from both public and private sectors is poor (Figure 3.1.7) and (Figure 3.1.8).
The pursuit of the European objective and the analysis of current trends point out ever more clearly that Italy and the Veneto must become key players in the knowledge society, abandoning the no longer sustainable model of "development without research" and fully committing themselves to the only viable model in the era of a globalised economy, that of "research-based development". This aim requires a strategy supported by all stakeholders. It must be implemented via synergies between local networks of small firms, universities and research centres according to modalities field-tested in the past years, aiming towards the natural development of a virtuous circle of general growth, productivity and competitiveness of businesses, and giving further impetus to innovation activities already under way.
 The innovation gap: the business dimension The innovation gap: the business dimension
Literature on business and economics (Note 1) often justifies the Italian lag in innovation at a business level by the special features of Italy's productive system, pointing at the modest sizes of firms in particular. The so-called "industrial dwarfism" is ever less able to provide a fertile terrain for R&D activities and innovation, to secure Italy's exports and market shares and finally to promote suitable conditions for competitiveness (Table 3.1.2)
The Veneto can not be spared this kind of criticism either. The most recent data available, from 2004, states that the average company consisted of little more than 4 employees and that micro-enterprises accounted for 93.7% of all businesses. In most cases, micro-enterprises are ill suited for research. Besides the widespread belief that carrying out research would have no short-term positive impact on their profits, they do not dispose of the means to do so, their connections to the academic world are poor and bank financing might be difficult to obtain.
Also the small and medium-sized enterprises, representing 6.2 % of the Veneto's total, are strongly oriented towards cost-containment and show little interest in investments which might not yield results and or render delayed economic returns. However, they are often "forced" to invest in research to face competition from emerging markets. SMEs in Italy and the Veneto can not count on the low-cost argument to compete in the markets. Therefore, they must focus on research and most importantly also on process innovation, as opposed to large enterprises which have the means for product innovation too.
 Structural renewal Structural renewal
The type of the entrepreneurial landscape of the Veneto as regards the legal forms of businesses has undergone changes in the past years, with an increase in the proportion of corporations. This represents a long-term trend reflecting the need to establish more robust enterprises, to manage networks and productive chains, to dispose of and raise more resources to invest in research and human capital and to innovate and develop new products.
Businesses in the Veneto, particularly those of small and medium size which generate the biggest share of socio-economic wealth in terms of turnover and secure jobs in the region, need a more solid financial foundation. In 2006, corporations in the Veneto grew by 5.5% compared to the previous year. In line with the national average, the number of partnerships showed a slighter increase (+0.6%). On the other hand, figures for individual enterprises show a slight decline (-0.6%). However, this latter type of business remains the most widespread of the region, accounting for more than 60% of all active businesses in the Veneto (Figure 3.1.9) and (Figure 3.1.10).
Analysis of development over the past five years shows an increase in corporations of almost 24 percentage points, against the +2.3% registered for the total of active companies in the region. The main driving forces for this growth in corporations were the sectors of "real estate, entrepreneurial and professional services" and construction. In 2006, the annual growth rate of corporations in the construction industry amounted to 10 percentage points, while corporations in the sector of "real estate, entrepreneurial and professional services" increased by 7.8%. The development over the past five years shows an increase of almost 36 percentage points for the former, from 5,655 entities in 2002 to 7,677 entities in 2006, while the figures for the latter have gone up by 41.6% (from 15,817 entities in 2002 to 22,403 entities in 2006).
 Regional solutions Regional solutions
By creating the so-called "production districts", the Veneto has tried to make up for generally small-sized businesses' lack of advantage in terms of scale and to stress the value of the flexibility and socio-economic diversity of SMEs. The L.R. 8/2003, entitled "Disciplina delle aggregazioni di filiera, dei distretti produttivi ed interventi di sviluppo industriale e produttivo locale" [Regional Act 8/2003, regulating sectoral clusters, production districts and interventions for local industry and production development (translator's note)], defines the system of production districts of the Veneto and introduces a comprehensive set of rules for interventions aimed at supporting the production districts. At the same time, it governs the criteria for identifying and the procedures for approving the so-called district development pacts of three-year duration. The Act aims to drive the innovation process for the production sectors by promoting and supporting the development of the regional productive system. 43 districts, comprising 7,840 enterprises with a total of 214,577 employees have been defined. This process of clustering and co-operation could turn these districts into places of innovation and technological progress, of production-capacity transfer and of partnerships which improve the impact of innovation processes on the quality and competitiveness of the regional system. The districts give an example of the fact that development policies need not focus exclusively on the relation between innovation and research. The districts represent a further development of the concept of innovation which leaves behind the linear model, where R&D is the starting point, and proceeds towards a systemic model which develops out of the interaction between enterprises, organisations and their respective operating environments. The ultimate goal is a virtuous circle where scientific research generates innovation which in turn supports growth, leading to continued research work in order to gain new knowledge.
Furthermore, the regional act entitled "Legge quadro per la promozione della ricerca applicata e dell'innovazione a favore del sistema produttivo veneto" [Regional Framework Act for the promotion of applied research and innovation for the benefit of the productive system of the Veneto (translator's note)] was recently approved. It aims at fostering innovation, scientific research, technological development and knowledge transfer between companies to safeguard economic growth.
 Patents Patents
Innovation experts often use patents as an indicator to measure the results of technological competitiveness. However, simply counting patents at company, industry and country levels yields no more than an approximate measure of competitiveness. Literature indicates that no more than 50 percent of all patent-protected inventions actually become innovations or reach the market, that not all inventions are patented and that the potential of generating a significant cluster of innovations varies dramatically from patent to patent. Nonetheless, patents constitute the most important or maybe even the only tool to verify the outcomes of research.
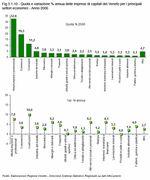
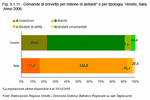
In 2006, 63,962 patent applications were filed in Italy, an increase of 4.8% compared to the previous year. Similarly in the Veneto, which accounts for 9.6% of the nation's total and is the fifth most important region in terms of patents filed, applications went up by 3.9%. In the regional ranking broken down into patent types, the Veneto ranks fourth for trademarks, third for inventions, and second for utility models and design patents. Trademarks, the biggest patent type in the Veneto, saw a decrease in 2006 of 2.5% compared to 2005, inventions grew by 17% and utility models by 5.6%, while design patents more than doubled.
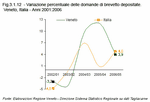
Creative activity in the Veneto was rather high with 1,302 filed patent applications per million inhabitants, compared to 1,089 at national level. The breakdown by province shows Padova as the most inventive area with 31.3% of all patents granted in the Veneto region in 2006, followed by Verona (20%), Treviso (19.8%) and Vicenza (18.6%). Venezia (6.4%), Belluno (2.2%) and Rovigo (1.8%) lag behind somewhat (Figure 3.1.11) and (Figure 3.1.12).
 Technology balance of payments Technology balance of payments
The technology balance of payments TBP is an explicit indicator of the capacity to produce and make use of advanced technology as the subject and source of innovation (Note 2). In 2004, the technology balance of payments for Italy and the Veneto continued to show a deficit, thereby pointing at the continued tendency to import more technology than export it (Table 3.1.3).
The overall BPT in 2005 was negative by 231.64 million Euros in Italy and 123.68 in the Veneto. This deficit is in line with the trend of structural deficit in the past and is slightly higher than in the previous year when it amounted to167.75 million and 64.40 million, respectively.
Just as in past years the overall Italian balance is the result of surpluses recorded in research and development services (301 million) and in services with a technical content (791 million, due to technical and engineering studies for which a surplus of 828 million was registered), which are more than compensated for by deficits in transactions of trademarks, designs and patterns (-521 million) and in other technology payments (-731 million). Trade in techniques shows a slight deficit (-72 million).
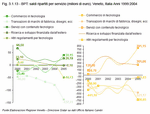
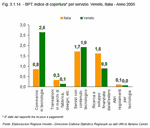
In the Veneto, only trade in techniques and services with a technical content were able produce a positive balance. This tendency is confirmed by the coverage ratio, or ratio between payments and receipts, of the TBP. In the Veneto, this value is of 2.6 for trade in techniques, indicating a sum of receipts which was more than two and a half times higher than payments. Also for the services with a technical content the elevated capacity of imparting knowledge as an investment into future innovations is underpinned by a value of 1.9. This almost seems to contradict the general internal weakness discussed at the beginning of the chapter. As opposed to the previous year, research and development services had a slightly negative effect on this indicator (Figure 3.1.13) and (Figure 3.1.14).
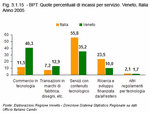
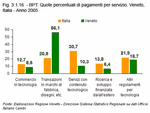
The Veneto's largest demand from abroad is for trade in techniques, which accounts for 40.3% of the receipts, followed by services with a technical content with 35.2%. Vice-versa, the Veneto's main transactions with foreign markets regard trademarks which make up 56.1% of the payments (Figure 3.1.15) and (Figure 3.1.16).
The Veneto accounts for 36% of the total of receipts of the north-east of Italy (Note 3) and for 4.6% of the receipts of all Italy. Also in terms of payments, the Veneto's share in the north-eastern total is considerable (45.6%), while accounting for 7.7% of the nation's total.
The balance broken down by country reveals a general deficit of the Veneto with the European Union, but show rather diverse scenarios for the individual EU countries: while the balance with the Netherlands is negative by more than 25 million Euros, the balance with the United Kingdom is positive by almost 20 million Euros. As regards the non-EU countries, the balance is extremely negative with Switzerland and the United States, whereas it is positive with the emerging markets of Asia and China.
 Back Back
Notes
- ISAE, 'PrioritÓ Nazionali: Dimensioni Aziendali, CompetitivitÓ, Regolamentazione' (ISAE report on the national priorities regarding enterprise dimensions, competitiveness and regulations)
- The TBP registers the flows of receipts and payments of international transactions of disembodied technology in the form of industrial and intellectual property rights such as patents, licences, trademarks, know-how and technical assistance.
According to the scheme proposed by the OECD there are four main components of the TBP:
- trade in techniques: such transactions form the core of international technology transactions and involve the transfers of patents, inventions and know-how as well as the respective rights of exploitation;
- transactions relating to industrial property (trademarks, designs, patterns): they do not refer directly to technological know-how but often imply the transfer of such; these transactions are mainly transfers of trademarks and industrial designs;
- services with a technical content: even if they do not constitute an actual transfer of technology they allow technological potential to be increased through the acquisition of technical skills;
- research and development carried out abroad or financed from abroad.
- Veneto, FriuliVenezia Giulia, Trentino Alto Adige and Emilia Romagna
|
| Figure 3.1.1 |
 |
| Figure 3.1.2 |
 |
| Figure 3.1.3 |
 |
| Table 3.1.1 |
 |
| Figure 3.1.4 |
 |
| Figure 3.1.5 |
 |
| Figure 3.1.6 |
 |
| Figure 3.1.7 |
 |
| Figure 3.1.8 |
 |
| Table 3.1.2 |
 |
| Figure 3.1.9 |
 |
| Figure 3.1.10 |
 |
| Figure 3.1.11 |
 |
| Figure 3.1.12 |
 |
| Table 3.1.3 |
 |
| Figure 3.1.13 |
 |
| Figure 3.1.14 |
 |
| Figure 3.1.15 |
 |
| Figure 3.1.16 |
 |
|


 Index
Index 


