2.1 - Foreign trade
Exports were the most dynamic component in the recovery of the Italian economy in 2006, showing an appreciable increase compared to the previous year. This recovery is attributable to the work of the most active Italian companies, which have undergone complete restructuring and are successfully facing the challenges of increasingly globalised markets.
Provisional data on Italian foreign trade highlight an increase of 9% in current values in the export of goods (+3.8% in constant prices), compared to the previous year, for a total of around €327 billion.
Despite this positive trend, the dynamics of Italian exports are still modest compared to those of total world trade (9% in constant prices), thereby causing a new loss of market shares, even though at a more moderate rate than in the past. The recovery is, therefore, partial compared to the distinct difference between the evolution of Italian exports and the trend of the international cycle for the previous year (-1.4% for the export of Italian goods, whilst world trade rose by +7.4%). (Table 2.1.1)
2006 saw an increase in Italian exports for all the main economic sectors. The main contributors to this growth were the machinery industry (+10.9%), metal products (+23.8%) and vehicles (+8.4%). The positive trend for national exports then, seems to be driven by specialised industries (those with higher than average technology), that are more able to exploit the opportunities offered by the considerable growth in international trade.
Sectors bearing the "Made in Italy" label, though on the rise, do not seem to be increasing at the same rate as the medium high technology sectors. In fact positive contributions to exports are the textile and clothing industry (+3.9%), furniture (+2.5%) and a noteworthy +6.1% for leather goods.
Exports to EU countries have registered an increase of around seven percentage points, due in particular to the recovery in exports to Germany (+8.8%).
The trend for exports to non-EU nations was greater for 2006 (+11.9% in value), thanks to the high demand from Asia, the Middle East (+15%) and Russia (+25.7%).
 Regional foreign trade Regional foreign trade
There has been an increase in exports, in terms of value, for all regions of Italy, with higher than national average growth for the regions of central (+13.4%) and north-east Italy (+9.6%). On the other hand, increases were below the national average in north-west (+8.5%) and southern Italy (+7.1%) and the islands (+6.1%). (Figure 2.1.1)
The regions showing the biggest increases in shares of exported goods compared to the previous year, are the Marche, Friuli Venezia Giulia and Toscana. The only regions with lower shares of exports are Puglia and Liguria.
In 2006, although there was a sustained recovery in exports, the balance for Italy's foreign trade (Note 1) went in the red by €21 billion. This huge trade imbalance is almost entirely attributable to the increase in price of energy products, which made the deficit against non-EU countries surge (-€19 billion). In the same period, then, imports rose by a higher rate than exports (+12.6%) and reached a total of just over €348 billion. The increase in trade has affected all the economic categories and geographical areas, with variations of more than 30 percentage points in northern Africa, due to high oil prices, and in central Asia. Energy products now account for 17.7% of total Italian imports, pushing the cost of energy up to 61 billion.
 Exports from the Veneto Exports from the Veneto
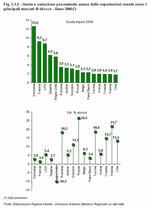
Provisional data for foreign trade for the Veneto in 2006 (Note 2) show an increase in the exports of goods at current prices of 7.8%, for a total of over €43 billion. There was a 2.7% increase in the sale of Veneto products to EU countries, which make up 55% of total Veneto exports, while there was a 14.8% increase in exports to non-EU countries. (Figure 2.1.2)
Within the EU25, there was an increase in Veneto exports to Poland (+21.7%) and Slovenia (+13.4%). Exports to the main European markets were less impressive: +2.8% to Germany and +1.4% to France. Of the non-EU25 states, exports to Russia (+26.5%), Romania (+18.2%) (Note 3), Turkey (+18.6%), China (+13.4%) and some OPEC countries (United Arab Emirates +36.6%) considerably increased. After some years of slump, exports to the USA are also on the rise (+5.4%).
On the other hand, the only significant downward trends in Veneto exports concern the UK and Japan.
 Export sectors Export sectors
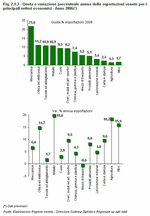
As concerns sectors, electronic and optical equipment (+14.7%), metal products (+19.6%) and the mechanics industry (+6.6%) are at the forefront of Veneto exports. The growth in the export of these goods is particularly noteworthy in emerging markets in which the development of the manufacturing industry has and will be a strong force in the demand for capital goods and intermediate products (goods that are purchased to produce final goods). Veneto export trends for furniture (+7.1%) and gold products (+13.4%) are also high, following an unimpressive 2005. (Figure 2.1.3)
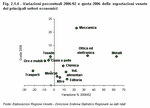
Companies in the clothing industry, after a few years of crisis caused by changes brought about by the explosion of Chinese products in international trade, now seem to see light at the end of the tunnel and have begun a recovery. There has been an increase in the exports of textiles (+1.7% for 2006) and exports for leather products are also on the rise again (+2.9%). Although these increases are below the average rates for the region, they do not take into account the trade flow caused by companies' processes of internationalisation. In fact many businesses in the clothing sector have had to change their relocation trends in order to remain competitive on international markets. This means not only the export of textiles from the Veneto towards eastern Europe, and then the importation of the worked and finished project, but also the export or direct purchase from abroad of primary materials, development and export of the final product from the area of relocation (China and other Asian countries) to another external area. This means huge quantities of exchanges that are considerably higher than what emerges from data on foreign trade. (Figure 2.1.4)
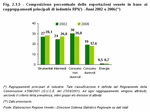
The improvement in trends for Veneto exports in the last five years (+10.1%) has been supported by processes of structural transformation. This has increased in recent years owing to tougher international competition, which has selected the companies that are able to increase the quality of their products. These processes principally favour specialised companies, which have shown that they can keep pace with foreign competitors, in the production of capital and intermediate goods. (Figure 2.1.5)
In fact in the period considered here, the increase in Veneto exports of capital and intermediate goods (Note 4) was 19.5% and the weight of the export of these goods on the region's total increased by around four percentage points (from 50.6% in 2002 to 54.9% in 2006).
On the other hand, the trend for the export of consumer goods was more or less stable (-0.1%). Over the last five years, sectors of excellence in Veneto manufacturing (agro-food, clothing-fashion, furniture-home) have had to face strong competition. The competition from some Asian countries, due to low labour costs, has hit numerous specialised manufacturing sectors in the Veneto. This has led to a substantial change in the share of consumer goods in Veneto exports (from 48.9% in 2002 to 44.4% in 2006).
 Companies involved in foreign trade Companies involved in foreign trade
In 2006 the commercial traders in the Veneto who exported to international markets increased by 2.4%, more than 28,000 in total. An increase has been seen in the weight of larger companies on the total value of regional exports. This confirms the importance of company size in the context of increasingly globalised markets. (Table 2.1.2) and (Table 2.1.3)
In the last three years, companies in the region declaring more than €20 million of exported goods have increased by 28 (from 356 in 2004 to 384 in 2006), and their contribution to the share of exports has risen from 51.7% to 55.1%. On the other hand, the number of smaller companies (exports of less than €5 million) has decreased. Between 2004 and 2006 their number fell by 11.9%. In 2006, these companies, although making up nearly 95% of companies in the region, produced 19.8% of the region's total share of exports (22.6% in 2004).
 Imports to the Veneto Imports to the Veneto
In 2006 the trade balance recorded a profit yet again (€7,728.4 million). This is mainly due to positive balances with north America (+€3,084 million) and the EU (+€3,832 million). In contrast the geographical areas with which there have been trade deficits are east Asia (- €1,525 million) and north Africa (- €674 million). This trade deficit with east Asia is largely (almost 60%) due to negative sales to China in the fashion sector (textiles, clothing, leather goods). (Figure 2.1.6).
In 2006 imports to the Veneto (+10.3%) increased more than exports. Apart from the importation of expensive energy, the increase was due to the purchase of metal products (+21%), clothing (+7.9%), optical and electronic instruments (+8.3%), the tanning and footwear industry (+16.8%) and machinery (+11.3%).
There was an increase in imports from China (+31.9%), which in only a few years has become the second trading partner of the Veneto (with a share of 7.6% of imports in the region), from the Netherlands (+24%), Spain (+15.3%), Switzerland (+22.2%) and Libya (+44.5%).
Despite the low annual growth in imports from Germany (+2.9%), it is still the main supplier of goods to the region, holding a 22% share of total imports.
Among the European countries involved in the relocation of production, imports from Romania (+3.9%), Slovakia (+8.9%), Croatia (+6.5%) and the Czech Republic (+5%) have increased.
 Processing Traffic Processing Traffic
One of the dominant features of the world economy in recent years has been the intensification of international trade. In fact many companies have decentralised part of the production of their goods abroad. Primary or semi-worked materials often leave a region to be developed directly in countries where the cost of production is lower. Once made, they return to their country of origin to be sold on the domestic market or to be exported.
Statistics are available at a European Level concerning the volume of international traffic caused by Processing Traffic (PT), a form of international fragmentation of production. PT is a non-compulsory customs procedure subject to a series of customs and tariff facilities peculiar to the EU and often has a corresponding procedure in other countries. (Table 2.1.4).
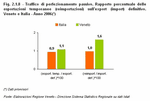
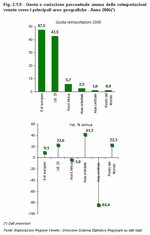
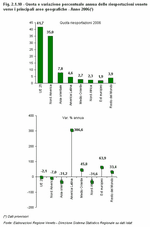
Temporary exports and reimports measure Outward Processing Traffic (OPT), while temporary imports and re-exports determine the quantity of Inward Processing Traffic (IPT). (Figure 2.1.7) and (Figure 2.1.8).
In recent years there has been a partial reduction in trade related to PT, generated mainly by the process of integration with Central and Eastern European countries. In addition, with the increased liberalisation of international trade, and therefore the reduction of customs charges, PT tends to be carried out through apparently final trade, which is less of a burden in bureaucratic terms.
As concerns PT in the Veneto, the value of reimports out of the total final imports for the region (OPT) has fallen from 3.4% to 1.6% between 2002 and 2006, while the share of re-exports out of the total of final exports for the region (IPT) has decreased by 1.3 percentage points (from 3.2% in 2002 to 1.9% in 2006).
The manufacturing industry that has been most affected by the phenomenon of OPT is that of fashion (textiles, clothing, leather products), with a 64.2% share of the total of reimports for the region and a total value of €357 million, which is close to 16% of value added in the region for the industry. The industries that have been most affected by IPT, on the other hand, are the vehicle industry (38.9% of total re-exports), gold and jewellery industry (19.6%) and chemical products (10%). (Figure 2.1.9) and (Figure 2.1.10).
In 2006 90% of OPT flow was concentrated in Europe (Eastern Europe 47.5% and EU25 42.5%), whilst that of IPT was mainly in the EU25 (41.7%) and in North America (35%).
 Foreign trade in the provinces Foreign trade in the provinces
In 2006 all the provinces in the Veneto contributed to the increase, in terms of value, in exports for the region: growth was more intense in the provinces of Belluno, Rovigo,Verona and Padova. Treviso, Venice and Vicenza are at the bottom of the league table for Veneto exports. (Table 2.1.5)
Belluno
In 2006 companies in the province of Belluno exported a total of €2,392 million worth of goods, contributing to 5.5% of exports for the region. The opening up to foreign markets mainly concerned the sale of optical and electronic instruments, corresponding to 68.7% of exports for the province, which registered an annual increase of around 19 percentage points. Positive signs were also seen for machinery (+18.2%), the second industry in the province, and metal products (+49.2%).
Belluno companies increased exports to all their main markets, with peaks of over 20 percentage points in France, Spain and Germany. In the US market, the most important one for Belluno goods, export turnover increased by 16.8%, over €533 million.
Trends were also positive for imports (+37.4%), rising from €619 million in 2005 to over €850 million in 2006. This increase, the most significant at a regional level, can be attributed to optical-electronic companies (+44.3%), metal products (+50.3%) and the mechanics industry (+34.8%), which increased trade with China (+5.9%), long the biggest supply market for local manufacturing industries.
Padova
The data for foreign trade for the province of Padova confirms the positive trend in local exports. The total value of exported goods for 2006 is €6,892 million. Padova's share of total exports for the Veneto is around 16 percentage points, putting the province in fourth place in the region for total value of exported goods.
The three main aggregates of exports in the province show a positive trend. In fact mechanical (+13.4%), electronic (+5.8%) and metal products (+16.1%) have further strengthened their effect on total exports, accounting for 55.8% of exports for the province. Export turnover is also on the rise for "other industries" (gold, furniture and sports products) with an increase of 12.2 percentage points. There was a downward shift, however, for exports in the vehicle industry (-2.7%).
Of the principal export recipients, the eastern European markets were the most dynamic, with increases of more than 25% to Russia, Romania, Poland and Turkey. There were also favourable trends in exports to the main European partners: +5.4% to Germany, +24.% to France and + 7.5% to Spain. On the other hand, exports to the US market decreased (-8%).
The positive trend for imports (+11.8%) concerned all the main economic sectors, with considerable increases for metal products (+20.2%), chemical products (+18.8%) and machinery (+18.6%).
Germany is the main supplier of imported goods, with €1,127 million, an increase of 12% and supplying 22% of imports to the province. Apart from that, there has been a considerable increase in imports from China to Padova (+30.2%), now the third supplier market for Padova industries (€422 million and 8.2% of imports to the province). Imports also come from the Netherlands (+33.4%), Romania (+17.8%), Turkey (+43.1%) and Bulgaria (+40.6%).
Rovigo
2006 was also a positive year for foreign trade for the province of Rovigo: sales on international markets began to pick up again for local industries, thereby strengthening a recovery for exports from the province. In 2006 they reached a value of around €951 million, up 13.3% on the previous year. As concerns industry, foreign exports of machinery remained stationary (+0.1%), while all the other main economic sectors registered notable increases in exports, with peaks of 34.2% for metal products and 13.9% for chemical products. Exports to the United Kingdom (+21.8%), the United States (+26.4%) and Romania (+48.1%) increased considerably.
There were imports of around €824 million, an increase of 11.3% on the previous year. Purchases abroad of electrical appliances decreased in value (-7.6%), while imports of agricultural products (+26.7%), chemical products (+17.6%) and metal products (+34.3%) were up on the previous year.
Treviso
In 2006 foreign trade in the province of Treviso registered a 7.2% increase in exports, a total of around €9,361 million.
An analysis of exports from the main industries shows a highly positive trend for furniture (+15%), the tanning industry (+12%), optical and electronic instruments (17.6%) and metal products (+17.3%). Exports of machinery, 25% of exports for the province, remained stationary (+0.2%).
As concerns textile and clothing, the second industry in the province for value of exported goods (€1,736 million in 2006), exports increased by 3.4% during the year.
The main markets for Treviso exports are still Germany (+5.7% compared to 2005), France (+8.3%), Spain (+12.2%), the United Kingdom (+6.9%) and Romania (+6.8%).
In 2006 imports to the province of Treviso reached a total of €5,276 million, registering an increase of 10.7%. All the main economic sectors contributed to this growth in value of imports, in particular the optical and electronic instrument sector (+24.1%) and that of leather goods (+15.2%).
Last year saw an increase in supply from China (+36.6%), first partner for imports to Treviso (€855 million, 16.2% of the total for the province) and from India (+59.8%), particularly in the fashion industry.
Venezia
In 2006 Venetian export with a value of more than €4,450 million, registered an increase of 4.9% compared to the previous year.
The considerable fluctuations in turnover from the sale of ships and aeroplanes (€767 million in 2006 and a share of 17.2%) had a strong influence on export trends for the province. In fact over the last year, the increase in Venetian exports, which includes the metal industry (+32.8%), chemical (+10.3%) and petroleum products (+29%), and optical and electronic instruments (+14.6%) has been affected by the negative trend in exports of means of transport (-14.3%).
As far as foreign markets are concerned, the export of Venetian goods to Germany (+3%), Austria (+13.3%), the Netherlands (+10.7%), China (+6.2%), Croatia(+64.5%) and Russia (32.3%) has increased. The Dutch Antilles are now fourth in the top ten export markets, thanks to the export of more than €340 million worth of "ships and boats".
Over the last year there was a 15.5% increase in imports by the province of Venice, almost entirely generated by the demand for energy (+88.9%), by far the biggest import for the province (€1,598 billion in 2006) and petroleum products (+19.4%). Imports of metal products are also up by 46.4%.
Means of transport, on the other hand, have registered a decrease in imported goods (-35.5%), largely due to the reduction in inflow from aeroplanes (from €365 million in 2005 to €190 million in 2006).
Vicenza
Although the province of Vicenza registered the lowest growth rate (+4%) in 2006, the province is still firmly in first place in the region for exports (€12,131million, equal to a 27.7% share). In 2006 the growth in exports from the province was led by the sale of machinery (+3.1%), optical-electronic instruments (+14.4%) and gold products (+11.4%).
On the other hand, exports decreased for the fashion industry (-4.2% for textiles and clothing, and -3.9% for leather tanning). As was mentioned above, these data do not take into account the foreign sales abroad of the numerous companies relocated to other countries. The data therefore are not sufficient to show the state of health of the sector.
Exports to the United States (+12.3%) are on the increase as it reclaims its status as number one recipient market for products from the province of Vicenza (€1,325 million and a share of 10.9% of the market). Constant increases in exports to Switzerland (+9%), Hong Kong (+11.5%), China (+23.4%), Russia (+43%), Turkey (+19.3%) and Romania (+21.5%) have been registered. On the other hand, in terms of value, exports to the main EU markets have decreased: -7.7% to Germany, -6.8% to France, -11% to the United Kingdom and -11.9% to Spain.
In 2006 the province of Vicenza imported €7,014 million worth of goods. Compared to the previous year imports increased by around €525 million, equal to an increase of 8.1 percentage points for 2006. This growth was led by the more than positive performances of the tanning industry (+22.1%) and metal products (+10.4%). The most important contributions to the increase in imports to Vicenza come from Switzerland (+21.8%), China (+22.5%), the Netherlands (+42.1%) and Brazil (+52.3%).
Verona
In 2006 the province of Verona exported €7,647 million worth of goods (17.4% of the region's exports). The export trend for the province was positive for 2006 (+11.6%) and it involved all the main economic sectors, with increases of more than 10 percentage points for machinery, biggest export from the province (€1,594 million), as well as for food, metal products and means of transport. The first recipient of goods from Verona is Germany (€1,193 million, up 6%), while France has gone back up to second place (€583 million, up 4.8%), the United States is just behind, having fallen into third place (+2.4%). The export turnover for the province of Verona has also grown in the other main markets, with peaks in Romania (+22.2%), Switzerland (+18.8%) and Poland (+42.6%).
Imports, worth €11,235 million, have increased by 6.7% over the last year. The province of Verona accounts for more than 30% of the region's imports and this is strongly influenced by the presence of some car importers in the province (€4,924 million in 2006, equal to 43.8% of imports for the province). The importation of metal products (+33.9%), textile and clothing (+19%) and of leather products (+16.4%) also increased.
The most important suppliers are Germany (with a 41.8% share of the total for the province and an increase of 1.3%), Spain (+17%), Belgium (-14.8%), France (+8.6%), Slovakia (+7.1%) and China (+41.4%).
 Back Back
Notes
- Differences between the export and import of goods.
- The speed with which provisional data about foreign trade is transmitted hides an estimation error which has considerable significance for exports. If this error concerns exports for all regions of Italy, for the Veneto it is more significant still both in terms of percentage point differences and in terms of weight. In 2005 exports for the Veneto were underestimated by a billion euro, that is 2.5% of total exports.
- Entry in the European Union from 1/1/2007
- Main Industrial Groupings (MIGS). This classification has been defined by Commission Regulation (EC) No 586/2001 (OJ 27/03/2001). For each grouping, whole groups and/or sectors of economic activity have been assigned, according to the prevalence criterion. The imported and exported goods and goods resulting from economic activities other than industry in the strictest sense (not considered in the Regulation), were attributed to the MIGS by applying the prevalence criterion.
|
| Table 2.1.1 |
 |
| Figure 2.1.1 |
 |
| Figure 2.1.2 |
 |
| Figure 2.1.3 |
 |
| Figure 2.1.4 |
 |
| Figure 2.1.5 |
 |
| Table 2.1.2 |
 |
| Table 2.1.3 |
 |
| Figure 2.1.6 |
 |
| Table 2.1.4 |
 |
| Figure 2.1.7 |
 |
| Figure 2.1.8 |
 |
| Figure 2.1.9 |
 |
| Figure 2.1.10 |
 |
| Table 2.1.5 |
 |
|


 Index
Index 


