1.1 - World growth and the Veneto economy

"In a challenging environment, organisations excel provided that they manage to find adequate resources and show greater determination in achieving bold objectives". These were the words of Michael Porter (Note 1), who summarised how nations, regions, or enterprises were to build a competitive advantage. In accordance with the EU's plans for the 2007-2013 cycle, which identifies "regional competitiveness and employment" as one of the main objectives, this chapter aims to analyse the international, national and local economic situations via the macroeconomic elements that can be used to boost the competitiveness of a territory.

Top  International competition and emerging economies

In 2006, the world economy continued to grow quickly (+5.2%), maintaining the upward trend of the last ten years; one which is set to continue. International trade continues to expand and is driven by the growth of emerging economies. Indeed it is set to grow by +9% in 2006. 2004-06 is the 3-year-period with the highest and most dynamic trade growth since the oil boom of the 1970s. (Table 1.1.1) and (Figure 1.1.1).
The first part of 2006 was characterised by an initial upturn in the United States economy, which was due to an increase in household spending on durable goods. The second semester, however, experienced a downturn due to an abrupt halt in consumption and investments. The development of the economic situation in 2007-08 will be conditioned by the consequences of the crisis in the United States real-estate sector. The drop in wealth effects linked to the value of residential real-estate, plus the increasing burden of family debt, are causing a reduction in private consumption and a resizing of residential investments, which are at the root of the slowdown in GDP growth.
The currency market reflects these tensions with a drop in the value of the dollar against the euro. In 2007, the dollar was valued at an average of 1.32 euro; in 2008, however, this trend is expected to reverse slightly and the dollar will be valued at an average of 1.29 euro. (Figure 1.1.2) and (Table 1.1.2).
The fourth quarter of 2006 saw high growth in Asiatic countries, although growth did slow. In Japan, however, both internal and external growth showed signs of recovery. Overall, 2006 proved to be a year of strong growth both in production investments and in exports. Exports, in particular, have benefited from a weak yen, which has been so for some time.
China is still one of the main powerhouses of development. Indeed, the Chinese economy grew at a rate of + 9.9% in 2006. Other Asiatic countries, in particular India, are also forecast to have good medium-term prospects. Central-eastern European countries are experiencing GDP growth of more than +5.5%, which is being driven especially by growth in Poland. The Russian economy, which is still strongly linked to the energy sector, saw its GDP grow by +6.7% in 2006. (Table 1.1.3).

Top  Exogenous factors affecting development

Commodity cost (Note 2) has a major effect on a country's competitiveness. In emerging areas, especially in China and India, the high demand for raw materials keeps prices up, but at the same time the enormous labour supply within Asiatic countries contains the cost of commodities. Consequently, these countries are able to compensate for the increase in raw material prices as costs are not completely offloaded onto finished products. The consequence is that prices of manufactured goods have risen less than those of commodities, and the greater presence of low-cost manufactured goods on the market has neutralised the effect of higher oil prices on inflation.
In 2006 and the first quarter of 2007, raw material prices were still high. At the beginning of winter, the price of oil was affected by the exceptionally high temperatures. It dropped to a minimum of 55 dollars a barrel, but then started to rise. Major increases in international prices for other raw materials were felt both in 2004 and in 2005. The rising cost of metal meant that prices were also high in 2006. Apart from aluminium and zinc, all the materials underwent a wave of stiff increases.
In addition to increased demand in emerging areas, other specific factors contributed to the dynamics of metal prices. Rising oil prices were reflected in the rising cost of goods, such as steel, which are produced with enormous amounts of energy; the price of producing oil substitutes, such as uranium, was also indirectly affected. It is also clear that the raw materials market is being exploited by speculators. Nowadays raw materials are a major share in the portfolios of international investors and are an important tool for diversifying risk.

Top  The situation in Europe

Within the European Monetary Union, GDP in 2006 returned to positive territory, growing by 2.8%. This growth is supported by internal demand, exports and growing investments. The European Commission's Business Climate indicator remains high, but it predicts a marginal slowdown in GDP in 2007. All European countries registered a growth in 2006, including Germany and Italy, which had shown signs of weakness the previous year. The annual average growth of Germany in 2006 was 2.6%. This can be explained by the improved competitiveness of German products on foreign markets and by the recovery of investments in construction and production, which were driven by the low cost of credit and by good business profit. France's GDP, however, was less sprightly at +2.0%, which showed the two faces of this economy. On one side was the strength of household consumption and service production, on the other was the disappointing progress of industrial production, in particular within the automobile industry. Spain ended 2006 by recording a 3.9% increase in GDP, much higher than the EMU average, and a sustained rise in employment. In the United Kingdom, GDP grew by 2.7% in 2006, which demonstrates the strength of a development model driven mainly by the growth of services. (Table 1.1.4)

Top  Productivity

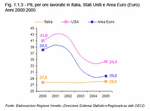
The expansion cycle currently underway also favours the recovery of labour productivity in Europe after a long downward trend that worsened during the 1990s. Among the causes are the slowdown both in capital intensity and in total productivity factors. This was the opposite to what has happened in the USA where great emphasis is placed on new information and communication in order to strengthen capital intensity and total productivity factors. Although the EMU reached its nadir in 2004, a recovery in labour productivity is currently underway and is particularly apparent in the industrial, commerce, transport and communications sectors. (Figure 1.1.3)

Top  Labour costs

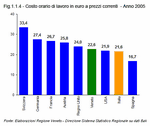
On the other hand, labour costs are worsening in the major European countries, a key factor in the competitiveness and attractiveness of a territory. Labour costs in Europe are still high, and indeed they are rising more quickly than in the United States; only Spain has competitive hourly labour costs. Investors in Europe are not only looking for low-cost labour, but also for high professionalism. Several studies (Note 3) have revealed that labour costs are one of the factors that, alongside work conditions, make it easier for an enterprise to localise. (Figure 1.1.4).

Top  The situation in Italy

From 2000-2005, Italy's economy was characterised by a prolonged period of stagnancy that lasted much longer than previous cycles, hitting rock bottom in early 2005. The economy started to recover slowly in February 2005, but gained momentum, and in 2006 it recorded an increase in GDP of 1.9%, which was in line with growth in the second half of the 1990s. At the root of this recovery were factors linked both with an upsurge in Europe and with a period of reorganisation and/or adjustment underway in the sectors most exposed to international competition, and in the manufacturing industry in particular. All sectors contributed to this progress, but the industrial sector played a major role due to its 1.4% growth in December in the production of added value and to its spearheading an upturn in foreign trade. Initially, the sectors behind the recovery in production were those in which Italy specialises, namely engineering and transport. In the second four-month period of 2006, these sectors were joined by more traditional Italian industries, i.e. textiles, clothing, leather, wood and furniture. Exports were fostered by an intense development in world demand and by a new expansion cycle in Germany. Some studies (Note 4) highlight other reasons that may have contributed to the growth of exports. On one hand, growth could be explained by a shift towards market segments with higher added value and higher quality, i.e. those less vulnerable to competition from emerging markets. On the other was a reorganisation of production processes within individual companies. The majority of exports came from enterprises that intensified their internationalisation. This development raised the cost of operating on foreign markets, which led to medium and large enterprises consolidating their position and to smaller and marginal enterprises leaving the market.
The other two key features for a country's competitiveness-productivity and labour costs-were positive in 2006. Despite a sustained increase in employment, productivity was on an upward trend, although at a contained rate, whilst the increase in labour costs per product unit slowed down.
Economic indicators for the first few months of 2007 suggest a modest decrease in production and a consequent growth in GDP in the first semester of 2007. These are due to an appreciation of the euro, to lower foreign demand, and to the resizing of stock accumulation process. (Table 1.1.5).

Top  The situation in the Veneto

In the Veneto, internal demand is expected to rise in the wake of a recovery across Italy, which is due to both an initially contained slowdown in private consumption and an acceleration in the growth of investments. For 2006, the economic research institute Prometeia estimates an overall growth in GDP of 2.1% with the prospect of 1.9% for 2007.
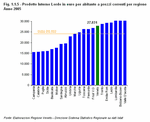
In 2005, the most recent year of official local accountancy figures, the Veneto economy continued to maintain a consistent share in the production of national GDP (9.3%). The Veneto is third in the regional rankings for the production of national wealth after Lombardia (20.9%) and Lazio (10.9%). In dynamic terms, however, it has slowed down. The Veneto was seriously affected by growing difficulties in international trade, which were rooted in structural factors that struggle to redirect offer towards more hi-tech sectors and hold back organisation and innovation within the production system. The pessimism of both households and enterprises led to prudence and stagnant internal demand. Improvements, however, were noticeable towards the end of the year and there was an upturn in 2006 following improved exports, industrial production and consumption. (Figure 1.1.5).
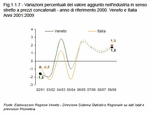
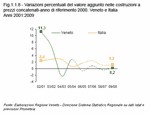
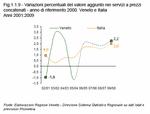
A major contributor to the stagnancy of added value was the services sector, which represents 62.2% of entire regional wealth. Despite including the outstanding commerce sector, which rose by 2.2%, the services sector was resized by -1.2% in 2005. Industry in a strict sense had an extremely positive 2004, growing by 2.8%, but it slowed in 2005 by 1%, whilst the construction industry recovered and increased by 2.8%. Agriculture dropped by 4.2%.
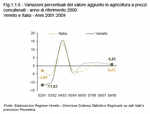
Estimates for 2006 forecast a recovery for agriculture, stagnancy in construction, and an increase of more than 2% in industry and services. A similar forecast has been made for 2007 (Figure 1.1.6), (Figure 1.1.7), (Figure 1.1.8) and (Figure 1.1.9).
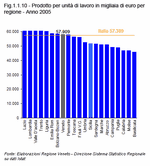
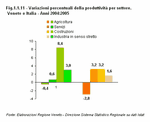
The recovery of labour productivity in the EMU and in Italy has also had repercussions in the Veneto. Wealth produced per labour unit was 57,909 thousand euro, one of Italy's highest regional values; in 2005 the growth rate of 2.6% was a percentage point higher than the first few years of this millennium. Increased productivity in the Veneto was partly due to a 0.6% drop in labour units, which nevertheless remained constant at 9.2% of Italy's total labour units.
There appears to be a net recovery in the construction industry and a complete recovery in industry, in particular in the mechanical-electrical-optics-transport aggregate, i.e. in medium to medium-high technology sectors. Productivity in services, after years of growth, is experiencing a stagnant period, despite an increase in trade. This scenario suggests that there is still 'diffidence' when it comes to opening services markets. Nevertheless it also shows an inevitable development in innovation and technology, which are suitable alternatives for improving productivity. (Figure 1.1.10) and (Figure 1.1.11).

Top  Investments

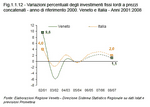
The most recent figures (2004) and forecasts for the coming years suggest that there is a wide range of investment dynamics. Nationally, after one year of recession, investments for 2004 grew up (+2.2%), whilst growth in the Veneto of 0.9% was driven mainly by investments in services (+3.2%), particularly in monetary and financial brokering, in real estate, and in enterprises. However, less was invested in industry, -3.8%, and in construction, -24.4%. Despite the continuation of low-cost financing on the credit market, investments in Italy in 2005 fell slightly by 0.2%. This may have been due to a worsening of profitability conditions and to the modest degree of plant use.
Nevertheless, national figures for the following years show an overall recovery in investments. In Italy the 2.5% increase in 2006 was felt in all sectors, including machinery, vehicles and construction.
Estimates for 2006 forecast that the Veneto will grow, a trend that is set to continue for the next two years. (Figure 1.1.12)

Top  Consumption

Although household consumption recovered in 2004, it seemed to slow in 2005, both in the Veneto (-0.1%) and in Italy (-0.1%). Demand for non-durable goods continued to fall, in particular for clothes, footwear, alcohol and tobacco, while demand for durable goods was up 0.6% in Veneto and 0.8% in Italy. In the Veneto, from 2000-2005, the share of non-durable goods dropped by 3% of overall expenditure, whilst the share of durable goods remained stationary thanks to the consistent increase in communications expenditure, consumption grew up in services (+2.6%), which cover a huge 48.6% of the total.
For 2006, forecasts state that the north-east will experience a steeper increase in household consumption (+1.9%, +1.5% in Veneto), whilst 2007 should be marked by a decrease in spending, which will settle at 1.3%. (Figure 1.1.13).

Top  Inflation

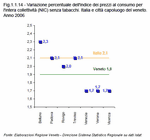
Inflation in Europe stabilised at a low rate, and in the first few months of 2007, it stayed below the target of the European Central Bank (ECB). In Italy, the consumer price index for the whole nation (NIC) settled above the EU average, rising by 2.1%. This rate was up on the 1.9% rise in 2005, which illustrated a low level of growth and a loss of competitiveness across Europe.
A mid-year hike in oil prices contributed to price increases for households, energy and transport.
The Veneto's +1.9% inflation rate for 2006 was slightly lower than at national level, although Belluno recorded a rate of 2.3%. In Treviso and Padova, inflation was at the same rate as national level. (Figure 1.1.14).

Top  Integrated provincial accounts

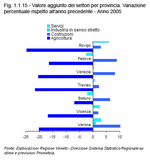
Only estimates are available for the creation of wealth at provincial level for 2005. Regional weakness can be put down to the poor progress in the provinces of Belluno, Treviso, Venezia and Padova. Figures for Vicenza were stable at last year's rates, whilst Rovigo and Verona contributed positively to the growth of regional added value.
The agricultural sector experienced a sharp drop province-wide. The construction sector developed in all the provinces, with particularly strong development in Verona, Padova, Venezia and Belluno. The provinces that performed most shakily in the industrial sector were Venezia and Treviso. There were considerable improvements in the service sector in Rovigo, Verona and Vicenza.
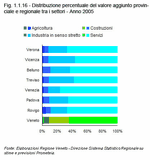
Figures for 2006 estimate widespread growth in all the provinces, which will extend into 2007 and 2008. Agriculture will recover partially, whilst industry and services will experience a substantial, widespread recovery across the provinces. The construction sector is set to suffer in the province of Padova, but will grow in all the other provinces. (Table 1.1.6), (Figure 1.1.15) and (Figure 1.1.16).


Back Back

Notes

  1. Michael E. Porter was born in 1947. He is a professor at William Lawrence University, home of the Harvard Business School, where he is head of the Institute for Strategy and Competitiveness.
  2. Basic product means a product or a raw material on which the economy of a certain geographical area is based.
  3. Study by Ambrosetti-Siemens: the attractiveness of system Italy, 2005
  4. Isae, Fondazione Debenedetti, Prometeia


Table 1.1.1
Percentage variations of the main indicators for world economy - Years 2005:2010
Figure 1.1.1
Growth at constant prices of world GDP - Years 2000:2010
Figure 1.1.2
Annual percentage variations in the trade of goods worldwide - Years 2000:2010
Table 1.1.2
Quarterly exchange rates into euro - Years 2006:2007
Table 1.1.3
Percentage variations of economic indicators for the main industrialised countries - Years 2005:2008
Table 1.1.4
Percentage variations of economic indicators for the major countries in the euro area - Years 2005:2008
Figure 1.1.3
GDP per hours worked in Italy, the United States and the Euro Area (in Euro) -  Years 2000:2005
Figure 1.1.4
Hourly cost of labour in euro at current prices - Year 2005
Table 1.1.5
Macro-economic overview (percentage variations of constant values. Base year 2000). Veneto and Italy - Years 2001-2006
Figure 1.1.5
Gross Domestic Product at current prices in euro per inhabitant per region - Year 2005
Figure 1.1.6
Percentage variations of added value in agriculture at constant prices. Base year: 2000. Veneto and Italy - Years 2000:2007
Figure 1.1.7
Percentage variations of added value in industry in a strict sense at constant prices. Base year: 2000. Veneto and Italy - Years 2001:2009
Figure 1.1.8
Percentage variations of added value in construction at constant prices. Base year: 2000. Veneto and Italy - Years 2001:2009
Figure 1.1.9
Percentage variations of added value in services at constant prices. Base year: 2000. Veneto and Italy - Years 2001:2009
Figure 1.1.10
Product per labour unit in thousands of euro per region - Year 2005
Figure 1.1.11
Percentage variations of productivity per sector. Veneto and Italy - Years 2004:2005
Figure 1.1.12
Percentage variations of fixed gross investments at constant values. Base year: 2000. Veneto and Italy - Years 2001:2009
Figure 1.1.13
Percentage variation of final household consumption per consumption type. Veneto and Italy - Years 2000:2005
Figure 1.1.14
Percentage variation of consumer price index for the whole nation (NIC) excluding tobacco products. Italy and provincial capitals in the Veneto - Year 2006
Table 1.1.6
Added value per province 2005 and annual percentage variation 2003:2007
Figure 1.1.15
Added value of sectors per province. Percentage variation compared to previous year - Year 2005
Figure 1.1.16
Percentage distribution of provincial and regional added value per sector - Year 2005

Verify the accessibility : Valid HTML 4.01! 

Data elaborated by the Statistics office of the Veneto region are collective property; reproduction of this material is authorised for non-commercial purposes only, provided the source "Regione Veneto - Regional Statistics System Management" is acknowledged.