Chapter 2
The Veneto economy on the global market
World trade growth is slowing down. After the excellent performance of 2012, up by 14.2% compared to the previous year, world trade has entered a period of sharp decline, recording a growth of around six percent in 2011, falling to two in 2012. In the last year, the growth of world trade thus showed an increase significantly lower than the average growth rate recorded in the last twenty years. A sharp recovery of world trade is predicted for the two year period 2013-2014, where exports are due to accelerate, starting from the second half of 2013, attributable to the increase in demand from emerging markets following the more expansive orientation of macroeconomic policies, and also to the greater dynamism of the US economy. This estimate may be revised downwards following the return of some protectionist measures, which some governments have identified as a solution to combat unemployment and the recession. (Figure 2.1.1)
On a territorial level, in 2012 the export dynamic was much higher than the national average for the island regions (+21.3%) and central Italy (+6.3%). The north-west (+3.5%) and north-east (+1.1%) of Italy achieved positive results, albeit lower than average, whereas sales in southern Italy decreased slightly (-0.2%). The regions that most contributed to export growth in 2012 were Lombardy, Sicily, Tuscany, Emilia-Romagna and Sardinia, attributable for almost 80%. (Table 2.1.1)(Table 2.1.2)
The growth of national exports is supported by the increase of sales on non-EU markets (+9.2%), whereas exports to the EU area are slightly down (-0.7%). In fact, the most dynamic markets for Italian export are the United States, Switzerland, Turkey, Japan, the United Arab Emirates and Russia. However, foreign sales in almost all the major EU markets fell: -1.1% in Germany, -1% in France and -8% in Spain. Within the EU, a positive trend of export to the United Kingdom and Belgium was recorded.
In terms of sectors, the most intense growth on an annual basis regarded the export of pharmaceutical and chemical items, sporting goods, jewellery and eyewear, as well as goods from the agricultural sector, whereas electronic devices, electrical appliances and means of transport recorded a slight decrease in export value.
The recession also negatively affected the dynamic of national imports (-5.6% compared to the value recorded in 2011). The decrease in imports can be attributed to the decline in purchases from EU markets (-7.2%) and in supplies coming from non-EU areas (-3.9%). Within the EU area, the most significant reductions, in terms of value, were recorded in imports from Germany (-7.2 billion euros, equal to -11.5%), which remains the main supply of Italian businesses, France, the United Kingdom and Spain. With regards to the non-EU markets, there was a decline in purchases from China (-4.9 billion euros), which remains the third market of reference for Italian businesses. On a sector level, the decline in imports involves almost all of the major sectors, with the most notable reductions in the transport industry (-21.2%, equal to -8.1 billion euros) and the electronics sector (-6.2 billion euros).
However, foreign sales to the other main European partners decreased: - 1.3% to Germany, the top market of reference for our territory, -2.3% to France and -9.2% to Spain. Furthermore, Veneto exports to China are worth noting: in 2012 sales to the Asian giant fell by -26.2%, equal to 479 million euros less than in 2011. From the in-depth analysis of export flows, it emerged that this negative dynamic was generated by the reduction in foreign sales of Treviso businesses operating in the mechanical sector: exports of machinery from Treviso to China decreased from 567 million euros in 2011 to 80 million euros in 2012, 487 million euros less compared to the previous year. This negative result, which is presumed to be due to the acquisition of mechanic businesses in Treviso by foreign investors, explains the entire deficit of regional foreign sales to China last year. (Figure 2.1.3)
In terms of sectors, the growth of export in the agri-food sector was positive and higher than the regional average and within this sector companies are developing their own international projection to remedy the prolonged decline in national consumption, which recorded an increase of about 8 percent. Exports also grew in gold production, eyewear and sporting goods, metal processing and transport. In terms of value, foreign sales in the fashion sector and electrical equipment remained almost unchanged. However, exports of electrical appliances decreased.
Foreign sales of mechanics, which remains the most important area of regional export, reflected the 'Treviso effect': in 2012 exports of the sector recorded an annual reduction equal to 213 million euros (-2.1%). However, the growth in foreign sales of machinery achieved in the remaining provinces (+ 335 million euros) partly compensated for the negative figures recorded in the province of Treviso. (Figure 2.1.4) (Figure 2.1.5)
For 2012, the trade balance was also positive, equal to +13.6 billion euros, with a larger surplus for non-EU countries (+7.8 billion) compared to EU countries (+5.8 billion). The trade surplus of North American markets was nearly 3 billion euros and recorded a growth of around 300 million euros compared to the previous year. Trade surplus towards other countries (Switzerland, Turkey and Norway) also grew significantly, about 500 million euros compared to 2011, as well as to Middle Eastern markets (+1.8 billion euros in 2012). The overall positive balance was supported by the large trade surplus of mechanical products (+7.8 billion), sporting goods, eyewear and the gold sector (+3.4 billion), electrical appliances and the fashion industry. The trade balance for transport (-2.6 billion) and the agricultural sector (-751 million euros) remained negative.
The decrease in Veneto imports (-7.8% compared to 2011) was more pronounced for EU countries (-10.6%) compared to non-EU countries (-2.7%). Among the markets belonging to the EU, a negative variation of over ten per cent was recorded in Germany, which remains the reference market for the value of imported goods (about 20% of regional imported goods), the Czech Republic, Spain and the United Kingdom.
2012 was also characterised by a strong decline in foreign purchases in transport (-28.6%, equal to -1.8 billion euros compared to 2011), the electronics department, the mechanical sector and the fashion industry (-7.4%), which remains the most important regional sector in terms foreign purchase value: 6.4 billion euros in 2012, equal to 17% of regional imports. (Table 2.1.3)
In 2012, all Veneto provinces, with the sole exception of Treviso, positively contributed to the increase in regional exports. The provinces that contributed the most to the growth of regional exports and contributing to a large part of overall growth, are Vicenza (with an annual variation of provincial exports of +3.2%, equal to 460 millions in Euro more than 2011), Padua (+4.4%, equal to +360 million euros) and Verona (+3.4%, equal to +307 millions of euros). Venice (+5.3%), Belluno (+3.9%) and Rovigo (+2.1%) also showed quite positive dynamics, albeit with a smaller impact on the total growth of regional export. Treviso's overall export in 2012 decreased by six percent compared to the 2011 total. As previously stated, the negative balance of this province is mainly attributable to the reduction of machinery sales to China.
The import trend was negative in all Veneto provinces, with the only exception of Venice. The growth of supply in the province of Verona can be attributed to two sectors: the chemical sector (about 400 million euros more than in 2011) and goods connected to the energy sector (about 600 more compared to 2011).
The decrease of import value was most pronounced in Belluno (-18% compared to 2011), Verona (-15.3%), Padua (-12.2%) and Treviso (-11.6%), while the reduction of import was lower than the regional average in the provinces of Vicenza (-5.4%) and Rovigo (-2.8%). In the province of Verona, there was a marked reduction of foreign purchases of transport means, going from 5.4 billion euros in 2011 to 3.7 billion in 2012, equivalent to around 30 per cent less.
The majority of export operators sell to the EU, with around twelve thousand in 2012, closely followed by Eastern Europe which recorded almost eleven thousand, despite a slight reduction (-0.2%). The rest of Europe (Switzerland, Norway and Turkey) is the third geographic country with regards to the number of regional trade operators (almost nine thousand), exceeding Eastern Asia by about two thousand.
In Italy
Within a period of notable shrinkage in domestic demand, foreign sales and the competitiveness of Italian businesses on foreign markets have been identified as among the most important leverages for the development of the national economy. Also in 2012, Italian exports, which almost reached the threshold of 390 billion euros, grew by +3.7%, equal to an increase in real terms of just over 13.8 billion euros. After ten years, 2012 closed with a trade surplus of almost eleven billion euros, following a reduction in imports, which, in the last year, showed a decrease of -5.6%. The overall positive balance was supported by the large trade surplus with markets belonging to the European Union (+9.7 billion euros).On a territorial level, in 2012 the export dynamic was much higher than the national average for the island regions (+21.3%) and central Italy (+6.3%). The north-west (+3.5%) and north-east (+1.1%) of Italy achieved positive results, albeit lower than average, whereas sales in southern Italy decreased slightly (-0.2%). The regions that most contributed to export growth in 2012 were Lombardy, Sicily, Tuscany, Emilia-Romagna and Sardinia, attributable for almost 80%. (Table 2.1.1)(Table 2.1.2)
The growth of national exports is supported by the increase of sales on non-EU markets (+9.2%), whereas exports to the EU area are slightly down (-0.7%). In fact, the most dynamic markets for Italian export are the United States, Switzerland, Turkey, Japan, the United Arab Emirates and Russia. However, foreign sales in almost all the major EU markets fell: -1.1% in Germany, -1% in France and -8% in Spain. Within the EU, a positive trend of export to the United Kingdom and Belgium was recorded.
In terms of sectors, the most intense growth on an annual basis regarded the export of pharmaceutical and chemical items, sporting goods, jewellery and eyewear, as well as goods from the agricultural sector, whereas electronic devices, electrical appliances and means of transport recorded a slight decrease in export value.
The recession also negatively affected the dynamic of national imports (-5.6% compared to the value recorded in 2011). The decrease in imports can be attributed to the decline in purchases from EU markets (-7.2%) and in supplies coming from non-EU areas (-3.9%). Within the EU area, the most significant reductions, in terms of value, were recorded in imports from Germany (-7.2 billion euros, equal to -11.5%), which remains the main supply of Italian businesses, France, the United Kingdom and Spain. With regards to the non-EU markets, there was a decline in purchases from China (-4.9 billion euros), which remains the third market of reference for Italian businesses. On a sector level, the decline in imports involves almost all of the major sectors, with the most notable reductions in the transport industry (-21.2%, equal to -8.1 billion euros) and the electronics sector (-6.2 billion euros).
In Veneto
In 2012, Veneto exports recorded an increase of +1.6% compared to the previous year, reaching a value equivalent to 51.1 billion euros. Veneto was confirmed as the second region in Italy, just behind Lombardy, for the value of exported goods, with a percentage of 13.1% of national foreign sales. The growth of export is supported by the increase in sales on non-EU markets (+6.7%), while sales within the EU are slightly down (-1.9%). The expansion is driven by sales to the United States (+11%), which remains the third largest market for Veneto businesses, Switzerland (+23.2%, equal to an increase of 489 million euros), Russia (+10.2%), the United Arab Emirates (+9.7%), Japan (+22.1%), Saudi Arabia (+17.2%) and South Africa (+34.3%). The positive trend of export to these markets shows the continuous ability of Veneto to seize the opportunities presented on both the traditional markets and the emerging markets. With regards to the European markets, positive trends were recorded in the United Kingdom, Belgium and the Netherlands. (Figure 2.1.2)However, foreign sales to the other main European partners decreased: - 1.3% to Germany, the top market of reference for our territory, -2.3% to France and -9.2% to Spain. Furthermore, Veneto exports to China are worth noting: in 2012 sales to the Asian giant fell by -26.2%, equal to 479 million euros less than in 2011. From the in-depth analysis of export flows, it emerged that this negative dynamic was generated by the reduction in foreign sales of Treviso businesses operating in the mechanical sector: exports of machinery from Treviso to China decreased from 567 million euros in 2011 to 80 million euros in 2012, 487 million euros less compared to the previous year. This negative result, which is presumed to be due to the acquisition of mechanic businesses in Treviso by foreign investors, explains the entire deficit of regional foreign sales to China last year. (Figure 2.1.3)
In terms of sectors, the growth of export in the agri-food sector was positive and higher than the regional average and within this sector companies are developing their own international projection to remedy the prolonged decline in national consumption, which recorded an increase of about 8 percent. Exports also grew in gold production, eyewear and sporting goods, metal processing and transport. In terms of value, foreign sales in the fashion sector and electrical equipment remained almost unchanged. However, exports of electrical appliances decreased.
Foreign sales of mechanics, which remains the most important area of regional export, reflected the 'Treviso effect': in 2012 exports of the sector recorded an annual reduction equal to 213 million euros (-2.1%). However, the growth in foreign sales of machinery achieved in the remaining provinces (+ 335 million euros) partly compensated for the negative figures recorded in the province of Treviso. (Figure 2.1.4) (Figure 2.1.5)
For 2012, the trade balance was also positive, equal to +13.6 billion euros, with a larger surplus for non-EU countries (+7.8 billion) compared to EU countries (+5.8 billion). The trade surplus of North American markets was nearly 3 billion euros and recorded a growth of around 300 million euros compared to the previous year. Trade surplus towards other countries (Switzerland, Turkey and Norway) also grew significantly, about 500 million euros compared to 2011, as well as to Middle Eastern markets (+1.8 billion euros in 2012). The overall positive balance was supported by the large trade surplus of mechanical products (+7.8 billion), sporting goods, eyewear and the gold sector (+3.4 billion), electrical appliances and the fashion industry. The trade balance for transport (-2.6 billion) and the agricultural sector (-751 million euros) remained negative.
The decrease in Veneto imports (-7.8% compared to 2011) was more pronounced for EU countries (-10.6%) compared to non-EU countries (-2.7%). Among the markets belonging to the EU, a negative variation of over ten per cent was recorded in Germany, which remains the reference market for the value of imported goods (about 20% of regional imported goods), the Czech Republic, Spain and the United Kingdom.
2012 was also characterised by a strong decline in foreign purchases in transport (-28.6%, equal to -1.8 billion euros compared to 2011), the electronics department, the mechanical sector and the fashion industry (-7.4%), which remains the most important regional sector in terms foreign purchase value: 6.4 billion euros in 2012, equal to 17% of regional imports. (Table 2.1.3)
In 2012, all Veneto provinces, with the sole exception of Treviso, positively contributed to the increase in regional exports. The provinces that contributed the most to the growth of regional exports and contributing to a large part of overall growth, are Vicenza (with an annual variation of provincial exports of +3.2%, equal to 460 millions in Euro more than 2011), Padua (+4.4%, equal to +360 million euros) and Verona (+3.4%, equal to +307 millions of euros). Venice (+5.3%), Belluno (+3.9%) and Rovigo (+2.1%) also showed quite positive dynamics, albeit with a smaller impact on the total growth of regional export. Treviso's overall export in 2012 decreased by six percent compared to the 2011 total. As previously stated, the negative balance of this province is mainly attributable to the reduction of machinery sales to China.
The import trend was negative in all Veneto provinces, with the only exception of Venice. The growth of supply in the province of Verona can be attributed to two sectors: the chemical sector (about 400 million euros more than in 2011) and goods connected to the energy sector (about 600 more compared to 2011).
The decrease of import value was most pronounced in Belluno (-18% compared to 2011), Verona (-15.3%), Padua (-12.2%) and Treviso (-11.6%), while the reduction of import was lower than the regional average in the provinces of Vicenza (-5.4%) and Rovigo (-2.8%). In the province of Verona, there was a marked reduction of foreign purchases of transport means, going from 5.4 billion euros in 2011 to 3.7 billion in 2012, equivalent to around 30 per cent less.
Veneto operators abroad
In 2012, there were 29,780 operators in Veneto who sold goods abroad, a slight increase (+1.1%) compared to 2011. The share of foreign regional sales made by the top five hundred operators increased from 58.8% in 2011 to 59.2% in 2012, whereas 22.9% of regional export was achieved by the top five hundred exporters, in line with the 2011 value.The majority of export operators sell to the EU, with around twelve thousand in 2012, closely followed by Eastern Europe which recorded almost eleven thousand, despite a slight reduction (-0.2%). The rest of Europe (Switzerland, Norway and Turkey) is the third geographic country with regards to the number of regional trade operators (almost nine thousand), exceeding Eastern Asia by about two thousand.
Figure 2.1.1

Table 2.1.1
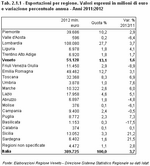
Table 2.1.2
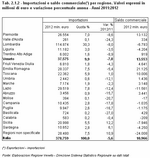
Figure 2.1.2

Figure 2.1.3

Figure 2.1.4

Figure 2.1.5
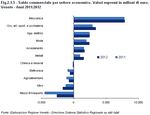
Table 2.1.3

In Italy
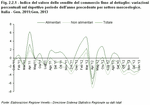
During 2012, the negative trend of consumption was instantly reflected in trade activity, leading to retail sales being reduced in 2012 by 1.7% overall compared to the previous year: the monthly changes compared to the corresponding months of 2011 were only positive in very few cases, only increased by the component of food product sales. In fact, the latter remained stable compared to 2011, +0.2% per annum, contrary to non-food product sales, which decreased by almost 3 per cent. A similar distinction can be made between the trend of large-scale retailing sales, +0.2%, and small shops, whose sales decreased by 3.2% compared to 2011. Large-scale retailing sales slightly recovered compared to the performance of 2011, in which the sector closed with a negative result for the first time since the start of the economic crisis in 2008. Confidence in the retail sector suffered with regards to opinions on sales, sales expectations, order volumes and employment, demonstrated by the decrease across all indices. (Figure 2.2.1)
However, e-commerce continued to grow at a steady pace: internet sales with credit card and international debit card payments were up by 16.5% per annum in 2012 (in nominal terms, with the effects of inflation not removed): furthermore, 70% of these sales concerned travel and transport, consumer services, IT equipment and professional goods and services (Note 1) .
In Veneto
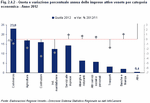
In 2012, fixed place trade in Veneto lost almost 2 stores out of 100 compared to the previous year, penalised by the strong reduction of business premises, -2.8%, compared to the stability of local branches that are not the main premises of economic activity. In 2012, shops specialised in the sale of computer and telecommunications equipment were the only businesses in expansion (+7.8% compared to 2011); establishments specialised in the sale of automotive fuel (+0.1%) remained fairly stable, however, shops specialised in food, drink and tobacco suffered a slight weakening (-0.7%). Larger reductions were recorded for shops specialised in cultural and recreational goods (-2.4%) and other products for domestic use (-4,2%).
Padua and Verona experienced the smallest decline in retail trade (-1.3% and -0.9% respectively), while Venice was the most affected (-2.7%). (Figure 2.2.2)
Street trading ended the year with slight growth compared to 2011, +0.2%, supported by the good performance of the furniture and household items sector, +2.8%, as well as the clothing, textiles, footwear and leather sector, +1.7%.
With regards to the retail trade outside of shops, on stalls and on markets, the explosion of e-commerce in 2012 continued, +16.8%, along with doorstep sales, +16.7%. (Table 2.2.1)
In 2011, the large-scale retailing sector continued to maintain its momentum in slight contrast to the entire trade sector: large-scale retailing grew in number and in size and also in terms of employees, although the growth recorded was smaller to that experienced in 2010. Large department stores, supermarkets and hypermarkets recorded the biggest growth +3.9% per annum, corresponding to a growth of surface area of 2.6% and to employees of 2.7%.
For the first time in 2011 specialised areas had a less dynamic distribution format, closing the year with a reduction of 0.9%: the narrow specialisation in non-food type products meant that these activities have been the most affected by the shrinkage of sales in recent years, actually stronger in the non-food sales sector.
Mini-markets, after several years of decline, started to grow again in 2011, with a 2 percent increase in stores, whilst employees decreased by 1.1% per annum.
The regional sales data for the year 2012 is not available, but it can be presumed that the trend was similar to that recorded for national sales; therefore, it is likely that the growth recorded for large-scale retailing in 2011 did not occur in 2012.
In a year strongly characterised by very unusual weather patterns during the summer season, very high temperatures and a prolonged period of drought, overall sales in the Veneto agricultural sector were maintained. The production value achieved in 2012 was 5.56 billion euros, higher than that of the previous year (+1.2%). The summer drought negatively impacted the production of major crops, but the decline in production occurring on a global scale led to an increase of prices, thus the value achieved remained unchanged.
Production and price trends of 2012 were in conflict: percentage variations at constant prices were almost all negative and showed the decline in the amount produced by agricultural crops, whereas the production levels of animal husbandry limited the decline to much lower levels. However, by considering the production values at current price, the effect of the growing trend of the markets can be noted, mainly occurring in the second half of 2012, when it was clear that the major agricultural crops would suffer large reductions in the quantity produced on a global level. (Table 2.3.1)(Table 2.3.2)
In 2012, a significant decrease of the trade deficit was observed in relation to Veneto agri-food products, falling to 751 million euros (-32%) as a result of the significant increase in exports (+8%), which reached 4.82 billion euros compared to the stability of imports which stood firm at 5.57 billion euros.
Wine, pasta, cheese and baked products made up almost half of agri-food exports, and wine alone totalled 30%: with 1.44 billion euros in 2012, the wine exported from Veneto broke every record, an increase compared to the previous year of 8.3%. (Figure 2.3.2)
It should be noted that with a drop in quantity, there comes an increase in value, evidence of the fact that the quality of exported wine is increasing. Such increase can also be attributed to sparkling wines, which experienced a 25% increase in value and an 18.4% increase in quantity, showing increased popularity abroad, especially in the United Kingdom (our top buyer for this type) and the USA.
Germany was again confirmed as Veneto's best customer in 2012; however, the countries of Northern Europe, with the exception of Denmark and Holland, along with the United States recorded the biggest growth compared to 2011, with figures higher than 10%. (Figure 2.3.3)
With regards to industrial crops, there was a significant recovery of the number of hectares sown with sugar beet (+39%), which allowed an increase in production (+23%) despite the decline in yield (-12%). Soy suffered particularly from the summer drought, experiencing a sharp drop in production (-43%) also due to the contraction of surface area (-11%), however, it benefitted from the market prices which were rather high, especially during the marketing year. Tobacco production (-37%) also declined, following a significant decrease in surface area (-46%), along with sunflowers (-13%) and rape (-16%).
The figures taken from the Veneto Vineyard register indicated a slight increase in total area planted (+1.25%) reaching 76,340 hectares, around 30,100 of is located in the province of Treviso (39%) and 26,300 in the province of Verona (34%). The most cultivated grape in the region is the Glera, from which Prosecco wine is made, occupying a total surface area of around 21,000 hectares, equal to 27.7% of the total. Consequently, 'DOC Prosecco' is the most important denomination in terms of production (about 2.2 million quintals of grapes declared, equal to 38% of the total grapes of denomination of origin), followed at some distance by Valpolicella (820,000 q). Prosecco also occupies third place: there are 815,000 quintals of 'Docg Conegliano-Valdobbiadene' grapes declared, preceding the DOC wines of Verona, Soave, Bardolino and Custoza.
In 2012, the amount of wine grapes in Veneto rose. Overall, the average price increased by 10.5%, from 56 to 62 euro cents per kg. The highest increase was recorded in the province of Verona (+17.8%), where the average prices of Soave grapes (+33.9%) and Vapolicella grapes (+22.6%) increased significantly. In the province of Treviso, the price increase, equal to 8.5% on average, was mainly due to the good sales performances of the grapes suitable for IGT wine, both white and red. However, the grapes belonging to the most significant denomination of the Marca Trevigiana province, or rather DOC Prosecco, suffered a reduction of 24%. Prosecco also fell significantly in Padua (-34%), however the overall price increase was estimated to be +12.3% attributable to the good sales performance of the main DOC and IGT grapes, which increased from 20 to 40%. Venice experienced double digit increases for various types of grapes, especially black grapes.
As can be seen from the Ismea surveys on domestic producer prices, Veneto wines also seemed to have benefited from a significant increase during 2012 compared to the previous year. The annual averages of DOC and DOCG wines increased by 4% for Custoza, 14% for Gambellara, 18% for Soave, 9% for Bardolino, 16% for Merlot del Piave and 25% for Valpolicella classico. The production of Veneto IGT wines also increased: Chardonnay +21%, Pinot grigio +26%, Raboso +19% and Merlot +29%. As can be deduced from the preliminary data, there was also a rise in the export value of wine from Veneto, representing 30% of the national total, which reached 1.44 billion euros (+8.4%). (Table 2.3.3)
During 2012, farm-gate milk prices experienced a particularly uncertain and fluctuating trend. The average annual price was equal to 37-38 euros/100 litres (excluding VAT and quality), 4-5% lower than in 2011. The prices of Grana Padano and Asiago also declined, while the prices of Montasio were stable and the prices of Piave slightly increased.
Based on the national data available, it was estimated that in 2012 the production in Veneto of beef fell by 6% compared to the previous year. In fact, production continued to be adversely effected by the sharp rise in production factors, not only energy but also in feed due to the price increase of agricultural materials, and in farm animals due to the sharp increase in fattening prices. Household purchases of meat also declined. The number of farms active in Veneto in the mixed or meat farming sector fell by 4.1% compared to the previous year, and this decrease especially affected the small farms and also those with a number of animals greater than 100. Consequently, the cattle population of Veneto decreased by about 7,000 animals annually (-0.9%) added to by the reduction of the number of adult animals, while the number of calves increased. (Table 2.3.4) (Table 2.3.5)
Live animal imports also decreased, especially calves (-3.6%), mainly coming from France (390,000 animals), further strengthening its leadership (+3,9%). The reduction in the supply of cattle raised price lists in particular, with increases of average annual price at around 10%. (Table 2.3.6)
The availability of domestic pork meat was estimated to have grown by over 3% compared to 2011, due to both the increase of the number of animals slaughtered (+2.5%) and the average weight. In particular, sales of DOP (denomination of protected origin) salami (+3% in quantity and +2.5% in value) and non-DOP salami (+3.6% in quantity and +2.7% in value) grew, continuing the positive trend of 2011. The average annual price for the sale of heavy pigs in 2012 improved compared to the previous year, reaching 1.49 euro/kg at the market in Mantua (+5.3%).
Production by the national poultry industry increased compared to 2011, having increased in deadweight by 4.4% in the first 9 months, giving rise to a production higher than 1.25 million tonnes. The slaughter of chickens increased by 4.2%, particularly due to the performance of animals weighing more than 2 kg (+6.2% in deadweight). The slaughter of turkeys also increased significantly (+5% in deadweight) especially female turkeys (+15.2%). Domestic demand was also favourable and increased by about 2% in terms of quantity and 3% in terms of value, supporting the prices of boiler chickens, which recorded an average annual price on the Verona market equal to 1.17 euro/kg (cat. >2 kg), an increase of 1.8% compared to the average of 2011. However, the price trend of boiler turkeys was less positive, greatly affecting the increase of supply. The average annual value of male boiler turkeys fell to 1.34 euro/kg (-4.5%).
The Veneto fishing fleet continued to lose boats, which, according to figures from the European Fleet Register as at 31st December 2012 consisted of 704 units operating in sea fishery. The annual decline was 20 boats, equal to -2.8%. The primary regional fisheries in 2012 increased to 3,043 units, with an increase of 27 companies (+0.9%) compared to the previous year. This increase was significantly influenced by fish farms (+5.5%), which outnumbered fisheries, in decline by 3.5%. (Table 2.3.7)
Production and price trends of 2012 were in conflict: percentage variations at constant prices were almost all negative and showed the decline in the amount produced by agricultural crops, whereas the production levels of animal husbandry limited the decline to much lower levels. However, by considering the production values at current price, the effect of the growing trend of the markets can be noted, mainly occurring in the second half of 2012, when it was clear that the major agricultural crops would suffer large reductions in the quantity produced on a global level. (Table 2.3.1)(Table 2.3.2)
In 2012, a significant decrease of the trade deficit was observed in relation to Veneto agri-food products, falling to 751 million euros (-32%) as a result of the significant increase in exports (+8%), which reached 4.82 billion euros compared to the stability of imports which stood firm at 5.57 billion euros.
Agri-food export
Export has now also become the keyword for the agri-food sector, the decline in domestic consumption induces companies to seize the lucrative opportunity to present their products abroad, where they are becoming increasingly well-known and acclaimed: almost all of the top ten products most exported in 2012 increased, some with figures10% higher than the previous year, with the only exception of meat and offal which fell by 5%. (Figure 2.3.1)Wine, pasta, cheese and baked products made up almost half of agri-food exports, and wine alone totalled 30%: with 1.44 billion euros in 2012, the wine exported from Veneto broke every record, an increase compared to the previous year of 8.3%. (Figure 2.3.2)
It should be noted that with a drop in quantity, there comes an increase in value, evidence of the fact that the quality of exported wine is increasing. Such increase can also be attributed to sparkling wines, which experienced a 25% increase in value and an 18.4% increase in quantity, showing increased popularity abroad, especially in the United Kingdom (our top buyer for this type) and the USA.
Germany was again confirmed as Veneto's best customer in 2012; however, the countries of Northern Europe, with the exception of Denmark and Holland, along with the United States recorded the biggest growth compared to 2011, with figures higher than 10%. (Figure 2.3.3)
Businesses and employment
The number of farms registered with the Veneto Chamber of Commerce continued to decrease, falling to 72,400 units in 2012 with a fall of 1.9%, still lower however than the national average decrease (-2.4%). The Veneto food sector recorded a slight decrease in active businesses, falling to around 3,650 units (-1.1 %), a less significant drop compared to that suffered in the overall manufacturing sector (-2.8%).The number of agricultural employees increased significantly (+7.5%), reaching 75,000 units, whilst the food industry suffered a 1.6% loss of employees, higher than the average for the whole industrial sector (-0.9%).Cereals and industrial crops
The cultivation of cereals was strongly affected by the summer drought, as can be seen by the increase of autumn-winter cereals (wheat +26%, durum wheat +11% and barley +6%) and the decrease in production of spring-summer cereals (corn -35%, rice -10%). Corn was confirmed as the top crop in Veneto, with 270,000 hectares (+10%). The surface area of wheat also increased (+4%), but the number of hectares sown with durum wheat (-5%), barley (-9%) and rice (-15%) decreased. Overall, cereals took advantage of the large increases in prices on national and international markets during the second half of 2012, offsetting the disappointing sales performance experienced at the beginning of the year. With regards to industrial crops, there was a significant recovery of the number of hectares sown with sugar beet (+39%), which allowed an increase in production (+23%) despite the decline in yield (-12%). Soy suffered particularly from the summer drought, experiencing a sharp drop in production (-43%) also due to the contraction of surface area (-11%), however, it benefitted from the market prices which were rather high, especially during the marketing year. Tobacco production (-37%) also declined, following a significant decrease in surface area (-46%), along with sunflowers (-13%) and rape (-16%).
The fruit and vegetable sector
Overall, potatoes and vegetables covered the same surface area of the previous year and the production value increased (+1.2%). The market trends varied during the year depending on species and variety: the average annual price decreased for radicchio (-8%) and potatoes (-15%), but rose for lettuce (+18%) and strawberries (+24%). The summer drought also affected the production of major fruit crops: apples -19%, pears -18% and peaches -13%. However, the lower supply and good quality of the product allowed more favourable prices on the market, following the disappointing sales results of the previous years. The wine sector
The prolonged drought and the high temperatures in the summer affected the 2012 grape harvest, resulting in a decrease of 4.6% of grapes harvested and 7.1% of wine produced compared to the previous year. From the 10.8 million quintals of grapes harvested in Veneto, just over 8 hectolitres of wine was obtained, most of which was marked as 'DOC - domination of controlled origin', 'DOCG - denomination of controlled and guaranteed origin' (52.7%) or 'IGT - Indication of geographic type' (40.7%). From the statements of production, the quantity of wine produced in Veneto amount to 9.2 million hectolitres in total, due to the processing of grapes purchased outside of the region.The figures taken from the Veneto Vineyard register indicated a slight increase in total area planted (+1.25%) reaching 76,340 hectares, around 30,100 of is located in the province of Treviso (39%) and 26,300 in the province of Verona (34%). The most cultivated grape in the region is the Glera, from which Prosecco wine is made, occupying a total surface area of around 21,000 hectares, equal to 27.7% of the total. Consequently, 'DOC Prosecco' is the most important denomination in terms of production (about 2.2 million quintals of grapes declared, equal to 38% of the total grapes of denomination of origin), followed at some distance by Valpolicella (820,000 q). Prosecco also occupies third place: there are 815,000 quintals of 'Docg Conegliano-Valdobbiadene' grapes declared, preceding the DOC wines of Verona, Soave, Bardolino and Custoza.
In 2012, the amount of wine grapes in Veneto rose. Overall, the average price increased by 10.5%, from 56 to 62 euro cents per kg. The highest increase was recorded in the province of Verona (+17.8%), where the average prices of Soave grapes (+33.9%) and Vapolicella grapes (+22.6%) increased significantly. In the province of Treviso, the price increase, equal to 8.5% on average, was mainly due to the good sales performances of the grapes suitable for IGT wine, both white and red. However, the grapes belonging to the most significant denomination of the Marca Trevigiana province, or rather DOC Prosecco, suffered a reduction of 24%. Prosecco also fell significantly in Padua (-34%), however the overall price increase was estimated to be +12.3% attributable to the good sales performance of the main DOC and IGT grapes, which increased from 20 to 40%. Venice experienced double digit increases for various types of grapes, especially black grapes.
As can be seen from the Ismea surveys on domestic producer prices, Veneto wines also seemed to have benefited from a significant increase during 2012 compared to the previous year. The annual averages of DOC and DOCG wines increased by 4% for Custoza, 14% for Gambellara, 18% for Soave, 9% for Bardolino, 16% for Merlot del Piave and 25% for Valpolicella classico. The production of Veneto IGT wines also increased: Chardonnay +21%, Pinot grigio +26%, Raboso +19% and Merlot +29%. As can be deduced from the preliminary data, there was also a rise in the export value of wine from Veneto, representing 30% of the national total, which reached 1.44 billion euros (+8.4%). (Table 2.3.3)
Animal husbandry
Milk production for the 2011/12 harvest reached a total of 11.14 million quintals, with a slight increase compared to the previous year (+0.7), reversing the downward trend of the previous 4 production harvests. A further increase is predicted for the 2012/13 harvest, which should allow the production of 11.28 million quintals. The number of farms dropped to 3,949 (-4%), while the production quota allocated in 2012 was equal to 11.38 million quintals. However, neither the national nor regional quantity allocated was reached in 2012 due to the compensation system, so there will be no charge to companies with individual surplus. (Figure 2.3.4)During 2012, farm-gate milk prices experienced a particularly uncertain and fluctuating trend. The average annual price was equal to 37-38 euros/100 litres (excluding VAT and quality), 4-5% lower than in 2011. The prices of Grana Padano and Asiago also declined, while the prices of Montasio were stable and the prices of Piave slightly increased.
Based on the national data available, it was estimated that in 2012 the production in Veneto of beef fell by 6% compared to the previous year. In fact, production continued to be adversely effected by the sharp rise in production factors, not only energy but also in feed due to the price increase of agricultural materials, and in farm animals due to the sharp increase in fattening prices. Household purchases of meat also declined. The number of farms active in Veneto in the mixed or meat farming sector fell by 4.1% compared to the previous year, and this decrease especially affected the small farms and also those with a number of animals greater than 100. Consequently, the cattle population of Veneto decreased by about 7,000 animals annually (-0.9%) added to by the reduction of the number of adult animals, while the number of calves increased. (Table 2.3.4) (Table 2.3.5)
Live animal imports also decreased, especially calves (-3.6%), mainly coming from France (390,000 animals), further strengthening its leadership (+3,9%). The reduction in the supply of cattle raised price lists in particular, with increases of average annual price at around 10%. (Table 2.3.6)
The availability of domestic pork meat was estimated to have grown by over 3% compared to 2011, due to both the increase of the number of animals slaughtered (+2.5%) and the average weight. In particular, sales of DOP (denomination of protected origin) salami (+3% in quantity and +2.5% in value) and non-DOP salami (+3.6% in quantity and +2.7% in value) grew, continuing the positive trend of 2011. The average annual price for the sale of heavy pigs in 2012 improved compared to the previous year, reaching 1.49 euro/kg at the market in Mantua (+5.3%).
Production by the national poultry industry increased compared to 2011, having increased in deadweight by 4.4% in the first 9 months, giving rise to a production higher than 1.25 million tonnes. The slaughter of chickens increased by 4.2%, particularly due to the performance of animals weighing more than 2 kg (+6.2% in deadweight). The slaughter of turkeys also increased significantly (+5% in deadweight) especially female turkeys (+15.2%). Domestic demand was also favourable and increased by about 2% in terms of quantity and 3% in terms of value, supporting the prices of boiler chickens, which recorded an average annual price on the Verona market equal to 1.17 euro/kg (cat. >2 kg), an increase of 1.8% compared to the average of 2011. However, the price trend of boiler turkeys was less positive, greatly affecting the increase of supply. The average annual value of male boiler turkeys fell to 1.34 euro/kg (-4.5%).
Sea fishery
According to the Veneto fish markets, 27,121 tonnes of fish were sold in the region in 2012, a decline of 2.4% compared to the previous year, corresponding to a turnover of 101.2 million euros (-10.9%). Taking into account the transactions recorded in 2012 on the main regional markets of Chioggia and Venice, an overall transit of 11,627 tonnes was recorded in Chioggia, equal to an overall value of 36.7 million euros (-11,6%). Quantities of fish were slightly up (+2.3%), due to the increase in local production, however, proceeds were down in all types considered. After the stability seen in the previous year, the fish market in Venice recorded a general decline in 2012. 9.395 tonnes of transit were recorded (-5.1%), while sales fell by 54.9 million euros, a decrease of 8.2% compared to 2011. The Veneto fishing fleet continued to lose boats, which, according to figures from the European Fleet Register as at 31st December 2012 consisted of 704 units operating in sea fishery. The annual decline was 20 boats, equal to -2.8%. The primary regional fisheries in 2012 increased to 3,043 units, with an increase of 27 companies (+0.9%) compared to the previous year. This increase was significantly influenced by fish farms (+5.5%), which outnumbered fisheries, in decline by 3.5%. (Table 2.3.7)
Table 2.3.1

Table 2.3.2
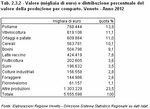
Figure 2.3.1
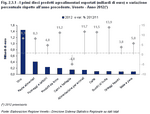
Figure 2.3.2
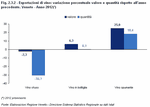
Figure 2.3.3
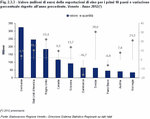
Table 2.3.3

Figure 2.3.4
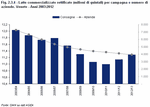
Table 2.3.4

Table 2.3.5

Table 2.3.6

Table 2.3.7

In Italy
'In 2012, thousands of businesses closed every day': with this, the media announced the publication of the official birth and mortality rates of Italian businesses in 2012, underlining the reduced vitality of business start-ups and the simultaneous acceleration of businesses leaving the Italian production system. In fact, in the last year, the business mortality rate was equal to that recorded in 2009 and the decline in the number of active businesses (-0.7%) was larger than that of 2009, the worst year since the beginning of the crisis, which was followed by a two year period of substantial equilibrium, when business mortality rates were under control. Overall, Italian businesses diminished by 0.7% per annum and the sectors that experienced the greatest difficulties were agriculture and the manufacturing industry, suffering a decline of -2.3% and -2.2% respectively compared to 2011. The construction industry also lost nearly 2% of active businesses, while the service industry continued to grow, albeit very weakly (+0.3%): accommodation and catering services grew by 1.9 % per annum, services to businesses by 1.1%, whilst transport decreased slightly (-1.1%), along with banking and financial activities (-0.5%) and trade (-0.3%), a sector greatly affected by the sharp reduction in Italian household consumption, which worsened in the last year.In 2012, the slow decline of sole traders, -1.2%, and partnerships, -1.3% continued. Corporations supported the economic trend of Italian businesses, growing by 1.3% per annum, however, growth was slow compared to the previous year 2011, in which there was a growth of 3 percent.
The difficulties faced by Italian artisan businesses remained pronounced, partly because of the high concentration of manufacturing and construction, which were more exposed to the recessive dynamics in recent years: for the fourth consecutive year, the craftsmanship sector closed with a negative balance, with the worst entrepreneurial balance since the beginning of the crisis (-1.6%).
Lazio was the only Italian region to close the year with an increase in active businesses, +0.7%; Campania, Trentino Alto Adige, Lombardy and Liguria withstood the reduction of businesses the most, all with negative variations of no more than 0.5%. Piedmont, Friuli Venezia Giulia, Abruzzo and Molise experienced the worst difficulties, all with one and a half per cent decline in businesses. (Figure 2.4.1)
In Veneto
Entrepreneurship in Veneto followed the national trend which saw a worsening of business survival in the last year: Veneto businesses in 2012 decreased by1.2% compared to the volume of the previous year, -1.1% excluding the agricultural sector. Active businesses in Veneto continue to cover 8.6% of national businesses, occupying the fourth position, after Lombardy, Campania and Lazio, in the regional ranking.
The birth rate of Veneto businesses continued to lower slightly in 2012, -2.2%, corresponding to 6.6 new businesses out of every 100 active businesses, a lower rate than the national average of 7.3 new businesses out of every 100 active. In the meantime, the mortality rate of Veneto businesses grew significantly, +12.4% per annum, reaching 7.8 ceased businesses out of every 100 active, exceeding the national rate for the first time since the beginning of the 2000s. The entrepreneurial balance of 2012 was equal to -1.3%, an even lower value than that recorded in 2009. (Figure 2.4.2) (Figure 2.4.3)
The dynamic of active businesses of Veneto in the last year confirms that the transformation of the regional production system is still in full swing. The service sector continued to be the driving force for the Veneto economy, occupying almost 54% of the regional production system (over 65% if you exclude the agricultural sector).
In 2012, the industrial sector continued to be affected by economic difficulties, -2.8% for manufacturing and -3.5% for construction companies, larger reductions than those recorded in the two years previous. Active businesses operating in services to businesses, hospitality and catering services and the banking and financing industry have continued to grow over the last three years. However, the economic recession caused a decline in the number of active businesses operating within the trade industry (-0.9% in 2012), the first sector to be affected by the decrease in domestic consumption observed in recent years, and transport (-1.7%).
The economic difficulties affected all the manufacturing sectors in Veneto: metallurgy, fashion, timber and furniture as well as paper and printing, which, as a whole, make up almost 60% of Veneto manufacture, closed 2012 with negative annual variations of at least 3 percent.
The jewellery, sporting goods, eyewear and food industries were more capable of coping in 2012: in fact, the jewellery industry closed the year in perfect equilibrium and the sporting goods sector finished with a contraction of just 1.1% per annum.
Sole traders and partnerships were the legal forms of businesses that were most affected by the difficult economic situation faced in 2012: sole traders in Veneto fell by 1.6% from the beginning to the end of the year and partnerships decreased by 1.8%. Corporations continued their upward trend, with an increase of 0.5% per annum, making up almost a fifth of Veneto businesses. Even smaller forms, mainly consisting of cooperatives and consortia, closed the year positively in 2012, with a growth of 2.5%.
Vicenza and Venice are both home to over 15% of total Veneto business and demonstrated the biggest difficulties at the end of 2012, -2.2% and -2.0% per annum respectively. Padua, Verona and Treviso, which collectively host 60% of regional active businesses, decreased by between 0.6 and 1 per cent. Belluno and Rovigo both closed the year with a decline of -0.8%. (Figure 2.4.4)(Figure 2.4.5)
Veneto craftsmanship
In 2012, artisan entrepreneurship recorded a fall of 1.9% in active businesses, thus approaching the performance of the most difficult year, 2009, which closed with a decrease of -2.2% per annum. Furthermore, only some service sectors experienced growth compared to the previous year: services to businesses (+4.3%) and accommodation and catering services (+3.1%). However, the main sectors of Veneto artisan entrepreneurship continued to show the signs of the economic crisis: in fact, the year closed with a -2.7% decrease for the manufacturing industry and -3.0% for construction, sectors that together make up almost 70% or regional craftsmanship.
Economic difficulties also continued during for transport (-2.5%) and trade (-1.4%).
Overall, the decline of Veneto craftsmanship in 2012 was slightly more intense than the National trend: (-1.6%); Lazio, Liguria and Trentino Alto Adige maintained the best equilibrium in a generalised moment of difficulty for the survival of businesses, especially for artisan entrepreneurship. (Table 2.4.1)
Regardless of the unfavourable crisis period, in 2011 Veneto tourism recorded record figures, and it would be hard to compare to the figures well above the trend achieved in recent years. However, in 2012, the great potential of the Veneto tourist supply, enhanced by the entrepreneurial ability of the operators and by a structured and synergic promotional plan, has enabled Veneto to maintain the record flow of visitors, totalling 15.8 million arrivals (+0.3%). The reduction in tourist stays in holiday resorts, now ongoing for several years, was reflected in the reduction of overnight stays -1.7%, while still maintaining the remarkable figure of around 62.4 tourist stays. (Figure 2.5.1) (Table 2.5.1)
Veneto offers a multi-faceted supply that includes tourism, culture, food and wine, identity, landscape and territory, able to meet every need in the best way possible. Thus, for several years the choice of Veneto as a holiday destination has maintained its position among the Italian tourist regions, as confirmed by the figures recorded for 2011, the latest year available at a national level, totalling 15.2% of arrivals and 16.4% of tourist stays in the whole peninsula.
The survey to which this analysis refers only takes into account those who enjoyed at least one overnight stay, i.e. the guests of Veneto accommodation facilities staying for recreation, business, wellness, care or religious reasons etc. All calculations are independent from daily tourism which, although not completely quantifiable, plays a significant role in the region's economy. (Figure 2.5.2)
International tourism, which only slowed at the beginning of the global economic crisis to resume timidly in 2009, is now represented by Italy's most loyal customers: Germans (+2.6% of tourist stays), Dutch (+5.3%), English (+9.3%), Swiss (+4.8%), Americans (+0.6%) and the Danish (+10%). The sharp increase in tourists from the so-called BRIC areas also continued, which now represent the 'new frontiers' on which to base new promotional strategies. (Table 2.5.2) (Table 2.5.3)
Veneto has always been appreciated for the variety of its tourism supply and the hospitality culture that distinguishes it. It is a region that has always focused on the needs of a continually renewing demand. Alongside the traditional offer, rich in natural heritage and stunning landscapes, historic towns and walled cities and of course the enchanting Venetian Villas, the region also offers the opportunity to practice sports such as golf, horse riding, bike rides and not to mention its offer of wellbeing, congress tourism and fishing tourism, all enriched with the flavours of our food and wine culture.
In summary, in 2012, there was an increase in all five areas of foreign tourism flows, however, Italian tourism flows decreased. Thus the sectors with a mainly foreign customer base recorded increases of both arrivals and tourist stays (as is the case for Lake Garda and the cities of art, which showed a new record) whilst those areas which mainly host Italians recorded an overall reduction of tourist flows (the mountains and thermal spas). With regards to the seaside, the increase of foreigners that make up 62.9% of customers (+0.9% of arrivals), was not enough to completely offset the decline in Italian visitors (-4.1%). (Figure 2.5.3) (Figure 2.5.4)
The main dynamics of international expenditure in 2012 by market and theme have been considered, using data from the Bank of Italy. Table 2.5.4 compares the weights on the international market of each reason for holidaying, both in terms of flows and expenditure. (Table 2.5.4)
With regards to an overall expenditure average in Veneto of 94 euros (which is still lower than the national average of 104 euros), it is worth noting that holidays for food and wine reasons or discovering and getting to know the area and the cultural landscape recorded the highest average expenditure per capita, reaching 156 euros and 137 euros respectively. Average expenditure related to other types of holidays regarding cultural practice, was also significantly higher than the overall expenditure average: 125 euros for traditional cultural reasons, mainly related to tourism in cities of art.
Therefore, 61% of revenue from international leisure tourism depends on a holiday offer that allows cultural and nature enjoyment of the regional territory.
With regards to the main markets of origin, table 2.5.5 compares their weight in terms of expenditure and overnight stays. (Table 2.5.5)
German tourists are structurally characterised by an average level of expenditure per capita lower than the regional average (72 euros against 94), which can also be explained by the high attendance of seaside and lakeside non-hotel accommodation facilities (primarily campsites). Such factors explain the fact that the economic weight of this market (27.1%) is lower than that of those expressed in overnight stays (35.7% of overnight stays enjoyed exclusively for holiday reasons). However, it should be noted that expenditure is much more reliant on local products than any other segments. The positive performance recorded in 2012 was especially due to seaside and food and wine holidays as well as holiday proposals that include the enjoyment of culture and the territory.
All the markets with traditionally higher expenditure profiles (Japan, the USA and the United Kingdom) recorded an increase in average expenditure per capita, strengthening their economic weight. However, the most significant data regards the good result recorded by the Region regarding the BRIC markets, which represented over 5% of all holiday expenditure in 2012, far exceeding the weight of Japan and significantly close to the share held by the French market.
Veneto offers a multi-faceted supply that includes tourism, culture, food and wine, identity, landscape and territory, able to meet every need in the best way possible. Thus, for several years the choice of Veneto as a holiday destination has maintained its position among the Italian tourist regions, as confirmed by the figures recorded for 2011, the latest year available at a national level, totalling 15.2% of arrivals and 16.4% of tourist stays in the whole peninsula.
The survey to which this analysis refers only takes into account those who enjoyed at least one overnight stay, i.e. the guests of Veneto accommodation facilities staying for recreation, business, wellness, care or religious reasons etc. All calculations are independent from daily tourism which, although not completely quantifiable, plays a significant role in the region's economy. (Figure 2.5.2)
Origins and destinations
The stability of Veneto tourism is due to a growing interest of foreign customers, offsetting the reduction of Italians holidaying within their own country, especially the residents of Veneto themselves. Arrivals of foreigners increased by 2.2% and tourist stays by 2.7%, while Italian arrivals decreased by 2.9% and tourist stays by 8.7%.International tourism, which only slowed at the beginning of the global economic crisis to resume timidly in 2009, is now represented by Italy's most loyal customers: Germans (+2.6% of tourist stays), Dutch (+5.3%), English (+9.3%), Swiss (+4.8%), Americans (+0.6%) and the Danish (+10%). The sharp increase in tourists from the so-called BRIC areas also continued, which now represent the 'new frontiers' on which to base new promotional strategies. (Table 2.5.2) (Table 2.5.3)
Veneto has always been appreciated for the variety of its tourism supply and the hospitality culture that distinguishes it. It is a region that has always focused on the needs of a continually renewing demand. Alongside the traditional offer, rich in natural heritage and stunning landscapes, historic towns and walled cities and of course the enchanting Venetian Villas, the region also offers the opportunity to practice sports such as golf, horse riding, bike rides and not to mention its offer of wellbeing, congress tourism and fishing tourism, all enriched with the flavours of our food and wine culture.
In summary, in 2012, there was an increase in all five areas of foreign tourism flows, however, Italian tourism flows decreased. Thus the sectors with a mainly foreign customer base recorded increases of both arrivals and tourist stays (as is the case for Lake Garda and the cities of art, which showed a new record) whilst those areas which mainly host Italians recorded an overall reduction of tourist flows (the mountains and thermal spas). With regards to the seaside, the increase of foreigners that make up 62.9% of customers (+0.9% of arrivals), was not enough to completely offset the decline in Italian visitors (-4.1%). (Figure 2.5.3) (Figure 2.5.4)
International tourism expenditure in Veneto in 2012 (Note 2)
In 2012, the expenditure of international tourists in Veneto exceeded 5 billion euros for the first time, with an increase of 5.3% compared to the previous year and 2.6% compared to 2007, which was the best performance before the crisis. Therefore, the decline in international tourism revenue has finally recovered, having reached its minimum in 2010 of 4.3 billion euros. The main dynamics of international expenditure in 2012 by market and theme have been considered, using data from the Bank of Italy. Table 2.5.4 compares the weights on the international market of each reason for holidaying, both in terms of flows and expenditure. (Table 2.5.4)
With regards to an overall expenditure average in Veneto of 94 euros (which is still lower than the national average of 104 euros), it is worth noting that holidays for food and wine reasons or discovering and getting to know the area and the cultural landscape recorded the highest average expenditure per capita, reaching 156 euros and 137 euros respectively. Average expenditure related to other types of holidays regarding cultural practice, was also significantly higher than the overall expenditure average: 125 euros for traditional cultural reasons, mainly related to tourism in cities of art.
Therefore, 61% of revenue from international leisure tourism depends on a holiday offer that allows cultural and nature enjoyment of the regional territory.
With regards to the main markets of origin, table 2.5.5 compares their weight in terms of expenditure and overnight stays. (Table 2.5.5)
German tourists are structurally characterised by an average level of expenditure per capita lower than the regional average (72 euros against 94), which can also be explained by the high attendance of seaside and lakeside non-hotel accommodation facilities (primarily campsites). Such factors explain the fact that the economic weight of this market (27.1%) is lower than that of those expressed in overnight stays (35.7% of overnight stays enjoyed exclusively for holiday reasons). However, it should be noted that expenditure is much more reliant on local products than any other segments. The positive performance recorded in 2012 was especially due to seaside and food and wine holidays as well as holiday proposals that include the enjoyment of culture and the territory.
All the markets with traditionally higher expenditure profiles (Japan, the USA and the United Kingdom) recorded an increase in average expenditure per capita, strengthening their economic weight. However, the most significant data regards the good result recorded by the Region regarding the BRIC markets, which represented over 5% of all holiday expenditure in 2012, far exceeding the weight of Japan and significantly close to the share held by the French market.
Figure 2.5.1

Table 2.5.1

Figure 2.5.2
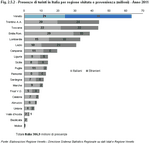
Table 2.5.2
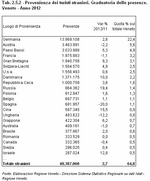
Table 2.5.3
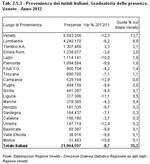
Figure 2.5.3
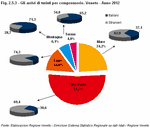
Figure 2.5.4

Table 2.5.4

Table 2.5.5

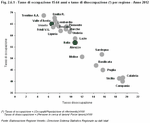
After a 2011 which showed signs of recovery, in 2012 the difficulties of the labour market were increasingly evident: in Italy, the unemployment rate increased yet again, recording a value of 10.7% against 8.4% the previous year, whereas the employment rate remained at the 2010 and 2011 levels (56.9%). Veneto recorded an employment value in line with the previous year, equal to 65%, and an unemployment rate of 6.6%, the highest of the decade, but in comparison with other regions, Veneto has the fourth highest employment rate and the second lowest unemployment rate. Trentino Alto Adige occupies the lead position, while the situation of the South was increasingly more difficult, especially in Campania, Calabria and Sicily where just 40% of people aged 15-64 years old work regularly and the unemployment rate is 19%.
Young people are the most affected by the crisis: within a few years, unemployment rose by 13 percent and the number of young people in Veneto looking for work without being able to find it reached a little less than 36 thousand units in 2012. However, it should be pointed out that the situation of the young people of Veneto is among the most favourable in Italy: in fact, with an unemployment rate of 23.7% it is classified as the Italian region with the second lowest levels of unemployment, with Trentino Alto Adige being the first with 15.2%. In general, unemployment in Italy is high, with a rate of 35.3% among the labour force, with some regions even reaching 50% or exceeding it: this is the case of Calabria and Sicily where half of the labour force are in search of work. (Figure 2.6.1)
In 2012, the CIG recorded a new low since 2010: authorised CIG hours in Italy totalled over one billion, 12% more than the previous year; this amount also grew in Veneto, with a figure almost equal to 103 million, over 18% more than that granted in 2011. In particular, requests for CIG ordinaria (cigo, ordinary redundancy fund) and CIG in deroga (redundancy fund in derogation) increased, while requests for CIG straordinaria (cigs, special redundancy fund) decreased slightly.
However, it should be noted that a large quantity of hours requested were not really used, indicating that some requests were just a precautionary measure made by the companies; in fact, in 2012 in Italy, the share of authorised hours actually used compared to those requested was equal to 47.7%, thus totalling 520 million hours.
In detail, in 2012, out of the 103 million hours paid using the redundancy fund authorised in Veneto, 70% were granted within the manufacturing sector. This sector also recorded the highest ratio between number of hours granted and number of employees: it can be estimated that, on average, 121 hours were used per worker in the manufacturing sector, compared to 48 hours granted on average to the total of workers in Veneto.
Construction and trade are the other two sectors most supported by these social safety nets: 13 million hours of CIG were granted to construction workers, equal to 12.6% of the total, while around 7.5 million hours (7%) were granted to workers operating in the trade sector.
However, not all sectors recorded the same increases: compared to 2011, in 2012 only 9% more hours were requested for agriculture and manufacturing activities, while hotels and restaurants were forced to ask for almost double the hours granted the previous year (+89%). Even the trade sector and the transport, storage and communication sector recorded significant increases, equal to 61% and 77% respectively. (Table 2.6.1)
Young people are the most affected by the crisis: within a few years, unemployment rose by 13 percent and the number of young people in Veneto looking for work without being able to find it reached a little less than 36 thousand units in 2012. However, it should be pointed out that the situation of the young people of Veneto is among the most favourable in Italy: in fact, with an unemployment rate of 23.7% it is classified as the Italian region with the second lowest levels of unemployment, with Trentino Alto Adige being the first with 15.2%. In general, unemployment in Italy is high, with a rate of 35.3% among the labour force, with some regions even reaching 50% or exceeding it: this is the case of Calabria and Sicily where half of the labour force are in search of work. (Figure 2.6.1)
Support from the redundancy fund
In order to support families in difficulty, once again, the cassa integrazione guadagni (CIG, the redundancy fund) has played an increasingly important role in recent years of ensuring an income to people suspended from work or who work fewer hours, preventing the loss of the professional capital of businesses and avoiding the depressive effects on consumption. In 2012, the CIG recorded a new low since 2010: authorised CIG hours in Italy totalled over one billion, 12% more than the previous year; this amount also grew in Veneto, with a figure almost equal to 103 million, over 18% more than that granted in 2011. In particular, requests for CIG ordinaria (cigo, ordinary redundancy fund) and CIG in deroga (redundancy fund in derogation) increased, while requests for CIG straordinaria (cigs, special redundancy fund) decreased slightly.
However, it should be noted that a large quantity of hours requested were not really used, indicating that some requests were just a precautionary measure made by the companies; in fact, in 2012 in Italy, the share of authorised hours actually used compared to those requested was equal to 47.7%, thus totalling 520 million hours.
In detail, in 2012, out of the 103 million hours paid using the redundancy fund authorised in Veneto, 70% were granted within the manufacturing sector. This sector also recorded the highest ratio between number of hours granted and number of employees: it can be estimated that, on average, 121 hours were used per worker in the manufacturing sector, compared to 48 hours granted on average to the total of workers in Veneto.
Construction and trade are the other two sectors most supported by these social safety nets: 13 million hours of CIG were granted to construction workers, equal to 12.6% of the total, while around 7.5 million hours (7%) were granted to workers operating in the trade sector.
However, not all sectors recorded the same increases: compared to 2011, in 2012 only 9% more hours were requested for agriculture and manufacturing activities, while hotels and restaurants were forced to ask for almost double the hours granted the previous year (+89%). Even the trade sector and the transport, storage and communication sector recorded significant increases, equal to 61% and 77% respectively. (Table 2.6.1)


