(Note 2) The Regional Agency for Environmental Prevention and Protection in Veneto (ARPAV) has an integrated, networked system for environmental monitoring that makes it possible to have a coherent and overall understanding of the environmental phenomena taking place in the Veneto region. This information is then used by the institutions that have to come up with plans to carry out regional and local policies, companies that on a daily basis have to deal with respecting environmental laws regarding polluting substances, as well as regular citizens who now, more than ever before, are interested in understanding and respecting the environment they live in.
The environmental monitoring network, which is managed for Regione Veneto by ARPAV
(Note 3), spans many different environmental matrixes. The network is the fruit of a long process that has involved implementing norms that have evolved over time and which, once implemented, have created a tight network of points all over the region for monitoring various phenomena. Currently ARPAV monitors the following environmental phenomena: air, water, waste, soil, energy, physical agents, food and drink, meteorology and climate, snow and avalanches. The following section focuses on the networks for monitoring air and water quality.
One of ARPAV's activities is checking atmospheric pollution
(Note 4). In order to have adequate information on the state of air quality, ARPAV has a tight network spread throughout the region that can provide continuous and precise data regarding the main pollutants of the atmosphere in compliance with the laws in force. Air quality must be monitored according to precise technical criteria and in specific areas around the region
(Note 5). These criteria are set for the various pollutants, i.e. concentration in the air of sulphur dioxide, nitrogen oxide, carbon monoxide, PM10 fine particles, benzene, ozone, arsenic, cadmium, mercury, nickel and polycyclic aromatic hydrocarbons in the air.
In order to gather information on air quality that is representative of the Veneto region, from 2000 to 2006 a network requalification and optimisation project was carried out. The project was co-financed by DOCUP objective 2 - "Optimisation of the network for monitoring air quality and mapping remote areas". During this project, redundant stations were shut down and new Electronic Control Units (ECUs) were set up in sites that were considered to be strategic.
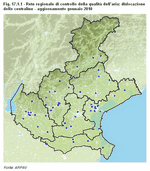
Currently the network for monitoring air quality has 56 stations subdivided into 3 types: traffic stations (13 ECUs that provide data on areas where there are the highest levels of pollution in order to identify the most critical cases of air pollution); land stations (38 ECUs that provide data regarding the average exposure to pollution of people in urban areas, as well as rural ones, which are monitored taking into consideration the objectives for the protection of vegetation and ecosystems); and industrial stations (5 ECUs that monitor the air quality in the proximity of particularly large or important industrial areas
(Figure 17.1.1).
The location of the monitoring stations is only the first essential requirement for managing a network according to the specifications of the European Community, which are laid out in the document "Criteria for Euroairnet". The data coming from every station must be reliable and comparable with data from other sites where sampling has been done. The instrumentation used for the monitoring undergoes regular maintenance and periodic calibration and quality control tests, which are carried out under the supervision of ARPAV's Osservatorio Regionale Aria (Regional Air Observatory). It is important to point out that the set up at each station is regularly updated; currently ARPAV is planning to install new monitors for the PM2.5 particle
(Note 6).
The configuration of this network makes it possible to continuously check the main parameters that are indicators of atmospheric pollution and, thanks to the information gathered in the past years, provide data that can form a firm basis for planning future activities and supporting local governments in their decision-making process (reclamation plans, action plans, reduction plans), in addition to providing information to those who live and work in the region
(Note 7).
@2 Water monitoring network
Given the complexity and delicacy of the water component, differently structured monitoring is required for each of the various spheres, i.e. bathing waters, marine-coastal waters, transition waters, inland surface waters, and groundwaters, according to the relative legislation
(Table 17.1.1).
Bathing waters
In 2009 the network that monitors bathing areas (
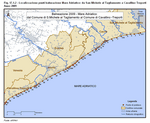
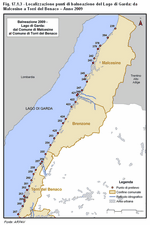
SIRAV 07 Network) had a total of 167 monitoring sites. In each of these sites, the following activities were carried out: chemical-physical surveying, visual/olfactory inspections, and water sampling for microbiological analysis. In all, 2,369 samples were taken, 2,124 of which were routine and 245 supplementary
(Note 8) (Table 17.1.2),
(Figure 17.1.2) and
(Figure 17.1.3).
Transition waters
For the year 2010, the network that monitors transition waters (
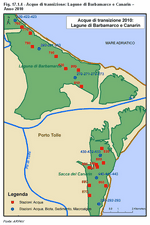
SIRAV 06 Network) is made up of 110 sampling stations distributed between the Laguna di Caorle, Laguna di Venezia and Laguna del delta del Po. In the Laguna di Venezia, ARPAV only monitors the water to determine the conformity of the waters for the life of shellfish. In the other lagoons, in addition to this monitoring, investigations are carried out for the environmental classification of water bodies according to Ministerial Decree DM 131/2008. The monitoring in this network is operational and aims to establish the state of the water bodies that are considered "at risk" of not satisfying the requirements for environmental quality, to evaluate variations in their state following specific initiatives and to classify them. Chemical analyses are carried to determine the chemical state and analyses on elements that indicate biological quality, such as phytoplankton, macroalgae and macrozoobenthos, are carried out using a set number of samples (420 for the year 2010) to determine the ecological state of the waters
(Figure 17.1.4).
Marine-coastal waters
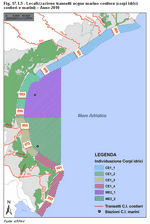
For the year 2010, the network that monitors marine-coastal waters (
SIRAV 2005 Network) is made up of 76 sampling stations distributed along the coasts of the Veneto region. Analyses are carried out to determine the environmental classification of water bodies (according to Ministerial Decree DM 131/2008) and conformity of the waters for shellfish, and to monitor algae, i.e. to search for algae that are potentially toxic for bathers. Monitoring in this network is operational and similar to that carried out for transition waters, as just described above. Chemical analyses are carried out to determine the chemical state, and analyses on elements that indicate biological quality (EQB), such as phytoplankton and macrozoobenthos, are carried out by using a set number of samples (537 for the year 2010) to determine the ecological state of the waters; in addition, 74,500 on-site checks are planned for 2010
(Figure 17.1.5).
Marine weather buoys
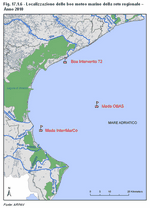
The coastal observation system is made up of a buoy (called "Experimental Camp") and two marine weather beacons
(Note 9) ("Adige" and "Abate"). This set-up makes it possible to continuously collect meteorological data, chemical-physical data and the current metres of the water column. Graphs of the data are regularly updated on the Agency's institutional website
(Figure 17.1.6).
Inland surface waters
The system for monitoring inland water courses (rivers and lakes)
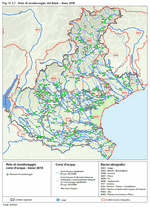
(Note 10) involves analysing elements of biological quality (macroinvertebrates, macrophytes and diatoms), chemical parameters and physical-chemical parameters. The ecological and chemical states are monitored using surveillance monitoring, which is carried out for all of the inland water courses, and operational monitoring, which is only carried out on at-risk water courses. The aim of surveillance monitoring is to evaluate long-term variations caused by both natural phenomena and widespread human activity. The operational monitoring aims to understand the state of bodies of water that have been identified as "at risk" of not satisfying the criteria for environmental quality, to evaluate the state of these waters following initiatives, and, finally, to classify them. In order to provide an understanding of the overall state of all of the inland surface waters located throughout the region, the surveillance monitoring network has 60 stations in river water bodies and 3 in lake water bodies, all of which monitor all of the elements related to water quality.
The operational monitoring network monitors 275 river water bodies and 12 lake water bodies to survey the parameters that refer to the most significant quality elements the various water bodies are most subject to
(Table 17.1.3). Regarding the specific locations and their focus, there are 27 sites that monitor drinking water (22 in river water bodies and 5 in lake river bodies) and 80 sites that monitor water for marine animal life (77 in river water bodies and 3 in lake river bodies)
(Figure 17.1.7).
Groundwaters
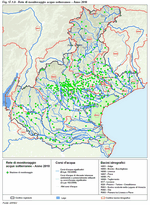
For the year 2010, two monitoring networks have been set up to monitor the qualitative-quantitative state of groundwaters. The networks have a total of 437 sampling stations (
SIRAV 2004 Network) where both quantitative measurements and chemical tests are conducted
(Note 11). The chemical monitoring network employs both surveillance monitoring and operational monitoring. In addition to the parameters used for the surveillance monitoring, twice a year the operational monitoring will look for a series of specific parameters that regard the pressures on groundwaters identified in a risk analysis (in particular pollution caused by agriculture and urban use of land)
(Figure 17.1.8).


