 Public utilities (Note 1)
Many of the public utility services are not provided directly by the Public Administration, which deals mainly with services that do not involve sales; instead they are run by State-controlled bodies, semi-public agencies or other ventures that represent the
external PA sector (Note 2) and, together with the Public Administration itself, make up the
wider public sector.
These services go by the name of
public utilities and include energy and gas distribution, public transport, the collection and disposal of municipal waste, and the integrated water cycle.
The market for these services is not able to self-regulate itself through supply and demand, so it is necessary to keep a check on companies that operate in a monopoly, e.g. as regards rates and service quality. This way it is possible to manage external services without necessarily directly producing them through State-owned companies.
There are services, such as the energy and gas supply chain, where the monopoly is limited to the distribution network; for others however, such as water, waste and public transport, it is impossible to subdivide infrastructure and supply more cleanly. In these cases, it is technically impossible to separate network and service, thus creating economies of scale that are more bound to local distribution networks. For these reasons, only the environmental
utilities maintain the features of local public services, while energy utilities tend increasingly to be treated as
industrial commodities, consequently their relationship with individual areas has a more commercial purpose.
Statistical analysis of the
public utility system is far from easy and the informaiton sources used to analyse it vary in accordance with the feature being analysed. A Unioncamere survey on companies in which local authorities had a stake revealed that in 2007 Italy had 1493 businesses active in the local utility sector. This sector, which includes about 29% of all semi-public companies, has remained stable in terms of numbers in recent years
(Table 15.2.1).
Using the Unioncamere database, Ires Veneto
(Note 3) extracted all of the semi-public companies in the region. Analysis was limited to industrial local public service companies only, of which there were 97. The most numerous group was water and waste services, which inherited fragmented management organisations and tend to maintain a link with the local area. In the energy and gas sectors, where the search for economies of scale is more pressing, mergers occurred more quickly and the number of companies is lower.
For comparative analysis with other regions, the Observatory of Local Public Services of CNEL
(Note 4) is a useful information framework. For each region, selection criteria involves looking at the companies in all capital municipalities and in other municipalities in order of population size, until 50% of the regional population is reached. This criterion provides comparative analysis that is much more homogeneous than analysis conducted on all of the Local Public Service companies; it also focuses attention on the areas where public services are more likely to be run as larger public utilities
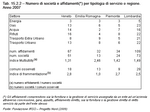
(Table 15.2.2).
Eighteen of Veneto's municipalities were examined, including its seven provincial capitals: 67 of the public utility services in these municipalities had been franchised
(Note 5), with them being managed or provided by 51 companies; the State had a direct stake in almost all of these companies
(Note 6). Even concentrating analysis on the region's main municipalities confirms that there is a higher fragmentation in environmental, water and waste services than in energy and transport.
In comparison with other regions, only Lombardia has a higher number of franchises and companies than Veneto, but this also depends on the larger size of its population and urban areas. The number of franchises and companies is significantly lower in Emilia Romagna and Piemonte. This comparison highlights the merger policy in Emilia Romagna, which has fewer than half of Veneto's franchises and one-quarter of its companies, although its size and urban areas are similar to Veneto's. The far lower number of major municipalities in Piemonte also means that there are fewer franchises and companies; however, though suppliers are fewer, these municipalities are served by a broader range of public services than in Veneto. Figures for sector and local integration within Local Public Services also reveal the differences between Emilia Romagna and Italy's other regions. Each region has a similar level, even though Veneto is in last place in the rankings. While
the multiutility index measures the search for economies of scope through the formation of service companies in more than one sector,
the fragmentation index measures the search for economies of scale through the franchising of services to the same company in a range of areas. Against this backdrop, although Veneto is the region with the lowest level of internal integration within the industrial public services system, it is in line with Piemonte and Lombardia.
It is nevertheless likely that the new normative framework on Local Public Services will speed up the process of industrial growth in Veneto as well; it is also possible that inter-regional alliances will be made.
In structural terms, there are no official sources that quantify the human capital and spending linked to these particular semi-public companies. Nevertheless, below, we attempt to analyse the
public utility sector from the point of view of the services it offers (e.g. energy, gas, water, waste management etc.). Banks are also considered alongside these sectors as they act as a cushion between suppliers and users, be they families, businesses or public bodies.
 The supply of electricity and gas
On 1 July 2007 in Italy and throughout Europe, the energy market was opened up with the introduction of EU Directives 54 (electricity) and 55 (gas) of 2003.
Following the opening of the electricity market to households (the gas market was opened up in 2003), Italy's Electricity and Gas Authority tried to intervene as regards the information that customers receive about the various offers available on the market. Despite this, as we will see, citizens complain that they still have some difficulty getting information out of electricity boards. In response, the Authority set up specific customer services such as a
"Customer helpdesk", a
call-centre at Acquirente Unico, the company that manages the information on liberalisation, regulation and complaints, and
"Trova-offerte", an interactive website that compares prices.
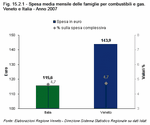
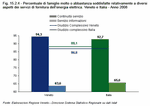
In 2007, Veneto families spent a monthly average of €144 on fuel and electricity, a figure that is higher than the Italian average €115.6. This difference is due to the higher consumption of gas for heating, which has a more notable effect on costs than in other parts of the country. There is a similar situation throughout the North-East, where average spending on gas exceeds €69, €11 more than in the rest of Italy.
Overall, fuel and gas account for 4.7% of household spending, both on a regional and a national level
(Figure 15.2.1).
Electric energy
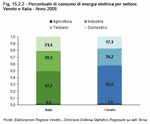
In 2008, Italy had 131 electricity suppliers that managed a national grid of more than 1.2 million km, more than 89,000 km of which cover Veneto. Three electricity suppliers work in Veneto: AGSM VERONA S.P.A., A.I.M. SERVIZI A RETE S.R.L. and ENEL DISTRIBUZIONE S.P.A. There is still a deficit between production and consumption of more than 40,000 GW, which is bridged by importing electric energy from abroad, about 11.8% of the electricity consumed. The situation in Veneto is more critical: it has an energy demand of 33,594 GW, but generation stops at about 16,300 GW, consequently the rest, more than 51% of the energy demand, is imported. This situation is fairly common in Italy's northern regions where industry is highly developed, e.g. in Piemonte and Lombardia, both of which are unable to meet demand on their own. This is partly explained by the fact that industry needs huge quantities of electricity. In Veneto, industry accounts for 56% of regional demand, a considerably higher value than the national average of 47%.
In 2008, Veneto, with its 6,455 kWh of electricity consumed per capita, was distinctly more of an 'energivore' than the rest of the country (5,313 kWh); however, sector analysis reveals that highest consumption came from production sectors, in particular industry, which as mentioned above requires huge amounts of electricity. On the other hand, the household sector uses energy more sparingly, although the climate on the Paduan plain is often inclement. These figures afford an alternative point of view to the economic indicators, suggesting that although Veneto is a highly developed area with high energy consumption in industry, it is also careful to reduce waste wherever possible and to optimise energy sustainability
(Figure 15.2.2).
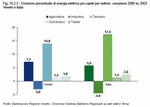
Between 2003 and 2008, consumption of electricity per resident grew in all sectors, apart from in industry, where it fell due to the difficult economic situation. This can be seen at both national and regional level. In Veneto, variations are more contained, apart from in agriculture, where consumption per capita rose by 7.2% in 2008 compared with 5.9% in the rest of Italy
(Figure 15.2.3).
Opinions on the electricity supply service range from somewhat to very satisfied in almost 87% of Veneto families and in 88% of Italian ones. More specifically, one of its strong points seems to be its continuity, with more than 94% of Veneto families stating they were somewhat or very satisfied, a figure slightly higher than the national average of 92.7%. On the other hand, communication policy, i.e. information on rates, supply conditions, etc. still needs some work: only 63.6% of Veneto families were somewhat or very satisfied, a figure that is slightly lower than the Italian average of 65.6%. This also concerns access to Enel helpdesks and to the local electricity board. In Veneto, only 22.8% of households stated that they did not have any difficulty reaching them, while almost 55% said they had a little or a lot. These figures suggest that on the one hand electricity supply was good, however, on the other there is still some way to go to improve relations between supplier and customer in terms of information and helpdesk accessibility
(Figure 15.2.4).
Gas
In 2008, the gas transmission system was divided into national and regional grids that were run by a total of 9 companies. Snam Rete Gas is the largest and it runs 8,779 km of the national network and 22,695 of the regional network, for a total of 31,474 km, or 94% of Italy's entire gas transmission system. The second largest company in terms of kilometres is SocietÓ Gasdotti Italia with 120 km of the national network and 1,162 km of the regional network. In 2008, Edison Stoccaggio also started operating across the country and it has 83 km of the national network, in particular the Cavarzere-Minerbio gas pipeline, which acts as a link between Rovigo's new regasification plant and the national network. The remaining six companies work on the regional network only
(Table 15.2.3).
Veneto is covered by 2,814 km of gas pipelines, i.e. 8.4% of the national total, and it has 3 gas-transport companies. The total volume of gas delivered in the region to its various consumers is equal to 6.7 billion cubic metres (Note 7), i.e. 8% of the national total. This is a major figure that is common to other northern regions, such as Piemonte and Lombardia, which consume high levels of natural gas to fuel central heating in local homes, given that the climate is colder there than in the rest of Italy. This also confirms what was previously said about the high costs incurred by northern Italian families for fuel.
The falling trend of the last few years in the amount of natural gas produced in Italy and in its territorial waters continued into 2008: 9.2 billion cubic metres, compared to 9.7 in 2007 and 11 in 2006.
This fall also leads to a dependence on imports of natural gas from abroad, which today cover almost 90% of national requirements.
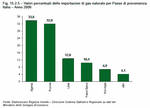
Sixty-six percent of Italy's supplies from abroad come from Algeria and Russia; behind these comes Libya, which accounts for 12.8% of imports. The number of sources will increase in 2010 with new gas supplies coming from Qatar, which will be made possible when the Liquefied Natural Gas (LNG) Terminal opens offshore of Rovigo. By 2012, additional supply channels are expected to open with gas arriving from the Middle East and from Caucasus countries
(Figure 15.2.5).
All consumers have been able to choose their own natural-gas supplier since January 2003.
In 2008, 1.2% of customers changed gas supplier, i.e. 34.9% of the volume of gas consumed. One interesting figure regarding customers who change supplier is that it is the larger customers that tend to switch. This is because larger customers consume more and therefore they are always on the look-out for a chance to make a saving. In terms of clients, 93% were still on the protected market governed by the Authority, while 7% were served by the free market. Being on the free market is still a prerogative of large customers and it has not yet involved the market on a large-scale (just over 4% of household customers are on the free market).
Essential requirements for quality of service are continuity and safety. Italy's energy and gas authority has established some benchmark safety levels so that it can continually assess this important feature. In terms of end users, overall 90.4% of Veneto households declare that they are somewhat or very satisfied with their gas-supply service, which is just below the Italian average. A higher percentage of households, however, are very satisfied with the service: 22.2% in Veneto compared with 19.7% in the rest of Italy.
If we look more closely at some of the aspects regarding service, we can see that satisfaction indices are above 90% in almost all cases. The only characteristic that does not fully convince families is the level of information about rates, supply terms and connections: satisfaction falls to around 70%, both at national and regional level
(Figure 15.2.6).
As regards knowledge about market liberalisation and thus the opportunity to change supplier, even though the free market is still a prerogative of large consumers, less than 30% of Veneto families stated that they knew nothing about it. The corresponding figure for Italy, 40%, is much higher. Opinions on access to gas-company helpdesks suggests that there is still room for improvement. In Veneto, almost 60% of households declared that they had "a little" or "a lot" of difficulty reaching the office of their gas suppliers, while 26.9% stated that they had "no" difficulty, a figure equal to the national one. As with electricity, gas consumers are also happy with supply and safety, but the relationship between companies and citizens needs to be improved.
 Water network services
Veneto's water network service, see Chapter 17, guarantees a good overall water supply to its customers.
In 2008, Veneto drew about 730 million cubic metres of water for potable use, 8% of the national total. Applying this to the population, 149.4 cubic metres of water were drawn for each Veneto resident, a figure almost 1.5 cubic metres per capita lower than the national average.
Once water has been drawn, it is turned into drinking water wherever necessary. This process is not indispensabile if the water is good quality at the source. In general terms, the lower the percentage of water purified, then the better the quality of an area's water resources. In 2008, Veneto purified 18% of its water, a promising figure, especially when compared to the figure for the rest of the country, 32%. This aspect is linked to an area's water resources. Alongside this, however, are also considerations about how efficiently water resources are used. The water that is actually delivered to the end consumer as a proportion of the water put into the distribution network highlights leaks and dispersions in the network, and thus provides an indicator of functionality. In Veneto, this indicator is 70%, higher than the national average by more than two percentage points, and a figure that places it seventh in the regional rankings for water efficiency
(Table 15.2.4).
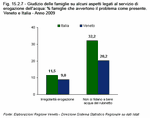
Households have a sound opinion of service quality: in 2009 only 9% declared that they had a problem with the water supply in their local area, and 20.2% said that they did not think the tap water was safe to drink; these figures show a decidedly better situation than in the rest of Italy, where the same problems concern 11.5% and more than 32% of households respectively
(Figure 15.2.7).
Opinions regarding the cost of the water-supply service are positive overall, at least in Veneto. Here, almost 56% of families stated that the costs are appropriate to the service received, whereas the Italian average stands at 44.8%. There is also a major difference between Veneto and Italy in terms of the people who think costs are high: 32.8% and 47% respectively. This figure is partly explained because water resources vary throughout Italy. Veneto has abundant water resources, so water supply may be in some way facilitated in terms of costs in comparison to other regions affected by severe shortages and where costs of water supply are higher. It may also be due to the awareness of citizens, which changes according to the financial situations in the various geographical areas
(Figure 15.2.8).
Although the situation is favourable overall, the region's system of aqueducts needs improving so that the network can be strengthened and purification and supply can be made even more efficient.
 Municipal waste management
Over the last decade, Veneto's waste management has undergone continual transformations in terms of legislation, technology and impact on daily life, which have affected public administrations, private enterprises and citizens. The original idea was to reduce the costs of disposing of waste, reduce its production per capita, recycle where possible and produce energy from incineration. As part of this, one objective was to minimise the waste being taken to dumps, and so much emphasis has been placed on separate waste collection. The entire system is known as "integrated waste management".
The results achieved so far are encouraging: between 2002 and 2007, the total production of municipal waste per capita, though not falling, grew very slightly in Veneto, from 480.7 kg per resident to 490.9 kg, i.e. +2.1%, a figure much lower than the national one which grew by 4.5%, coming close to 546 kg of waste produced per resident in the last year considered.
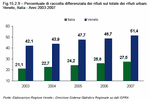
In 2007, Veneto was the second leading region in Italy, behind Trentino Alto Adige, for the separate collection of municipal waste; it achieved more than 51%, two years ahead of the 50% target by 31 December 2009 established by current law. This figure also places Veneto way ahead of the national average, which stood at 27.5%
(Figure 15.2.9).
In 2008, Veneto made further improvements on the previous year by upping its performance by three percentage points to achieve a level of separate waste collection equal to 54%.
These policies, which are geared towards economising and protecting the environment, have without question had repercussions on household habits. The "on-the-street" system of traditional rubbish bins is progressively being replaced by "door-to-door" waste collection. In 2008, 356 Veneto municipalities ran a door-to-door collection service, more than 61% of the total; this figure is important if we consider that in 2002 less than 28.7% of municipalities did so. This high percentage of municipalities running a
door-to-door collection service covers an equal percentage of the resident population (60.4%), a sign that it is becoming the norm for Veneto households
(Figure 15.2.10).
After an initial teething period, it appears that local residents are getting to grips with this new waste disposal service by becoming an active part of the entire system, which has grown into an integrated nework. Collecting waste separately is becoming increasingly common; indeed, in 2008, more than 80% of Veneto families declared that they separated their waste into the main types of materials collected, with peaks of 92.6% and 93.3% for paper and glass respectively. These figures place Veneto in an enviable position on a national level and show how the investments and environmental awareness campaigns of local administrations are reaping the rewards
(Figure 15.2.11).
Although Veneto seems to be headed towards greater efficiency in waste collection and management economy, households retain that the costs that they are paying for their municipal waste collection service are too high. This may be a sign that citizens have not understood the planning and financial efforts that regional administrations are making within this sector: in 2008, 64% of household stated that the costs of waste management were high and only 31.3% thought they were appropriate. Though these figures are indeed high, they are still encouraging when compared to figures for the rest of Italy where 70% of households retain that costs are high. Opinions on access to bins was positive, with more than 81.5% of Veneto residents declaring that they had no problem reaching them, a figure that is also higher than the national average.


