|
11.1 - The business cycle
 Italian traders' opinions Italian traders' opinions
The data of an Isae survey on a national panel of small- and large-scale distribution businesses show a recovery in 2009, albeit a rocky one. The trough occurred at the beginning of the 'great crash' in November 2008 when negative signs came from the assessment of stock levels, from expectations of future sales trends, and from evaluations on current turnover. Since then, the confidence index has improved and returned to its early 2008 levels, despite a few dips in March and October 2009. In January 2010-despite the still negative outlook for the labour market-sales and orders looked bright again especially for large-scale distribution. In February, however, greater caution prevailed once more and confidence deteriorated, particularly in traditional distribution (Figure 11.1.1).
 Sales in Italy in 2009 Sales in Italy in 2009
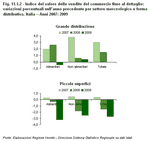
The Istat retail sales index for Italian trade also reflects the crash in October 2008, the growth in late 2008, a new dive in February 2009 and swings until the end-of-the-year recovery, which did not, however, succeed in bringing the index back to the levels of the previous year. Overall, large-scale distribution maintained the same level of sales as the previous year, while the decline in trade hit small-sized food shops hardest (Figure 11.1.2).
In 2009, a similar trend characterised sales of food products (down 1.5% compared to 2008) and non-food products (down 1.6%). Within the non-food sector, different types of products performed differently. Sales in household appliances, radios, tv sets and recorders rose (up 1.3% on 2008), while the sharpest falls concerned jewellery (-2.9%), shoes and leather goods (-2.9%), books and magazines (-2.8%) and household tools and hardware (-2.6%). Sales of magnetic storage media, musical instruments, photo equipment and films were stable.
 The situation in Veneto The situation in Veneto
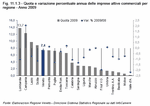
In the regional economy, active businesses in the trade industry account for over one-fifth of all economic activity, the highest rate for tertiary sector firms. Trade firms in Veneto-Italy's fifth-placed region for share of Italian trade after Lombardia, Campania, Lazio and Sicilia-are operating in a context of a 0.4% decline in one year on a national level. Among the regions with the highest share of the national total, Campania, Toscana, Piemonte, Veneto and Emilia Romagna showed some stability and exhibited annual variations that were higher than the national average.
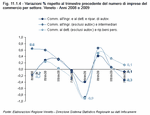
Although the deteriorating conditions of the international market and the consequent decline of consumption affected trade too, at the end of 2009 this sector was more stable than the whole of the Veneto economy. Over the last year, Veneto's active trade businesses fell by close to zero, namely -0.2%, whereas on average Veneto's active businesses declined by 0.9%. Entrepreneurial activity in retail and vehicles held on (+0.1% and 0.0% respectively) while wholesale trade and trade brokers declined slightly (-0.5% in 2009) (Figure 11.1.3).
The business balance in the trade industry in 2009 was negative, at -1.5%, i.e. there being fewer new businesses than discontinued ones. However, the number of newly founded trade businesses increased slightly in 2009, reaching a rate of 5.9%, while the number of firms that went out of business greatly decreased, reaching 7.4% in late 2009. This value is lower than the average of all sectors.
The quarterly trend of active businesses in Veneto shows that in the last few quarters in 2009 the sector clearly stood its ground. In particular the retail trade and repair of personal and household goods exhibited positive cyclical swings starting from the second quarter of 2009. The vehicle trade had fluctuations over zero year on year over the whole period under consideration.
Over all quarters in 2009, trade was more stable than the whole Veneto economy. Veneto trade had constant variations which were never lower than the Veneto average, both with reference to the previous quarter and year on year (Figure 11.1.4).
|
| Figure 11.1.1 |
 |
| Figure 11.1.2 |
 |
| Figure 11.1.3 |
 |
| Figure 11.1.4 |
 |
|
|


