In Veneto, cooperation in the field of research and innovation is particularly widespread and supported by two laws: Regional Laws LR 8/2003 and LR 9/2007. Among the purposes of LR 8/2003 (Regulation governing the agglomeration of the supply chain, production districts, and measures for local industrial and production development) is to provide incentives for the innovation process within production sectors by promoting and supporting the development of the regional production system. This process of aggregation and cooperation can transform districts into innovative, hi-tech areas, where production capacity is transferred and partnerships are formed, thus strengthening the innovation process and enhancing the quality and competitiveness of "System Veneto". The final objective is the creation of a virtuous cycle in which scientific research generates innovation that in turn supports growth and thus continues to favour research to create new knowledge. LR 9/2007 is entitled "Regulations for the promotion and coordination of scientific research and for economic development and innovation in the regional production system". These regulations favour innovation and the transfer of knowledge by supporting and coordinating scientific research and technological development; foster interaction between knowledge and its use for economic and social development and bettering the quality of life; promote the protection, appreciation, development and transmission of basic and applied research to the production system by networking with the universities of Veneto, its research centres, its enterprises and other active agents which work in the region; and also facilitate the patenting of the results of university research and its transfer to business.
The data of the Met study (Note 1) collected over the summer of 2009 reveal that nearly half of the firms in Veneto that perform research and development (R&D) collaborate with other actors in the area. In general, entrepreneurs prefer to cooperate with universities, be they in Veneto (9.6% (Note 2)), other regions (9.7%) or abroad (2.9%). The geographically closest form of cooperation is always preferred: 9.6% of the firms that did research and development in 2009 did it together with firms in Veneto, and 4.1% with laboratories within the region. Only 0.7% of the firms of Veneto employ research consortia, laboratories shared by several firms, a figure that differentiates Veneto from the national average of 2.9%.
However, information about research and development alone is not the whole story in a place like Veneto, where much of the research and innovation produced can be characterised as informal; thus, it escapes the rigorous and, at times limited, definitions of statistical findings. For this reason, this analysis goes beyond the simple index of spending on R&D as a share of GDP and extends to the concept of innovation.
The index of R&D spending as a share of GDP is still continuously monitored to fulfil the requirements laid down in Lisbon in 2000 for EU countries that had set themselves the "Objectives" to become a knowledge-, competition- and solidarity-based economy by 2010. Among these Objectives is to spend 3% of GDP on R&D by 2010 for the EU; 2.5% for Italy.
 Research and Development Research and Development
In 2007 in Veneto, 1,232 million euro were spent on R&D, a figure that puts Veneto in fifth place among Italian regions, but second in growth, with an increase of 29.4% compared to the previous year, which is second only to the Autonomous Province of Bolzano and to Valle d'Aosta; these two, however, are of a much smaller size. This growth is in line with the trend identified in recent years: compared to five years ago an increase in spending of nearly 50% has been recorded, with particularly large rises in the last two years. Furthermore, this progress has been supported by the private sector, which in 2007 increased its investment in the field by 46.8%. (Table 10.5.1) and (Figure 10.5.1).
There was also a consistent increase in the number of people employed by business in R&D, as it rose by almost 42.2%.
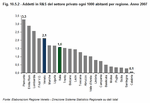
In terms of spending on R&D as a percentage of GDP, Veneto recorded 0.85% in 2007, a lower figure than the national one, which was 1.18; the increase that has occurred in recent years, however, is notable: +26% compared to the figure five years earlier. (Figure 10.5.2), (Figure 10.5.3) and (Figure 10.5.4)
Veneto employs 16,772 people in research and development, 3.5 per 1000 inhabitants, a figure identical to the Italian average.
The private sector predominates in investment in R&D: it accounts for nearly 60% of the spending on R&D and employs more than 60% of the personnel. This sector employs 2.1 people per 1000 inhabitants, compared to a national average of 1.6. Eighty percent of spending can be attributed to twenty percent of firms. The manufacturing sectors with high and medium-high technical content are the most involved: chemical-pharmaceuticals, optical-electronics, mechanical goods; in services, services with a technical content (information technology and research and development) are those with the highest rates.
Universities account for 28% of spending and public institutions and not-for-profit firms for 13%.
 Innovation Innovation
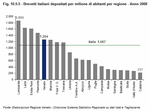
Patents are an indicator used by many economists to measure the results of technology competitiveness and innovation. Even though literature reveals that no more than 50% of patented inventions are brought to market, and that not all inventions are patented, the patenting process is the most important, and perhaps the only, tool that can be used to verify the productivity of research. Veneto, with applications for 6,143 patents in 2008, represented 9.4% of the national total and was the fifth region for patent registration. In 2008, 1,264 patents were registered per one million inhabitants, compared to 1,087 on a national level, and 13.3 patents per 1000 firms (12.2 for Italy). In the patent register of the European Patent Office (EPO), Veneto was third among the Italian regions. (Figure 10.5.5).
A study carried out by Met in Veneto in 2009 found that in the last three-year period firms in Veneto distinguished themselves in innovative activity: one-quarter of Veneto firms developed new products/processes or ones that greatly improved existing ones. The data from Istat studies reveal that spending on R&D, defined in the strict sense of the term, is concentrated in large firms; however, if innovative activity is also considered, the contribution of small and very small firms emerges as a principal component in the positive performance of the regional system. Though more than half of large firms declare to have introduced some kind of innovation in the three-year period 2007-09, it is significant that innovation was also introduced by one-quarter of micro firms and by about one-third of small firms. (Figure 10.5.6) and (Figure 10.5.7)
More specifically, the main types of innovation introduced in the last three-year period were organisational, managerial and marketing, or secondary-type innovation, i.e. the improvement of an already existing product or process, rather than the introduction of new ones:
20% declared that they had introduced organisational innovation (the national figure was 14.9%). (Table 10.5.2) and (Figure 10.5.8)
Innovative products or services for the market accounted for 27.6% of turnover in 2008, while on a national level their share was 36.4%; traditional products or services still predominate in Veneto.
By sector, the most innovative firms seem to be concentrated particularly in vehicles, mechanical goods, chemicals, rubber and plastics, and business services. Particularly high figures compared to the national average were found for innovation in the principal products of the textile, metals, and rubber and plastics sectors; for innovation in secondary products, the transport sector stood out, as did for organisational innovation. Compared to the regional average, a relatively unfavourable situation was found for the food sector. (Table 10.5.3)
The reasons why firms innovated were varied and often hard to classify. The principal explanations were of two kinds: strategies based on increasing the firm's income and those driven by development and technological change in products and production processes, which is implicitly linked to the dynamics of research.
In particular, 13% of firms innovated to diversify production into profitable sectors; 11% to take advantage of technological developments; and 11% to stay competitive. (Figure 10.5.9)
 The international network of trade in technology The international network of trade in technology
Analysis of the technology balance of payments (Note 3) (TBP), an instrument explicitly designed for measuring the supply of and demand for advanced technology in a geographical area, can lend support to considerations regarding the role of some production systems in the international network of trade in technology. The balance records receipts or payments related to international disembodied technology transactions in the form of industrial and intellectual property rights, such as patents, licences, trademarks, know-how and technical services. The figures recorded in TBP are an indicator of the capacity of a geographical area to sell its own know-how abroad (receipts) and to absorb international technological innovation (payments), quantifying therefore its centrality within the technology market.
In 2008 on a national level, the overall balance of the TBP was positive with a figure of about 375 million euro; it was above zero for the third straight year, after a structural trend deficit that had lasted for several years.
In 2008, the overall balance was the result, as in the past, of a surplus in services with a technical content (1,212 million euro), research and development services (340 million euro) and sales of technology (20 million euro). These positive balances were offset by deficits of 530 million euro in trademarks and design and of 668 million euro in the other areas of technology. (Table 10.5.4)
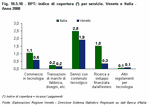
In Veneto, which is faced with a fall both in receipts and payments, the balance was still negative by about 88 million euro, a deficit that had been cut in half compared to 2007. It is worth underlining how the balance was positive for services with a technical content, that is those that are the greatest object of and source of innovation: this trend was confirmed by the TBP coverage ratio, which is the ratio between receipts and payments. In 2008 Veneto had a coverage ratio of 1.9, which meant it sold about double the amount of services that it purchased from abroad. All of the other services considered had a deficit, which was due to a slight decline both in payments and receipts. (Figure 10.5.10)
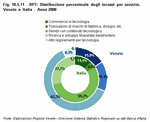
If we analyse the most requested services supplied by Veneto abroad in 2008, which are measured by receipts, it was revealed that 62% of receipts were due to the supply of services with a technical content. This figure was higher than the Italian figure (about 55%), whilst almost all of the other types of services, technology sales, trademarks and designs, had receipts above 15%.
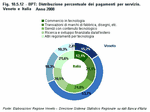
In 2008, what Veneto bought most from abroad, however, involved transactions in trademarks and designs, which accounted for almost 54% of its payments. This figure differentiated Veneto from the rest of Italy where the share of this sector accounted for a much lower 21%. (Figure 10.5.11) and (Figure 10.5.12).
Veneto was attributed with 38.6% of the overall receipts of the North-East and 3.1% of the total receipts nationally. On the payments side, Veneto also contributed significantly (51%) to the total of the North-East, and contributed 6.1% to the national figure.
The individual balances by country saw Veneto in overall debt with the European Union, but with a significant variation by country: there was a negative balance of more than 15 million euro with France and 10 million with Luxembourg, while there was a positive balance with Belgium and the United Kingdom of about 12 million euro. Of the countries outside the European Union, negative balances were recorded with Switzerland and the United States.
A comparison of the Italian regions' levels of international trade in services with a technical content makes it possible to identify, on the basis of standardised data in respect to population, how each one interacts with the international network of trade in technology. The two regions characterised by a large volume of both incoming and outgoing technology are Lombardia and Lazio, even though the balance of the former is three times that of the latter; Piemonte, which has a high attraction in the network of technology trade, is characterised by high export of services; another group of regions, close to the national average, includes Veneto, as well as Trentino Alto Adige, Friuli Venezia Giulia, Toscana and Emilia Romagna, and can be defined as moderate traders in services with a technical content; finally, there is a fourth group of regions marginally involved in the network of services with a technical content, made up exclusively of regions in South Italy.
|
| Table 10.5.1 |
 |
| Figure 10.5.1 |
 |
| Figure 10.5.2 |
 |
| Figure 10.5.3 |
 |
| Figure 10.5.4 |
 |
| Figure 10.5.5 |
 |
| Figure 10.5.6 |
 |
| Figure 10.5.7 |
 |
| Table 10.5.2 |
 |
| Figure 10.5.8 |
 |
| Table 10.5.3 |
 |
| Figure 10.5.9 |
 |
| Table 10.5.4 |
 |
| Figure 10.5.10 |
 |
| Figure 10.5.11 |
 |
| Figure 10.5.12 |
 |
|


