(Note 1) Groups of firms, including family-run ones, make up a specific form of organisational, financial and production governance which is characteristic of the region's entrepreneurial fabric.
A group of firms is defined by Brioschi et al, 1990, as a "set, often quite numerous, of legally independent firms connected by mutual ownership ties that, together, allows for the unified control of all activities".
In very simple terms, we can say a group is made of a collection of firms, each independent legal bodies, controlled by a single economic body and subject to unified management. Generally the formation of a group is dictated by fiscal/ownership needs or by strategic needs. In both cases, the economic advantages are much more numerous and have a strong impact on both the organisation and management of the business. Through upstream integration, the group structure enables privileged relationships with suppliers, a flow of incoming materials with times and methods that meet the needs of the central firm, as well as better quality control and greater opportunities for customisation; through downstream integration, it opens privileged distribution channels, and so, better access to the target market; through horizontal integration in the same field of business, it allows production capacity to be increased, and so, increased market share; through diversification of activities, it allows more lines of business to be created in order to target new market segments with firms being created ad hoc, so as to diminish risks and not to compromise the image of the principal firm in case of failure.
In conclusion, the broader objective may be described as the creation of a network of firms in which common activities can be brought together and rationalised while, at the same time, the hallmarks of each firm are reinforced, so as to avoid waste and duplication and improve the competitiveness of the group (Franceschetti, 2003).
There are also studies that demonstrate scientifically how firms belonging to a group perform better
(Note 2). By belonging to a group, a firm is able, generally, to increase its efficiency in comparison to firms that do not belong to one. The difference in efficiency between firms belonging to a group and those which do not, furthermore, is rather large.
In 2002 there were a little more than 52,000 groups of firms
(Note 3) in Italy, including more than 123,000 active businesses employing more than 4.9 million people. Groups made up 2.9% of all active businesses, about one-third of the employed and more than half of turnover. Groups of individual corporations accounted for 18.7%, with a share of more than 50% of employment. In 2007 there were more than 74,000 groups of firms in Italy, involving more than 176,000 resident active businesses and employing more than 5.7 million people. Groups accounted for 21.5% of total individual corporations with an impact on employment of 56.4%. In 2007, there were about 5% more groups than in 2006 and the employees involved had risen by 2.6%.
In 2007 in Veneto 8,954 groups of firms were present, of which 7,268 had their parent company
(Note 4) in Veneto, 765 in other Italian regions and 921 in a foreign country. The groups active in Veneto included 30,462 active businesses, of which 18,660 in Veneto; they employed 1,644,317 people overall, of which 540,332 in firms in Veneto. The groups in Veneto accounted for 12% of the total groups in Italy.
There were 18,660 firms of Veneto that belonged to a group, 4.6% of the total active businesses in Veneto; they employed 540,332 people, that is nearly one-third of the total employees of firms in Veneto.
(Table 10.2.1).
The groups of firms present in Veneto were larger than the national average: they controlled on average 3.4 firms, compared to the national average of 2.4 and on average employed 184 people, versus 77 for groups in Italy. Considering only the enterprises located in Veneto belonging to a group, it can be seen that each group present in Veneto controls 2.1 firms located in Veneto and employs just over 60 people in firms in Veneto.
The geographical distribution of the parent companies reveals that 85.4% of enterprises in Veneto belonging to groups are controlled from inside the region and that this share's representativeness falls to 69.4% if calculated on the basis of employment.
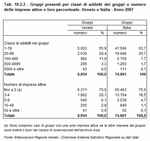
The most common size of groups in Veneto is fewer than 19 employees, only 15% of the groups have a size larger than 100 employees. In 70.5% of cases, the groups in Veneto control at most 2 active businesses and only 3.3% control more than 10 businesses; the distribution by number of employees and number of businesses controlled also reveals a larger size of the groups in Veneto than the national average.
(Table 10.2.2).
The firms of Veneto belonging to a group are predominantly "SRL", limited liability companies, while in terms of employees partnerships prevail "SPA", employing about half of the employees of firms in a group in Veneto.
(Table 10.2.3).
Corporations present in groups
The analysis of the structural characteristics of businesses that belong to groups is explored for the businesses that have a legal organisation as corporations
(Note 5) to guarantee a homogeneous evaluation within the same field of observation.
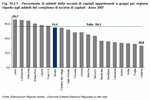
(Figure 10.2.1).
Groups included 17,436 Veneto corporations, nearly one-quarter of the total resident corporations (24.4%), with a 54.6% share of employment. In 63.3% of cases, the corporations in groups were in the service sector and 36.6% in industry; the sector of monetary and financial intermediation was exceptional; here the share reached half of the corporations resident in Veneto.
(Figure 10.2.2).
The 534,924 employees in the Veneto corporations that belong to a group represent over half of the total employees in corporations in Veneto; the highest percentages were in retail, 61.4%, and especially in monetary and financial intermediation, 84.7%.
The corporations in Veneto that belonged to groups were predominantly small in size: 77.2% of them employed 1 to 19 people and 12% of them 20 to 49 people. Both in terms of companies and in terms of employees, the share of corporations in groups compared to the total number of corporations in Veneto rises as the size rises: only 129 corporations belonged to a group with more than 500 employees, but it is important to underline that they represent nearly all of the corporations of this size of Veneto, i.e. 91.5%, and they employ 95% of the employees in this kind of firm.
(Table 10.2.4).
Shifting analysis to controlled corporations, groups in Veneto controlled 15,225 corporations that employed 449,510 people. A total of 12,519 firms, 82% of them, had their parent in the region and employed 284,566 people, 63.3%, a higher percentage than the Italian average; 8.8% had their parent in another Italian region and employed 12.6% of the total, while 8.9% had a foreign parent and employed 24.1%.
(Table 10.2.5).
Groups with the parent company in Veneto
The analysis now will concentrate on groups with the parent company located in Veneto. The 7,268 groups that had their parent company in Veneto made up 81.2% of the total groups in Veneto and included 17,453 active businesses across the entire nation, of which 15,936 were in Veneto; they employed 442,645 people, of which 375,041 were in firms in Veneto.
In 85.4% of cases, the firms in Veneto that were part of a group had their parent company in Veneto; the number was more contained in terms of employment: 69.4% of employees of the firms in Veneto organised in groups were under parent companies from Veneto.
The average size of groups with a parent company in Veneto was in line with the national average: they controlled 2.4 firms on average, of which 2.2 in Veneto, and employed 61 people, of whom 52 in Veneto.
(Figure 10.2.3) and
(Figure 10.2.4)
The prevailing size of groups with a parent company in Veneto was less than 19 employees, 90% of which controlled firms with fewer than 100 employees. In 74% of cases, groups with their parent company in Veneto controlled a maximum of 2 firms and only 0.9% controlled more than 10 firms.


