(Note 1) The process of economic globalisation over the last decade has accentuated the already complex system of relationships that go beyond the borders of geography, size and sector, cutting across the realms of management, law, social institutions and forms of government. The general trend over the last year has been an example as the financial crisis that originated across the Atlantic has had major effects on all real local economies.
 The signs of international recovery The signs of international recovery
Only about halfway through 2009 were the first signs of economic recovery to be seen, after the steep decline recorded between the end of 2008 and the beginning of 2009. During the summer months, world GDP began to slow its fall and economic activity showed signs of stabilising. In the last months of the year, fiscal and monetary stimulus and social welfare measures adopted by governments began to bear the first fruits: in the emerging economies, they produced a rapid return to the pre-crisis rates of growth and in the advanced economies they sped up recovery.
The third quarter of 2009 was better than expected: a recovery in GDP was seen in the United States and the euro-area, as was growth in Japan and an acceleration in the emerging economies of Asia and Latin America.
In the fourth quarter, the growth of US GDP and the recovery of industrial production from the low recorded in the first half of 2009 continued, and the climate of confidence improved further. Although the economies of the most industrialised countries, in terms of employment and domestic demand, still need the support of government measures, in the more dynamic emerging countries, and especially in international markets for raw materials, the signs of a price recovery are getting stronger. In the United States and Japan the decline in employment slowed. The volume of world trade began to grow again, even though it was far from that of the previous years. In summer 2009, the volume of world trade recorded notable growth, one that was particularly marked in autumn and led by Asian countries; in China, economic stimulus measures acted as a locomotive for the countries in the area. Near the end of the year, trade with the United States began to show signs of a recovery.
The year 2009 concluded with a reduction of 0.8 percentage points in global wealth, 2.4% in US GDP, and 4.1% in the euro area (Figure 6.1), (Table 6.1) and (Table 6.2).
Exchange rates and raw materials
The trends in exchange rates and in prices of raw materials are closely linked. Between September and October 2008, at the outbreak of the crisis, there was a rapid decline in the euro from the highs reached in July 2008 and, consequently, an appreciation of the dollar; this was attributed both to the end of speculative short-selling (Note 2) of the dollar, and to the dollar's quality as a reserve currency. The subsequent lowering of interest rates to nearly zero by the FED and the increase in supply of dollars to bail-out many sectors in crisis, led to a recovery of the euro during the month of December, a recovery that was then dented between December 2008 and February 2009 due to the expectations of interest rates being lowered in the euro area as well. Finally, since March 2009 with the first signs of recovery and rising confidence, the dollar showed signs of growing weakness and fell against the euro, losing 13.7% of its value between its average price in February and September, while prices of raw materials and shares began to rise. The first months of 2010 have been characterised by the weakness of the euro, rather than the strength of the dollar. This was affected by fears about Greece's public finances, which have spread to economies that are also at risk of high debt. The improving situation in the US added to this and should continue to influence the course of the exchange rate between the euro and the dollar in the coming months. In 2010, rates should hover around the average rates of January 2010. Around the end of the year, monetary tightening by the FED, which should precede that by the European Central Bank (ECB), together with greater public stimulus in the United States as the recovery continues, may produce a moderate rise in the dollar.
The effect of the relationship between exchange rates and commodity prices was most notable at the beginning of the crisis. With the beginning of 2009, the downward correction in the prices of raw materials continued for only a quarter, and already by mid-year international prices had regained ground. Crude oil, after the steep decline in the first months of 2009, by October had begun to hover between 70 and 80 dollars a barrel. The cold winter and the strengthening of Chinese demand pushed the price up, while the strengthening of the dollar pushed it down. The forecasts made by the International Energy Agency for global demand for oil in 2010 are for a continued rise, from an estimated 85.7 million barrels a day in September to 86.2 million in December. According to futures prices, the price of crude oil (WTI) will rise to nearly 90 dollars a barrel at the end of 2010. Other raw materials, after a fall in the first half of 2009, experienced a rapid recovery in prices, which continued throughout the fourth quarter. An increase in prices is forecast in 2010, but the trend will be slower than the first few months of the year (Figure 6.2).
 2009 in Europe 2009 in Europe
The year 2009 concluded with a -4.1% variation in GDP for the euro area and -4.2% for EU27. The most recent European decline lasted for five quarters and only came to an end in the third quarter of 2009, when a rise of 0.3% was recorded. Finally, in the fourth quarter, GDP leveled off at +0.1% on the preceding quarter. This data indicates a weak recovery that is not yet receiving adequate support from household consumption and investment. Household consumption was limited by a weakness in the job market, while business investment was still feeling the effects of restricted credit and the decline in the construction sector. The positive push for growth was due to inventories, collective consumption and net exports, which were favoured by the recovery of world demand, especially in Asia.
Overall in 2009, Germany was the country that felt the effects of the recession most; in the second and third quarters it recorded growth of +0.4 and +0.7% respectively, but in recent months despite positive contributions from gross fixed investment and inventories, growth was dampened by household consumption and net exports, leading the German economy to end 2009 with a decline of -5% on the preceding year.
In France, the annual decline of -2.2% was caused by a fall in GDP in the first quarter which the slight growth of the last three quarters of 2009 did not reverse; in the second half of the year, recovery was supported by net exports, while domestic demand offered none, despite the fact that French household consumption grew thanks to the significant fiscal incentives given to the automotive sector.
In Spain the recession continues, because of the decline in domestic demand and the collapse in construction, due to the bursting of the housing bubble, which continues to be the principal factor in a sharp correction in fixed investments.
In the euro area, the labour market began to feel the crisis in the fourth quarter of 2008, but economics teaches us that employment indicators tend to lag behind indicators of downturns in the business cycle. In 2009, the unemployment rate rose from 8.6% in January to 10% in December, and the trend will continue in 2010. Some countries have been hit harder, in particular those in which the housing crisis has been most acute. In Spain and Ireland, the unemployment rates in December of last year were, respectively, 19.5% and 13.3%, driven by the weak demand for construction labour.
In Europe, the economic stimulus packages were, on average, smaller than those in other countries, but more focused on the labour market. In any case, the economic aid supplied by public spending beginning in 2008 has been crucial to the recovery. In 2009, furthermore, expansive fiscal policies were enhanced in most of the countries of the euro area, significantly weakening public balance sheets.
In autumn 2009, the European Commission estimated a -2.3% worsening of the average primary deficit across the area in 2009. In 2010, the structural deficit will probably suffer a further worsening, and the countries with significantly troubled public finances, such as Portugal, Ireland, Greece and Spain, will have to deal with the effects of significant adjustments in the medium term in order to meet the requirements of the Stability and Growth Pact (Table 6.3).
 Recent developments in the Italian economy Recent developments in the Italian economy
In Italy, the trend has been moderately favourable and there seem to be signs of a slow and discontinuous recovery: after positive signs in the third quarter, the last part of the year saw a decline. Analysis of the Italian economy reveals a severe, but not particularly long, recession compared to the crises of the early 1980s and the first years of the current decade; the decline was large not only in terms of GDP and of supply and demand, but also involved industrial production and sales. Italy ended 2009 with a -5.1% decline in GDP; like Germany, Italy experienced a steep decline in productivity, caused by the contraction in international trade, due to the size of its manufacturing industry (Figure 6.3).
The trough was certainly reached in the first semester of 2009 and can be seen in the decline in all economic indicators; however, since March, the Italian economy has been on course toward improvement. The first quarter of 2009 saw a 2.7 percentage point decline on the preceding period, which was surely the result of a fall in investment and household consumption, as families were encouraged to save by the lagging effects of the crisis on the labour market. From then, a certain domestic inertia set in, until the third quarter of 2009 when there was an upturn in all of the principal economic indicators. The last three months did not contribute to growth, especially due to the collapse in investment.
The Italian industrial production index has followed a wavering course in the most recent quarters. After the decline in the first months of the year, there was an upturn, slow at first, which gained speed over the summer, only to take another downturn. The overall result for 2009 was a decline of 17.5 percentage points in industrial production compared to the previous year. The underlying trend in manufacturing, however, remained favourable and it was sustained by positive changes in the indicators in turnover and manufacturing orders (Figure 6.4).
Likewise, the autumn and end-of-the-year recoveries in the retail sector were unable to lift the indicators of retail sales to the level of the previous year. The index in fact declined by 1.6% in Italy in 2009. The trend was similar in the sales of food and non-food products (Figure 6.5).
 The climate of confidence in Italy The climate of confidence in Italy
Italian business confidence declined to historic lows at the beginning of 2009, as it felt the effects of a worsening of domestic and foreign order books; but since March 2009 there has been a continuous improvement thanks to changing opinions on orders and demand.
The difficulties in the construction sector persist, however. Investigations by ISAE, Italy's Institute of Studies and Economic Analysis, confirm a low level of both orders and activity, with worrying forecasts for employment. The service sector has seen an improvement of business confidence in the state of demand.
From the consumers' perspective, generally household confidence measured by the ISAE in 2009 improved on the low levels of 2008. The improvement of the index continued through the summer of 2009, and since then household confidence seems to have stabilised. In January 2010, the consumer confidence index was higher than the average recorded in the first semester of last year, when confidence hit record lows; in February of this year, a decline was recorded due to greater pessimism about the general economic climate (Figure 6.6), (Figure 6.7) and (Table 6.4).
 Veneto's economy Veneto's economy
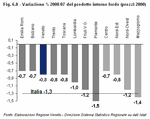
Official regional data ends in 2008 at the beginning of the international recession, when the Gross Domestic Product of Veneto had fallen by 0.8%. In national terms, the economy of Veneto held up better than both the Italian average (-1.3%) and the regions considered its economic rivals, Lombardia and Piemonte. Once again in 2008, Veneto was found to be the third largest regional contributor to Italy's GDP: the region contributed 9.4% of the national total, behind Lazio (10.9%) and Lombardia (20.7%).
This result is thanks to growth in agriculture and the strength of the service sector, despite the negative contribution of industry.
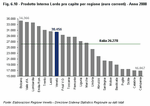
Household spending declined rather modestly, -0.9%, while GDP per inhabitant, equal to 30,456 euro compared to the 26,278 euro on a national level, grew by 0.7%.
For 2009 the Prometeia research institute estimates that the downturn in GDP in Veneto is in line with the national trend, -4.8%, and forecasts +1.3% growth by the end of 2010.
The result for 2009 is attributed principally to the crisis in manufacturing, whose value added is expected to decrease by about 13 percentage points, and to the decline in the construction sector (Figure 6.8), (Figure 6.9) and (Figure 6.10).
Business and consumer confidence in Veneto
The most recent quarterly indicators at regional level regard the perceived confidence of both entrepreneurs and consumers. In Veneto there was an increase in concern about the trends in production, orders and inventories in the last months of 2008 and the first ones of 2009.
Manufacturing confidence in Veneto, according to a survey carried out by ISAE, reached its low point in March 2009 to rise to more optimistic levels in April 2009; from there it returned to pre-crisis levels. Opinions improved both concerning the state of order books and, especially, production expectations. In February 2010, confidence had levelled off in the immediately preceding months due to a decline in expectations for new orders and production (Figure 6.11).
Italian household pessimism weakened. After the uneveness of 2008 and the decline in March 2009, the overall consumer confidence index, which measures the optimism/pessimism of consumers based on nine indices related to the general and individual economic circumstances, rose in January 2010 only to fall again in February. In the last part of 2009, in particular, opinions and expectations for the entire economy improved; in February the percentage of those who expect a further decline increased (Figure 6.12).
Financing the economy of Veneto
The outbreak of the financial crisis in September 2008 soured relationships between banks and businesses: on the one hand, the banks adopted more restrictive policies of access to credit; on the other, the decline in real activity worsened the profitability of firms and made them more prone to credit risks. Both the ISAE surveys and the indicators of the Bank of Italy began to record a tightening of the terms of credit for national businesses midway through 2008. Some signs of a loosening of credit restrictions began to emerge over the course of 2009 and again at the beginning of the current year. From the figures of January 2010 (Note 3), the share of businesses that reported a worsening of the terms of credit was 18.4% in manufacturing (against a high of 43.5% in November 2008); 14% in services (with a high of 49% in November 2008); 12.3% in trade (a high of 43.1% in March 2008); and 34% in construction (a high of 52% in May 2009).
The demand for financing from Veneto businesses diminished in the first half of 2009, reaching its low point in October to then rise to slightly higher levels in the last two months of 2009. The trend is similar to the national average even though in Veneto, as in the rest of the North-east, the decline in demand for credit was greater.
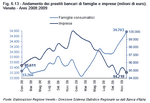
The demand for household credit recorded a decline on national level in the first half of 2009 in all areas of the nation. The decline in demand for mortgages continued in the second half of the year, while the demand for consumer credit grew, with the exception of the regions of the North-east. In Veneto, after a prudent attitude in the first months of 2009, a rise in bank loans to households was observed, probably encouraged by a lowering of interest rates (Figure 6.13).
Value added by sector
Compared to the latest official figures for Veneto, that is 2008, the greatest contribution to growth in value added was made by the service sector, which represents 62.5% of regional GDP and, in 2008, it held up during the crisis, falling by 0.1%.
Agriculture, though it makes a modest contribution to regional wealth, accounts for 2.3%; in 2008 it recorded significant growth, +3.3%.
Industry, which still makes up 35.8% of the entire GDP, in 2008 showed the first signs of the international recession, falling 1.8%.
A general decline is estimated for 2009, one that was more marked in the industrial sector, less so in services. It is estimated that the value added by sector in Veneto is in line with national figures. The value added in agriculture on a national level in 2009 declined by 3.1%; for Veneto, a decline of 2.1% is estimated. In 2009 in Italy the industrial sector experienced a decline of 15.2%, one that was less severe in construction at -6.7%. In Veneto a reduction in industry is estimated, down 12.7%, with a more marked one in construction, down 4.5%. The wealth produced by services declined by 2.6% on a national level; it was driven down by trade, hotel services, transport and communications, which fell by 6.3%; in Veneto the value added of the tertiary sector in 2009 is thought to have decreased less, down 1.4% compared to 2008.
For 2010 a recovery in all sectors is forecast, except in construction, which continues to feel the weakness of the market (Figure 6.14), (Figure 6.15), (Figure 6.16) and (Figure 6.17).
Investments
In 2009, on a national level, gross fixed investments recorded a fall of 12.2%, caused by declines that involved all kinds of capital goods: machinery and equipment (-17.2%), construction (-7.9%), means of transport (-15.4%).
This component of national demand was negative during the first two quarters of the year, but was mitigated by a slight recovery in the third and by the stagnation of the final quarter. A rebound in the third quarter in the purchase of capital goods and in the final months in means of transport were particularly marked; toward the end of 2009, the recovery of business confidence and the improved access to bank credit, which was relatively less stringent during the autumn recovery, were particularly incisive. Furthermore, tax breaks on the purchase of new machinery (the Tremonti-ter incentives package) probably began to have a positive influence in the second half of the year.
On a regional level, the last official figures are from 2007, when investments remained at the level of the previous year, up 0.2%; this was the result of positive investment in industry, up 8.7%, stagnation in the primary sector, up 0.6%, a steep decline in construction, down 33.4%, and a decrease in the tertiary sector, down 1.2%.
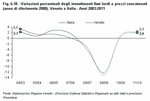
In 2008 and 2009 a similar decline to the national one is forecast; a recovery in 2010 as the crisis bottoms out, the rise of exports to which these expenditures are closely connected, tax incentives and generally less negative expectations will presumably lessen the caution of businesses and the relaunching of business plans (Figure 6.18).
Consumption
In terms of national employment, 2009 saw a decline in real terms of 1.2% in national consumption, produced by the 1.8% decline in household spending, and the 0.6% rise in government and private social institutional spending.
In the last quarter of 2009, private consumer spending in Italy brought an end to the slow recovery during the middle of the year, in contrast with the negative figures of the two preceding quarters. The trend, however, confirmed its underlying weakness and, in particular, uncertainty. The weakness in purchasing can be explained by the persistence of the difficulties in the credit market recorded by the Bank of Italy. Alongside this, another obstacle to purchasing was found in the decline of purchasing power, which fell, according to Istat, by 0.2% between the 12-month periods from October 2008 and September 2009 and from July 2008 and June 2009.
These factors, alongside the widespread worries about the changing labour market, led households to postpone unnecessary spending; in fact, a sharp decline in spending on non-durable goods was recorded. Consumption of durable goods started to recover in the second quarter of 2009, while spending on services saw a modest increase only in the most recent quarter (Figure 6.19), (Figure 6.20) and (Figure 6.21).
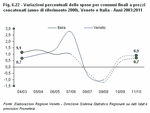
In Veneto in 2008, the year for which the most recent data is available, spending on final consumption was found to be down 0.6% compared to the previous year. For 2009 a decline of about 1% is estimated while signs of a modest recovery are forecast for 2010, based on the improvement in consumer confidence (Figure 6.22).
 Inflation Inflation
In 2009 inflation had an identical V-shaped course in the advanced economies: the decline continued for the entire first half of the year, so much so as to cause concerns about a risk of deflation, followed by slight, but constant, increases in the second half. In the final months of the year, the effects of the steep decline in the prices of energy resources that began in the second half of 2008 had worn off.
Overall in 2009 inflation in the euro area was 0.3% (down from 3.3% in 2008). In line with expectations, the harmonised index of consumer prices began to rise again in November, even though more moderately, interrupting the decline that had begun in the first half of the year. The rise can be attributed to energy which, over the twelve months, was affected by the sharp fall recorded in the same period of 2008. Removing energy and food from the general indicator, base inflation continued to fall gradually in 2009. Non-food and non-energy goods, as well as services, contributed to the slow down. According to the predictions of professionals surveyed in December by Consensus Economics, in 2010, on average, consumer inflation in the euro area is expected to be 1.2%, with a gradual rise over the course of the year. These forecasts are in line with the projections of Eurosystem experts, who estimated a change in the harmonised index of between 0.9% and 1.7% in December (Figure 6.23).
In 2009, Italy recorded its lowest inflation in 50 years. The index of consumer prices over the 12 months of 2009 saw a rise of 0.8%, the lowest since 1959 when it was -0.4%. In 2008, on the other hand, inflation had risen by 3.3%.
By category of spending, food and alcoholic beverages, other services, education, furniture and household goods, accommodation establishments and food services made the most significant contribution to average growth.
On the other hand, the prices of transportation, housing, water, electricity, fuel and communications were significant factors in the cooling of general inflation.
Compared to the previous year, there was a significant decrease in the contribution of food prices to inflation, and the cost of housing and transport, which had experienced sharp increases during 2008, was reversed.
Over the course of 2009, the wide fluctuation in the price of energy resources on international markets noticeably influenced the trend of the prices of transport, causing a steep decline in the first three quarters of the year but, in the fourth quarter, they were rising again.
The trend in the prices of housing also felt the effects of the fluctuation in the prices for energy resources, even though with a delay, and fell in the second half of 2009.
By type of product, the most significant contribution to the average rise of prices over the last year were unregulated services, while regulated services, that is services whose prices are set by national or local authorities and by public utilities regulated by particular agencies, made only a slight contribution to general inflation. In the goods sector, a significant contribution to the cooling of general inflation came from the prices of other energy goods, which include motorcar fuel and lubricants, and from regulated energy goods (-0.055), including the cost of electricity, gas for domestic use, and gas for heating. The trend of prices for energy goods exercised a restraining effect on the dynamics of inflation and, in particular, it substantially countered the inflationary impact deriving from rises recorded in the price of food products, tobacco and other goods.
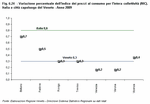
In Veneto in 2009 inflation was on average lower than the national level of 0.3%; the provincial capitals that distinguished themselves for lower rates were Venezia and Verona, while Belluno approached the national average.
In Veneto, like on the national level, the prices that contributed most to inflationary pressure were related to the consumption of food, beverages and education; the prices that lowered overall inflation were those related to transport (Figure 6.24).
|
| Figure 6.1 |
 |
| Table 6.1 |
 |
| Table 6.2 |
 |
| Figure 6.2 |
 |
| Table 6.3 |
 |
| Figure 6.3 |
 |
| Figure 6.4 |
 |
| Figure 6.5 |
 |
| Figure 6.6 |
 |
| Figure 6.7 |
 |
| Table 6.4 |
 |
| Figure 6.8 |
 |
| Figure 6.9 |
 |
| Figure 6.10 |
 |
| Figure 6.11 |
 |
| Figure 6.12 |
 |
| Figure 6.13 |
 |
| Figure 6.14 |
 |
| Figure 6.15 |
 |
| Figure 6.16 |
 |
| Figure 6.17 |
 |
| Figure 6.18 |
 |
| Figure 6.19 |
 |
| Figure 6.20 |
 |
| Figure 6.21 |
 |
| Figure 6.22 |
 |
| Figure 6.23 |
 |
| Figure 6.24 |
 |
|


