In light of the economic crisis that hit Italy, in 2009 the Italian government intervened with a major anti-crisis package that contained measures geared towards supporting families, the needy, workers and enterprises. These measures included resources made available via the European Social Fund by the Regions, which took on a more direct role in the management of social security.
A system needs to be created if we are to beat this crisis; a step in this direction was taken by an agreement between the Veneto Region and social partners at the start of February 2009, one that was given further backing by a regional law passed in March 2009. The network of employment support services had to be strengthened by integrating welfare and workfare policies.
A Veneto Lavoro report estimates that Italy spent 1.45% of its Gross Domestic Product (GDP) on social security in 2009, compared with 0.8% the previous year; this figure was higher in Veneto, which spent 1.55% of its GDP on social security in 2009, compared to 0.86% in 2008 and 0.51% in 2007.
 Acrobatics: the wages guarantee fund
The Wages Guarantee Fund (CIG) is unquestionably one of the most important passive policies for supporting income and protecting workers; this fund replaces or integrates the income of workers who have been affected by suspension of work or short-time working, a measure that is supposed to help out businesses in temporary difficulty by paying for temporarily unused labour, thus ensuring a worker can remain an employee of the company.
In 2009 payment of 918 million hours from the Wages Guarantee Fund
(Note 1) was authorised in Italy, more than four times that of the previous year, and much higher than the figures for the economic crisis of 1993 (around 550 million hours). Between January and December 2009, there was increasing recourse to the special Wages Guarantee Fund, which is linked to crises and business restructuring, due to the ordinary Wages Guarantee Fund being extended to other types of companies and workers and some companies stepping from the ordinary to the special Wages Guarantee Fund. However what caused this rise over the year in general was mainly the increased recourse to the ordinary Wages Guarantee Fund, which more closely linked to the economic cycle; it quintupled in size on 2008.
In 2009 in Veneto the Wages Guarantee Fund was also used considerably. Over the year, almost 82 million hours were authorised: more than five times the previous year. Both in Veneto and in Italy, more hours were covered by the ordinary Wages Guarantee Fund than by the special fund (56% of the total hours in Veneto and 63% in Italy).
It should be mentioned that recourse to Veneto's ordinary Wages Guarantee Fund grew the most over the year, up 567% on 2008, where the special fund increased by 313%; however as 2009 progressed there was a surge in the applications for the special Wages Guarantee Fund, to the extent that from November it exceeded the ordinary fund.
In Veneto the Wages Guarantee Fund accounted for 8.9% of the national total: 7.9% for the ordinary Wages Guarantee Fund and 10.5% for the special fund, up two percentage points on the previous year
(Figure 5.3.1).
Employees using the Wages Guarantee Fund
If the number of hours covered by the Wages Guarantee Fund is translated into the number of workers by assuming that each person works 1650 hours a year
(Note 2), in 2009 in Italy the Wages Guarantee Fund covered the equivalent in hours of 556,500 workers, over four times more than the figure for 2008. Lombardia is the region with highest number of hours and it accounted for 29.8% of the total hours. Piemonte follows with 18.1% of the national total. Veneto is third in the regional rankings; here the Wages Guarantee Fund covered the equivalent in hours of fewer 49,600 workers, compared to approximately 9,500 in 2008.
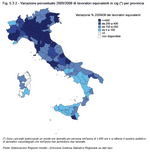
In the provincial rankings, Vicenza recorded the highest number of employees whose work was suspended completely over the year (25.8% of the Veneto total); Treviso and Padova followed with 19.6% and 17.7% of the regional total respectively. The highest rise, however, was in Verona where the number of equivalent workers was almost eight times that of the previous year; Vicenza was next with an increase of more than six times
(Figure 5.3.2).
The sectors that were most affected in 2009 were in line with national figures; the highest number was in the mechanical industry, which accounted for 51.3% of the regional total for number of equivalent workers; these workers were mainly employed in highly specialised manufacturing in the areas of central Veneto and its foothills.
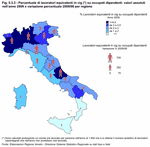
By comparing the number of equivalent workers using the Wages Guarantee Fund with the number of employed persons, as per the Forze di Lavoro report by Istat, we can obtain a cautious estimate of the number of workers who may have used the fund over the course of the year. Piemonte is the region with the highest percentage; it is estimated that here more than 7% of workers may have used the fund for the whole year, while Veneto lies sixth in the regional rankings with 3%, a figure that is below the national average of 3.2%. When compared with Italy's other regions, Veneto experienced the fourth highest increase on 2008, with Emilia Romagna, Lombardia and Abruzzo occupying the top three positions
(Figure 5.3.3).
A wider safety net: the extended Wages Guarantee Fund
An extension of the Wages Guarantee Fund (CIG/D) is one social security measure that affords great protection of workers affected by the crisis. This extension has been an option for a number of years, but over the last year it has undergone some important changes; it now covers a much broader range of areas and its management has been extended to involve regional governments and local social partners. This fund extends coverage of wages to laid-off workers who are unable to claim from the ordinary or special Wages Guarantee Funds, such as workers in artisan businesses, tertiary enterprises, professional studios and industries that could not use the standard funds.
Although the option to apply for the CIG/D was given to employers from the end of May 2009, according to Veneto Lavoro figures, annual accounts reveal that the Veneto Region received 9,800 applications from 6,6000 companies for a total of almost 28 million hours covering more than 39,000 employees. The provinces most affected by this phenomenon are in central Veneto: Vicenza stands out with its 3,100-plus applications, which account for almost 12,000 workers and CIG/D hours equal to more than one third of the regional total. Next come Treviso and Padova with 19.1% and 18.6% respectively of the total number of hours requested within the region
(Table 5.3.1).
Almost 80% of applications came from artisan businesses, which accounted for almost 83% of the regional total of CIG/D hours; 11.7% came from industry and 7.2% from tertiary enterprises. Small enterprises with fewer than 15 employees made the most applications: the sector most affected was manufacturing (77.5% of the total companies), mainly the metal, metal-production and fashion industries
(Table 5.3.2).
Precautionary measure or real need
As the demand for the Wages Guarantee Fund is so high, we should ask whether businesses actually need it or whether they are just taking a precautionary measure. An INPS press release in early February 2010 highlighted that Italian businesses used 56% of the requested hours in 2009 compared with 73% the previous year. Note, however, that 56% corresponds to about 515 million hours, a number far higher than the one requested in previous years.
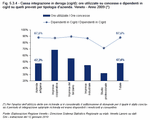
Veneto Lavoro figures can be used to analyse real use of CIG/D hours by looking at the subset of applications for overall CIG in 2009; an overall balance reveals that CIG/D accounted for 34% of the total applications during 2009, which covered a potential number of more than 17,700 workers and almost 9.5 million hours. Overall, Veneto businesses used 47.6% of the CIG/D hours authorised, which were used to cover 87.6% of the employees envisaged; the percentage of CIG/D hours used by artisan businesses was practically identical, whereas professional studios had the lowest percentage. It is therefore reasonable to assume that Veneto's businesses used both prudence and prevention as the crisis worsened
(Figure 5.3.4).
 One foot out of the network: redundancies
Whereas the Wages Guarantee Fund ensures that a worker still retains his or her position as a company employee, the
Istituto della mobilitÓ supports redundant workers by helping them to find work elsewhere, as it provides tax breaks to companies who employ redundant workers enrolled on mobility lists, and by providing workers with an allowance; this allowance is envisaged for workers affected by collective redundancies or those made redundant by medium and large enterprises after periods in the special Wages Guarantee Fund (Law 223/91)
(Note 3). However, workers who are made redundant by small enterprises and who enrol on mobility lists (Law 236/93) can claim unemployment benefit if they are entitled. Note, however, that from 2009 the social security network was also extended to the latter group so that they too receive the equivalent of a mobility allowance, which is included in the funds earmarked for that year's social security, notwithstanding the provisions in force.
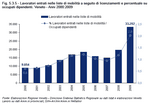
In Veneto in 2009, more than 33,000 workers were made redundant and enrolled on mobility lists; this figure was 69.7% more than in 2008 and almost four times more than the figure for the year 2000. In recent years, individual redundancies have weighed most heavily on the overall number of redundancies; they are also the type to have risen the most on last year's figures, as they reached around 23,250 units, accounting for 69.8% of workers who enrolled on mobility lists, compared with the 10,054 workers affected by collective redundancies; the figure for individual redundancies is up by 82.2% on 2008, while the figure for collective redundancies rose by 46.3%.
At provincial level, it was once again the central area of Veneto that was hit hardest: Padova and Treviso each accounted for 21.1% of the regional total, followed by Vicenza with 19.6%.
For more detailed analysis of the difficulties Veneto's labour market is facing, we should also look at the ratio between the overall number of workers enrolled on mobility lists and the number of employed persons, which will provide an estimate as to the percentage of people made redundant. In one year, Veneto's figure rose from 1.2% in 2008 to 2% in 2009, an increase of almost 1.5% on the figure for 2000
(Figure 5.3.5).
Although the number of collective redundancies in the textile and clothing industry fell, the number in the metal-working industry grew, to the extent that in 2009 it accounted for almost one third of all the workers who enrolled on mobility lists. As with collective redundancies, individual redundancies were also most common in the manufacturing industry (collective accounting for 72% of total redundancies and individual 42.3%); the sectors with the most workers enrolled on mobility lists were metal-working (17.8%), construction (16.6%) and trade (15.2%).
Supporting the unemployed against exclusion
Unemployment benefit supports redundant workers by ensuring they have some sort of income, thus reducing the risk of social exclusion and marginalisation. This group includes workers who do not resign voluntarily, unless they have just cause to (unpaid wages, sexual harassment, change in job description etc.). The main types of benefit, apart from agricultural subsidies, are standard unemployment benefit, a reduced form of unemployment benefit, and mobility allowances
(Note 4). Due to the effects of the crisis, an extended form of mobility has been introduced for workers who are not covered against unemployment, thus extending the network of services to an additional section of workers in difficulty.
In 2009 about 202,000 of these applications (excluding agricultural subsidies) were made in Veneto: almost 149,000 for standard unemployment benefit, almost 42,600 for the reduced form of unemployment benefit, and about 10,750 for mobility allowances. Compared with figures for 2008, the first type of benefit suffered the biggest increase in Veneto: up 79.6% against a national figure of 60.7%. Veneto also contributed a higher share of standard unemployment benefit applications to the national total: 9.9% in 2009, up from 8.9% in 2008.
Veneto showed a particularly sharp upturn in the applications for mobility allowance, which rose by 51.5% on 2008, yet demand for the reduced form of unemployment benefit was more contained (+9.7%).
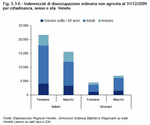
As regards the number of people receiving benefit, if we look at standard unemployment benefit (excluding agricultural subsidies), which accounted for 73.6% of the total benefit requested in Veneto in 2009, Veneto Lavoro figures show that 48,505 people were receiving benefit by 31 December 2009. In line with the sub-chapter that looked at those most at risk of exclusion from the labour market, 53.7% of those receiving benefit were women, 20.4% were young people under 30, and 18.9% were elderly; almost one in four were from abroad
(Figure 5.3.6).
 Employment Centres (CPI): where supply and demand meet
As a response to the crisis, one of the main active policies involved the role of the Employment Centres (CPI), where supply and demand meet; CPIs are required to deal with people's real needs, and provide guidance, as well as training, both for first-time job-seekers and those looking to rejoin the market. An unemployed or jobless worker who goes to a CPI declares his or her willingness to seek work and signs an agreement that lays out the general conditions of a CPI's services and how a worker may benefit from them.
In 2009 in Veneto, almost 59,000 workers signed this agreement during their first interview at the CPI; the majority went there during the first month of being unemployed (70.2%), while an additional 13.2% went within the first six months. Almost 28% were foreign workers, mainly men, while women accounted for the majority of Italian citizens.
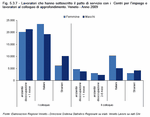
Figures for people who also attended a second interview are also interesting: this encompassed more than 22,500 people (59% were women) who had been unemployed for less than six months
(Figure 5.3.7).
In times like these when it is difficult to find employment, it is increasingly necessary to create a safety net and CPIs are a key means of achieving this.


