It wouldn't make any sense to analyse the school system, seen as a continual progression which links in with each pupil's lifestyle choices and attitude, without taking into consideration the choices made on the way out of the system.
The choice of university is second only to the choice of upper secondary school in terms of important decision making, as young high school graduates are required to carefully look into themselves and analyse the expectations, interests and abilities gathered and ripened during their school career.
Choosing an upper secondary school often plays an important role as it represents the first step towards choosing a university and prepares the student to have an awareness of the importance of future choices.
In order to fully understand the choices made by young people and the outcomes of educational careers, it would be wrong to attempt to establish relationships and links by looking at rigidly compartmentalised school sets; it is much more important to have an overall view of the school career as a network which takes in children at a tender age and tries to give them back to society as educated and mature individuals who are able to carry out their lives autonomously and responsibly.
The nodes making up this network stand for moments of change along the way, moments which are inextricably linked with life experiences, all of which contribute towards creating successful life and work situations.
Dropping-out, changing degree courses and not reaching graduation are all the result of young people not having adequate decision making strategies and therefore having to start over again. In order to avoid these situations, universities must not close in on themselves but be aware of the roads travelled by their students, taking into account where they have come from and where they are headed.
 First-year university students in Veneto
University is the most common choice of further education after upper secondary school; by looking at the number of students who sign up for university in a particular year compared to the number of high-school graduates the previous year we can, in some way, document this choice.
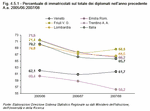
In the 2007/08 academic year, 61.7% of high-school graduates from the previous school year signed up for university; this is four percentage points lower than the Italian figure.
Of Veneto's neighbouring regions only Trentino Alto Adige had a lower figure (56.2%); this is a consequence of the large slice of German-speaking students from Alto Adige who tend to go off to Austrian universities due to the lack of local opportunities or for cultural reasons. The region in the North-East with the biggest share of university first-years compared to high-school graduates from the previous year was Friuli Venezia Giulia, with a figure of almost 69%. In this region there are two universities, Trieste and Udine.
The introduction of the three-year degree course in the past had encouraged a higher number of students to start university, but if we look at the trend over the last three years, recently the share of university first-years compared to the previous year's high-school graduates has been dropping, although it is picking up in some regions such as Veneto and Friuli Venezia Giulia
(Figure 4.5.1).
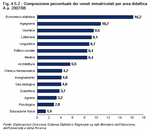
Using the "percentage of first-years by field of studies" indicator, we can get an indirect picture of young Veneto high-school leavers' expectations and attitudes, elaborated during their years at school and also influenced by society and the world of work.
In the 2007/08 academic year, the highest numbers of students signed up to study in the field of economics and statistics; at 16.2% this is in line with national figures. This was followed by engineering with 10.7%, law with 9.5% and arts with 9.1%
(Figure 4.5.2).
 Push and pull indexes
A university's ability to attract students from non-bordering areas stems from its ability to provide a comprehensive offer, its reputation, based on a long history, and the added value that studying in one specific university can provide. As well as this, universities can also gather in those students living nearby.
Both of these sets of students give a measure of how attractive a university is. Therefore, universities have to be able to balance keeping students of its own region in the area and at the same time pulling in students from other regions who are interested and willing to move around to attend university.
In both cases these are indirect measures of perceived quality which universities nowadays, within a context of constant university reform, have to stand up and measure themselves against.
The rise in the number of new universities in recent times has made university more accessible locally, yet it has not reduced student mobility. There is therefore a need, for Veneto universities too, to respond jointly, moving as one, within the context of a system of shared rules, in order to work towards efficient strategies for the development of the regional community.
In the 2007/08 academic year, one out of four students from Veneto decided to enrol in a university in a different region; in particular, more than 7% headed towards universities in Friuli Venezia Giulia, almost 7% to Emilia Romagna, mainly Ferrara, 3.7% went to Milano, 3% to Trento, 1% to Roma and 0.6% to Siena
(Table 4.5.1).
Apart from a few large centres with a lot of pulling power, such as Roma or Milano, it is the universities in areas bordering Veneto that lure a large share of students away from their home region.
However, Veneto universities do not draw in an equivalent number of students from elsewhere to replace those who leave the region for other universities.
Overall, 18.5% of all Italian first-year students in Veneto universities are from another region: almost all of these attend university in Padova or Verona (8% and 7.1% respectively). If we also add on international students, the share of non-Veneto first-year students in Veneto universities increases by almost a further five percentage points
(Table 4.5.2).
Similar to the choices made by Veneto high-school leavers, a large share of this 18.5% comes from neighbouring regions: 5.1% from Lombardia, 4.9% from Trentino Alto Adige, 2.8% from Friuli Venezia Giulia and 1% from Emilia Romagna.
 First-year students in Veneto
If we look at the place of origin of first-year students in the four Veneto universities, we can see some differences between them: for example, in Verona, 43.3% of students are actually from the province itself, whereas for the Venice University Institute of Architecture (IUAV), this figure drops to 20.1%.
In contrast though, it is actually the University of Verona which has the biggest share of first-years from other regions, with 27.8%. This figure decreases greatly to 16% for the IUAV, to 15% for Cą Foscari University in Venice and to 14% for the University of Padova. The University of Verona also has the highest share of international first-year students (6.5%).
In terms of the distribution of students based on the grade obtained in their high-school diploma, for the 2007/08 academic year, it is clear that the students at the University of Padova, on average, were those with the highest grades. As a matter of fact, almost 27% of first-years in Padova got a score of 90 out of 100, or over, on their high-school diploma.
Further confirmation of this trend lies in the fact that in Padova again, only 23.6% of first-years got a score of between 60 and 69; this is the lowest share out of all the universities. This means that on average, students who sign up for the University of Padova have a higher score on their diploma, which could be an indication that admissions at the university are more selective and are also based on the diploma score.
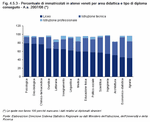
An analysis of the type of schools first-year students in Veneto in the 2007/08 academic year came from shows some definite links: there is a certain correlation between the type of upper secondary school and the field of studies undertaken at university
(Figure 4.5.3).
For the different fields of studies, there are large differences in the numbers of students coming from technical and professional schools: in fields such as psychology, geobiology, chemistry and pharmacy, the share of students who attended a technical or professional school is just under 20%, whereas for fields such as economics, statistics and agriculture, this share is around 50%.
Therefore, it is vitally important to university planning to know and take into account students' previous educational careers. This is further confirmation of the fact that the whole school system should be seen as a network, containing many different but closely linked threads.


