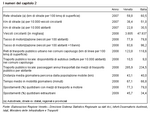
A few simple pieces of information can help to give an idea of the general nature of mobility in Veneto.
Over the years, the time spent travelling and the distance travelled every day have increased. Motorised transport remains the most common means. Every day, in 2008, the average person travelled 43 km and spent 67 minutes travelling; 77% of these journeys were carried out using a motorised vehicle.
Some interesting features emerge when we look at the differences between mobility in the city centres and in the outskirts.
On an average working day in Veneto in 2009, there were an estimated just over 10.5 million journeys carried out. This figure was up on 2007 (+7.7%) and 45.7% of the journeys were from one municipality to another. The share of journeys taking people outside of their home municipality is much higher in the smaller municipalities (69.3% in the municipalities containing up to 5,000 inhabitants).
When we move in from the outskirts to the city centre, the types and times required for mobility change. Mobility demand in the urban centres is high and scattered, trips are mainly short and repetitive, or often one-offs; private means of transport are much used in order to get to a destination as quickly as possible, but people do seem to prefer to use motorcycles rather than cars.
In 2008 public transport in the capital municipalities in Veneto carried 286 passengers per inhabitant, this was an almost 12% increase on the previous year and a 26% increase compared to 2000. There has also been a general increase in the use of motorcycles, in particular in the main capital municipalities: in Padova in 2008 there were 122 motorcycles per 1,000 inhabitants on the roads, 42 more than in 2000; in Verona there were 118, 45 more than in 2000.
(Chapter 2 in figures)


