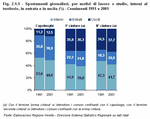
In the last 30 years in Veneto, people have flocked away from the cities: data from the last census shows that from 1971 to 2001 many residents of capital municipalities and major urban centres decided to move out to the suburbs. The reason behind this is that people prefer to live in a place where prices for renting or buying houses are more affordable; work and study have much less of an influence on people's choice of area of residence and the consequence is that many more people now commute for longer distances. In 2001 the share of journeys remaining within the same area, be it the capital municipality or the first or second suburban belts, decreased and the number of journeys into or out of the area increased
(Figure 2.1.1)
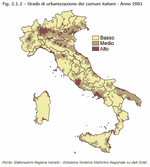
A map of Italian municipalities by degree of urbanisation
(Note 1) gives a good idea of the nature of conurbation layout in Veneto: almost 54% (Italian figure: 39.3%, EU27 figure: 25%) of the population live in municipalities of intermediate population density and around 40% in densely populated municipalities (Italian figure: 44.6%, EU27 figure: 47%)
(Figure 2.1.2)
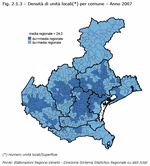
The situation is similar as far as the localisation of production is concerned, especially in certain sectors. As a matter of fact, over the last twenty years, due to social-economic factors, Veneto's business fabric has seen a lot of movements within the territory. Specifically, at the same time as a number of the population was moving out from the centres to the suburbs, the areas around the capital municipalities were slowly becoming more urbanised. As a consequence, the need to provide services to these areas increased which, in turn, gave rise to the tertiarisation process which resulted in the springing up of numerous new production activities in these densely inhabited areas. For example, if we look at the regional density of local industrial and service units, we can see a high concentration of manufacturing facilities around the Verona - Padova - Treviso axis and around the provincial capitals, where the density value is higher than the regional average
(Figure 2.1.3)
Since everyone weaves their own web of relationships, linked to their own worlds made up of their families, work, free time etc., this type of distribution of people and businesses over the region is bound to create a widespread demand for mobility, both within the cities and in terms of cities-to-suburbs mobility. This is due to the increasing number of people who have to move around daily for whatever reason.
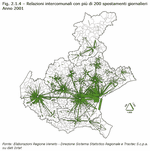
For the 2001 census, an in-depth study was carried out into daily commutes, which revealed some interesting results. Veneto people move around both for work and for study much more than they did at the beginning of the 1990s: daily journeys within the region were up 2.2%, in 2001 these amounted to precisely 2,319,188. Travelling was concentrated mainly along the central strip of the region, in particular within large areas of Verona, Padova and Venezia, as can be seen from the map of commuter flows from municipality to municipality. On the map, every arrow stands for the movements of at least 200 people who head off to work or school every morning and head home again in the same day. More people travelled out of their home municipality, especially workers; as a matter of fact 33.2% more people travelled to another province every day
(Figure 2.1.4)
Today we can only get information on the evolution of the situation from data from sample surveys which are carried out scientifically but which don't give us the same depth of detail as a census. Data from the Isfort-Audimob study
(Note 2), processed and presented in the paper entitled 'Mobility outside of cities in Veneto: characteristics, dynamics, comparisons'
(Note 3), can help to understand how commuting is changing and evolving. An indicator which may seem banal such as movements in and out of one's municipality can actually give us some useful input both for a more focussed interpretation of the model of regional mobility, and to better define territorial, urban and transport policies on different levels. We will discuss here the main results from the Isfort-Audimob study, which demonstrates the main characteristics of mobility outside of cities in Veneto and compares them with national figures and with other regions.
Since results show that during the day people move around many times for various reasons and often over short distances, it seems that we are moving away from that slightly stereotypical image, which was quite widespread up until a few years ago, of a model of mobility which was completely centred on the idea of commuting for work over medium and long distances. Furthermore, mobility-both within and outside of the cities-differs from region to region. For example, we have discovered that in a lot of respects Veneto is very similar to Lombardia, the region which traditionally is its competitor, but it is very different from Emilia Romagna.
Daily journeys
Based on Audimob data, Isfort estimates that on an average working day in Veneto in 2009, just over 10.5 million journeys took place; this is higher than in 2007 (around 9.8 million, with a +7.7% variation in the two-year period).
An interesting figure to point out is that overall the seven municipal capitals provide the destination for just under 10% (9.1%) of overall journeys by citizens, and around 20% of the subset of mobility outside of cities (in 2007 the weightings were similar to each other). The pull, therefore, of these urban hubs within the region is important, but movements from one municipality to another between smaller centres does prevail.
If we take a look now at the individual capital municipalities, estimates of daily movements into the area from anywhere else-it's worth highlighting though that almost all of the movements originate from a Veneto municipality-show that Padova has the greatest pull (around 2.1% of all commutes in Veneto and 4.7% of journeys originating outside of the cities). Padova is followed by Venezia and Verona, and then, not too far behind, come Treviso and Vicenza
(Figure 2.1.5)
In 2009 again, 45.7% of overall journeys by Veneto citizens crossed the borders of municipalities. Veneto has a much higher share of mobility outside of its cities than the national average, standing in 2009 at 34.4%. Of the four major Italian regions taken into comparison here, only Lombardia has a slightly higher figure (46.4%), while Emilia Romagna and Toscana have much lower figures for mobility outside of cities (32.6% and 35.5% respectively). There is no doubt then that in Veneto the links between urban systems, which can be seen through the mobility of its residents, are more intense than in the rest of the country
(Figure 2.1.6).
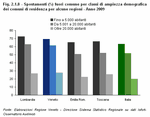
One explanation to the differences in distribution of mobility in and outside of cities in Veneto and Lombardia, compared to the national average and to other large central-northern regions such as Emilia Romagna and Toscana, may be provided by an analysis of regional population distribution by size of municipality, although this type of analysis has yet to be completed
(Figure 2.1.7)
In terms of administration, the region of Lombardia is divided into more than 1,500 municipalities; this is almost 20% of the total number of municipalities in Italy. The region is made up of a scattered constellation of urban centres. The average size of the municipalities is just 15.4 kmē, that is less than half of the national average (37.2 kmē). Furthermore, 58% of the region's residents live in centres which count fewer than 20,000 inhabitants (22% live in centres with fewer than 5,000 inhabitants), this is compared to a national average of 47.1% (17.3% in towns with fewer than 5,000 inhabitants). Municipalities in Veneto tend to be split into bigger parts than in Lombardia-there are 581 municipalities and an average size of 31.7 kmē-but smaller centres do stand out for their popularity: 62% of the population lives in urban areas counting fewer than 20,000 inhabitants and just 23.2% live in cities of over 40,000 inhabitants (the Italian average is 38.3%; Lombardia is also below the national average with 29.2%). Conversely, Emilia Romagna tends to have much larger municipalities, which have an average size of 64.9 kmē: this is more than four times the size of municipalities in Lombardia, and more than double those in Veneto. Consequently, a higher percentage of the population lives in much more populated areas (35.8% of citizens live in cities of over 100,000 inhabitants; this is compared to the national average of 23.2% and to the Veneto average of 17.7%). Lastly, the average size of municipalities in Toscana is rather large, equalling 80 kmē. As for the population distribution, medium-size municipalities (40,000 to 100,000 inhabitants) house a sizeable 26.2% of regional residents; this is compared to the national average of 15.1% and the tiny Veneto average of 5.5%
(Table 2.1.1)
Basically, where the population is more spread out across the region and where, above all, municipalities are smaller-as is the case in Lombardia and Veneto-it is less likely that people make their journeys, even short-distance ones, within their own municipality.
If we combine the data on movements between municipalities with that on distribution by demographic size of municipalities, there is a macroscopic difference between the smaller centres (up to 20,000 inhabitants) and the larger ones (over 20,000 inhabitants) with regards to the distribution of demand for mobility in or outside of the cities
(Figure 2.1.8)
In Veneto in 2009 the share of journeys taking people out of their own municipality was 69.3% for residents of smaller centres (up to 5,000 inhabitants) and 61.4% for residents of centres with between 5,000 and 10,000 inhabitants (these figures are much higher than the national average of 45.7% as we have seen). This share then drops to 27.8% in the urban areas containing more than 20,000 inhabitants. This same disparity can be seen on a national scale (mobility outside of the cities is 63.3% in smaller towns and 20% in centres of more than 20,000 inhabitants), in Lombardia (from 72.2% down to 26.3%) and in Emilia Romagna (from 65% to 22.1%).
Reasons for movements and means of transport used
In order to look more closely at the characteristics of mobility in Veneto, a segmentation analysis can be carried out of reasons for movements and means of transport used, which are perhaps the most important aspects to describe demand for mobility and to help determine policies in this field.
Work and study provide the main reasons for journeys from one municipality to another. This is the case in Veneto, as well as in the rest of the country, as is only to be expected. Journeys for work tend to be longer and more regular on average and fall mostly under the traditional idea of the commute, where a percentage of the population moves daily towards certain areas (cities, production districts, centres of education etc.) which are often located outside of their home municipality. Differently, movements made for domestic reasons tend to be much shorter and normally focus on reaching nearby services (take, for example, daily purchases, be they small or not so small). In terms of journeys for work or study, in Veneto in 2009 62.6% of these took citizens outside of their home municipality (this has increased unevenly over the last 3 years: in 2006 this share was 57.5%); this is much higher than the Italian average (46.9%) and in line with the figure for Lombardia (62.4%). Figures for Toscana and Emilia Romagna are much closer to the national average than those in Veneto and Lombardia. Matters change however, for journeys made for domestic reasons: only 32% of trips in Veneto took people out of their home municipalities. This figure has decreased since 2006 (35.9%) but is still much higher than the national average (24.6%), than the figure for Toscana (24%) and for Emilia Romagna in particular (just 20.1%). It is worth pointing out that in Lombardia, movements for domestic reasons create a much higher demand for mobility outside of cities than in Veneto, equalling 36.3% of total demand. Lastly, 40.6% of trips for leisure purposes in Veneto take people outside of their home municipality. This figure is in between those for work/study and domestic reasons (but a lot closer to the latter), and is quite far from the national figure (29.4%) and from Toscana (32%) and Emilia Romagna (29.2%). This figure has remained mostly stable in the last three years. In this case the figure for Lombardia (37.8%) is lower than for Veneto, unlike the figures for trips for domestic reasons
(Table 2.1.2)
If we move on now to the means of transport used and take into consideration only the differences between private and public means, it emerges that the biggest share in Veneto is the demand for mobility from municipality to municipality using both types of means of transport
(Table 2.1.3)
In Veneto in 2009, 58.2% of journeys using private means of transport and 62% of journeys on public transport were to destinations outside of the traveller's home municipality.
Data shows that the use of public transport to move from one municipality to another has increased in Veneto in the last few years. This is not the case in a lot of Italian regions.
Characteristics of people on the move
Some interesting facts emerge when we take a look at the different types of people on the move.
In Veneto in 2009, 48.3% of journeys made by men and 42.9% of journeys made by women took them outside of their home municipalities. Both of these figures are higher than the national average, but there is a bigger gap between the two genders in the figures for Italy overall: 38.7% compared to 29.8%. This could be an indirect indication of a higher level of 'equal opportunities' in Veneto compared to the rest of the country: women move around more and not only within the short range, which is typical of those who travel around for domestic reasons. This may mean, however, that they have more issues to deal with in terms of juggling work and family.
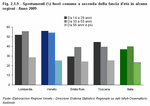
There is also quite a difference between older people and the rest of the population, both in Veneto and in the rest of the country. To be specific, in Veneto in 2009 journeys made by young people (aged 14-29) and by those in the middle range (aged 30-55) outside of their home municipalities made up 56.1% and 54.1% respectively of total journeys. Those made by people aged over 55 make up a mere 25.4% of total journeys
(Figure 2.1.9)
Lastly, let's take a look at the way demand is distributed amongst people of different standing in terms of employment. Data confirms trends that were to be expected: journeys made by workers-both employees and the self-employed-and by students make up a much higher share of movements outside of cities than those of the weaker non-active population groups (the elderly, housewives) and the unemployed. This difference was particularly noticeable in Veneto in 2009
(Figure 2.1.10)
Apart from Isfort data, we can also use data on motorway use for information about mobility outside of cities seeing as the motorways are being used more and more for short distances, as if they were highroads or ringroads.
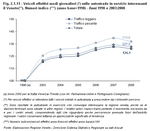
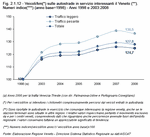
Up to 2007 traffic flows on the motorways increased consistently, then 2008 seemed to signal a slowing down, in particular with regards heavy goods transport, as a consequence of the current economic crisis. As a matter of fact, data on motorway traffic in Veneto for the ten-year period 1998-2007 shows a significant increase (+29%), both in the number of vehicles joining the motorway and in the number of kilometres travelled along it. In 2008, however, the first negative figures started to appear. Vehicles joining the motorway decreased by 1.3% (heavy goods traffic by 2.1%) and the number of kilometres travelled decreased by 1.1% (heavy goods traffic by 1.5%)
(Figure 2.1.11),
(Figure 2.1.12) and
(Table 2.1.4).
There is no doubt that much is being invested in solving the age-old problem of enormous delays in the development of infrastructure in Veneto: after the completion of the
Passante di Mestre, the new Mestre Bypass, the next step is to carry out work such as a third lane on the motorway between Venezia and Trieste; the Pedemontana highway; the Padova ringroad; the Nogara-Adriatic Sea motorway; the Valdastico North and South motorways; the Romea motorway. We should not forget, however, that the model of mobility must be based on a complex system where, in a rational and above all environmentally-friendly way, a range of transport models interact to create a network made up of networks. The aim has to be to link the main hubs of economic relevance-not only local airports, ports and main airports but also hubs of culture, tourism and health-and to encourage the use of alternative means of transporting people and goods. In this light, certain initiatives being carried out may prove to be useful, such as park-and-rides being built near the motorway tolls, reduced fees for goods transport arriving in or leaving Veneto which use the railways or waterways, and, more than any other, the creation of the Regional Metropolitan Rail Service (the SFMR), a network of regularly running high-speed regional trains, through which the hope is to improve link-ups within the central part of Veneto by shifting a large share of traffic off the roads and onto the railways. The SFMR intends to reach this aim by creating a new system of integrated transport in which transport is provided by the railways, by services travelling on the roads and by individual means of transport all closely integrated one with the other. Besides the trains themselves, the system revolves around new road services to take passengers to the stations combined with large areas for parking. The first sections between Mestre, Padova, Castelfranco and Treviso are due to be open by 2010.
It should be pointed out that a project like the SFMR may be able to satisfy part of the demand for mobility in an area like Veneto if we take into account that commuter demand for rail services is mainly concentrated here, in Lombardia, Lazio, Campania, Toscana, Piemonte, Emilia Romagna and Liguria. If we put all these regions together they number more than 2 million travellers per day, more than 80% of the national total.


