|
14 - Veneto, competitors and European regions
In this edition of the Statistical Report, as in previous editions, a chapter is dedicated to the comparison of Veneto with other Italian and European regions and with groupings for comparison such as Italy and the European Union. Comparisons are made above all with Lombardia, Piemonte, Emilia-Romagna, Toscana, Baden-Württemberg, Bayern, Cataluña and Rhône-Alpes. These regions are considered Veneto's competitors as they all have fully developed economies, high incomes and generally quite similar social dynamics. However this chapter has a new ingredient: we have tried to offer an insight into the varied panorama of European regions, which reveals similarities and differences according to certain socio-economic features. The aim is to capture elements which permit the assessment of the quality of life, a multidimensional concept which is difficult to quantify through a single unit of measure. It is conditioned not only by objective features, but also by people's perceptions, i.e. subjective judgements. Even if only the most objectively measurable factors are considered, they represent the multiple facets of the notion of quality, and are difficult to put together into a single indicator of common wellbeing.
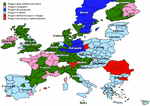
Six sectors of interest which are deemed capable of providing an indication of a region's quality of life have thus been identified: the economy, employment and education, innovation, tourist appeal, population and health. Some basic indicators were chosen for each of these sectors, and then through factorial procedure were re-elaborated into synthetic measures (factors). Starting from these synthetic factors and through the statistical procedure of cluster analysis, European regions were grouped together according to internal similarities and characterised by key features which distinguish them from other groups. The first part of the chapter reports on the results of the cluster analysis. As well as the map of European regions subdivided into the six typological groups identified through clustering, a description of the main characteristics of each group is presented and a map of the characterizing feature, a composite indicator obtained from a combination of several variables. In the second part of the chapter there is a series of charts relating to the significant indicators also used in the cluster. In each of the indicator charts Veneto is compared with competitor regions, Italy and the European Union. For each indicator chosen there are three graphs. The first refers to the time series for the last five years; the second to the value for the most recent year available, and the third, which is slightly more detailed, refers to the percentage variation for the five years in question, to the percentage variation and the value of the last year. Important information
For the factor and cluster analyses, the indicators used were calculated from Eurostat and Espon data. Three factors affected the results of the analysis: missing regional data which have been replaced with national averages; difference between regions and indicators in terms of time of available data - so for each European region the most recent year for which data is available has been considered; and lack of information for certain sectors of interest.As regards processing of the indicator charts, the analysis is based mainly on Eurostat data. For each topic attempts have been made to show trends through the study of the time series. However, as it has not always been possible to reproduce the same years, the most recent updates available are presented. For Veneto, recent data is available for almost all the topics, but to make comparisons, values of the same time period for all the regions analysed have been used. Indeed some differences may be noted between the data presented in the first part of this report and those that follow: this is due to the need to make them conform to each other and to some Eurostat definitions that do not always exactly correspond to the official ones used at a national level.
The mapping of the European territory which emerges from the statistical analysis carried out is generally in line with what one would expect if one knows the territory studied, and also with what was reported by the European Commission in its "4th Report on Economic and Social Cohesion".
The 27-member Europe that we know today is the result of the enlargement process which began in May 2004 with the accession of ten new Member States, and which concluded on 1st January 2007 with the accession of Romania and Bulgaria. The new member states, due mainly to their internal differences, have increased the challenges in achieving the Lisbon Strategy Objectives established in 2000, which were revised in 2005 as a strategy for sustainable economic growth, i.e. new and better jobs and greater social cohesion. Indeed there is considerable socio-economic disparity between the member states and between the regions. This disparity in terms of income and development stems from structural weaknesses in some key factors of competitiveness such as investment in material infrastructure, innovation, human resources and sustainable development. As a result, some regions grow at twice the speed of the group's average and others develop at average rates lower than 1% per year. The challenge of the cohesion policy lies in investing in competitiveness to allow the member states and the regions to overcome their respective structural problems. According to the European Commission's fourth report, "as a result of a rigorous approach, cohesion policy has succeeded in making a difference to standards of living and levels of opportunity across the Union." Progress has been made, particularly in new member states, in terms of GDP, GDP per capita, support for investments and creation of jobs, productivity, support for innovation and investment in human capital. However despite this progress there are still significant differences, in absolute terms, between nations and regions. This is due in part to enlargement and in part to the fact that in its early stages, growth tends to be concentrated in the more dynamic parts of nations. From the analysis carried out, six groups of regions have been identified, whose composition is of no great surprise. They provide evidence of the differences between nations and regions, and highlight the most obvious disparities and delays for new member states and for those of Southern Europe. The regions with greater economic and social stability belong to the first group of original member states of the European Union, the ex-EU 15; the ten states that acceded in 2004 have made great progress and reached the same level as the rest of Southern Europe; of the latest accessions, Romania and parts of Bulgaria are developing late but with good potential for the future, thanks also to the financial support of the EU's cohesion policy. (Figure 14.1)
The first group, with 111 regions, is the largest and includes territories of nations which made up the original EU 15. The group is made up of Holland, Luxemburg, Denmark and some regions in Ireland, Great Britain, Belgium, France, Austria, Spain, Germany as well as some Scandinavian regions. Italy is divided in two groups, but the regions that fall in this first group are Veneto and the other northern regions (with the exception of Valle d'Aosta and Trentino), as well as Toscana, Umbria and Lazio. All of Veneto's competitors are in this group as well as capital city regions. These may be included even if the rest of the country is not in the same group. This reflects the trend for new urban centres of growth to emerge.
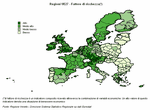
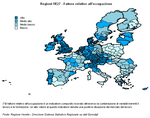
The regions under observation here have solid, structured economies though they have had to face marked cyclical weakness in recent years. They are characterized as having the highest economic well-being in Europe, as the map indicating "factors of wealth" in Fig. 14.2 reveals. The level reached in secondary and tertiary sectors by these regions, whose natural increase is lower than that of regions going through full economic restructuring, is considerable, as is the level of investment in research and development. As can be expected, levels of employment and professional training are also high: an educated and qualified workforce is key to a competitive economy. Population growth in these regions is due mainly to high net migration, which derives from the appeal of these regions' socio-economic features for foreign citizens. People's health is considerably better than the European average, probably due to the reasonably healthy lifestyle. Proof of this is the high life expectancy which makes the elderly account for a considerable part of the population. (Figure 14.2)
This group includes some regions of Finland, France, Belgium, Spain and some from across the Channel.
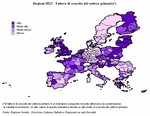
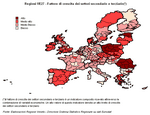
What is immediately striking is that Nordic areas and Mediterranean areas fall in the same group. What they have in common are above all high demographic growth due to live births and economies based mainly on the primary sector. These characteristics link these regions to a more rural lifestyle than other regions of central-northern Europe. These territories have fairly good levels of well-being and while growth is low in secondary and tertiary sectors, in the primary sector it is good. Some regions in this group are among those European regions with the highest values as regards growth in the agricultural and livestock sector, as can be seen in the map related to the factor "growth in primary sector". Although education and training of young people and adults is given importance, there are some critical points in these regions regarding the employment sector. The tourist appeal of these regions is below the European average, as is progress in the sector of research and development. The demographics are quite dynamic, with good natural increase and young populations. As regards other features, within this group there are some regions which are more heterogeneous. Regions in the Mediterranean basin have a lower rate of alcohol-related mortality and suicide than those in Northern nations, which demonstrates greater perception of well-being and quality of life. (Figure 14.3)
This is the most difficult group to describe as it does not seem to have a particularly distinctive feature. The regions in this group score well on many indicators linked to economic well-being and would seem to fit in with the economically solid groups previously described. But what makes them differ are some indications of social malaise, hence 'the paradox' (in the title).
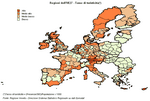
The group includes several Swedish regions and a few German ones. These areas invest not so much in agriculture and livestock, but in research and development. Swedish regions in particular spend a great deal on this sector and also invest a lot in terms of human resources. Social indicators such as university education and lifelong learning during employment are also positive. However it is indicators that describe levels of individuals' "happiness", satisfaction, physical and psychological well-being, that are giving negative signals. As observed in the 4th Report on Social and Economic Cohesion by the European Commission, there is a strong tendency for outwards migration in these regions. It is young people in particular who are looking for job opportunities elsewhere. Furthermore the incidence of suicide or alcohol-related death is higher than the European average, a negative indication of what might be the degree of life satisfaction on the part of citizens of these north European areas. Finally the population is characterized by a significant elderly component, limited mortality and high birth rates particularly in Scandinavian regions. (Figure 14.4)
This group includes most of the regions in Mediterranean Europe, particularly in Italy, Spain, Portugal and Greece, some British regions, all regions (except for two) belonging to the ten Member States who joined Europe in 2004 and Bulgaria (except for one region). The Italian regions that belong to this group are those in the south and on the islands, as well as the Marche.
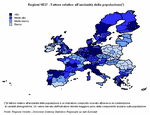
As the European map for the "employment factor" shows, what makes this group stand out is the worrying employment situation particularly in the Mediterranean areas, except for Portugal, and most regions of Eastern Europe, where employment rates are low, even for the younger population, and there is little investment in training. These regions have modest economic wealth, and still focus on the primary sector, ignoring investment in industry and services and particularly in research and development. The population structure is quite diversified within the different geographic areas: In Eastern European regions the aged population weighs less than the European average, though this is not true for other regions in the group. The fact that the ten new member states and almost all of Bulgaria belong to the same group as Mediterranean regions can be seen as a positive result of European economic and social cohesion policy. The Commission reports that "it is the new Member States, particularly those with a low GDP per capita which have shown the greatest growth and have been fastest to bridge the gap". The GDP of Estonia, Latvia and Lithuania almost doubled from 1995 to 2005, while growth rates for Poland, Hungary and Slovakia have more than doubled in comparison with the EU average. (Figure 14.5)
This group contains all regions of Romania and some in Bulgaria, Slovakia and Poland.
These are the least rich and sound from an economic point of view. They have very low GDP but it is developing, as revealed by the growing investment in secondary and tertiary sectors. On the basis of current growth rates, the European Commission believes that these regions will take over 15 years to obtain a GDP per capita equivalent to three quarters of the European average. In order to reach this objective, the regions in this group are focusing on the development of key market sectors, secondary and tertiary sectors, as shown in the map in Fig. 14.6. These territories do not invest enough in training their citizens: not only are employment rates low, but levels of university education and lifelong learning are well below the European average Companies working in these territories are not yet focusing on research and development, as the low expenditure in this sector reveals. The demographic profile of these regions reveals quite a young population, with average birth rates compared to the rest of Europe, and a tendency to have children at a young age, which makes population change faster. As well as a health care system which is still developing, this group also has rather high mortality rates compared to the European standard. (Figure 14.6)
This group is made up of a considerable number of regions with good employment levels, which in part explains the high net migration of the area.
Investment in training is limited: there is a low share of graduates and limited investment in lifelong learning The health of the population is good, mortality is limited, thanks also to an efficient health system. What distinguishes this group is undoubtedly the high development of tourism, which is the main driving force of the economy of these regions, together with activity in the primary sector. This group includes mainly coastal and mountainous regions, which are different from other regions in that their economy is almost exclusively based on tourism. The tourist density of regions in this group is among the highest in Europe. Growth in other sectors, such as the service sector, is more moderate, and there is little investment in research and development. Trentino Alto Adige and Valle d'Aosta are the Italian regions that fall within this group. (Figure 14.7) |
|
|
|
|
|
Population on 31st December
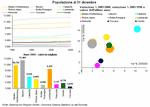
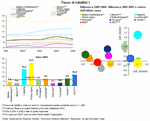
The demographic evolution of a territory reveals important social aspects, which influence the quality of life: from increased longevity to better health and better economic well-being, to population growth due mainly to migration which makes up for the general decrease of births. Every one of the European regions looked at has witnessed slow but steady demographic development since 1990. The increase has been particularly high in Catalonia whose population has grown by 14.5% in fifteen years, and by 10.3% since 2000, counting a population of almost 7 million residents at the end of 2005. In 2005 Veneto reached a total of 4,738,313 inhabitants, 5.1% more than in 2000 and 8.4% more than 1990. Growth in Toscana has been more moderate (+2.5% since 1990 and 3.6% since 2000) and in Piemonte (+0.8% since 1990 and +2.9% since 2000). Of the regions considered, these have the highest ageing indices and the lowest birth rate, hence growth can probably be attributed mainly to migration. (Figure 14.8) |
|
|
Birth rate
A region's economic development is closely linked to its demographic development. Italy is one of the oldest countries, in terms of the age of the population, and population growth is only partly attributable to new births. Migration has had a considerable impact both in terms of net migration and in terms of births.The birth rate represents the contribution births make to general population increase. Yet it is a generic index which only allows for approximate comparisons as it depends on many factors (demographic, socio-economic, political, cultural, etc.) In order to understand the differences observed between the European regions considered and analyse these properly it is necessary to evaluate at least the demographic structure by age and sex. In 2005 the European average was 10.4 live births per 1,000 residents, while in Italy it was 9.3. Regions which stand out for their high birth rate are Rhône-Alpes (13.1 per 1,000) and Catalonia (11.6). These regions also have a relatively young population with quite a moderate ageing index. In Italy, only Veneto and Lombardia are slightly above the national average, albeit with much lower levels and thanks to the foreign component of the population. The general decline in the number of births which has been underway for a few years in Europe and many industrialised countries is confirmed by the negative or lower birth rate in the last year and since 2001 in almost all of the regions considered. (Figure 14.9) |
|
|
Ageing index
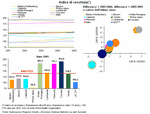
Italy is one of the oldest countries in Europe where the young component of the population is increasingly composed of new generations of migrants.The ageing index was 138.2% in Veneto and 142.6% in Lombardia in 2005, which is in line with the Italian average (139.9%). In Piemonte, Emilia Romagna and Toscana, the indicator scores even higher with 180 aged persons per 100 young people under 14, which is in clear contrast to the foreign regions studied. In the French territory of Rhone-Alpes, the ageing index has been under 100% for years, while in Catalonia it lost 2.3 percentage points in the last year and 9.6 since 2001, to reach 115.9% in 2005, as a result of a significant, steadily decreasing trend. In Italy, where levels are much higher, the ageing index is slowing only in Emilia Romagna and in Toscana, where it has decreased by 2.3 and 0.4 percentage points respectively since 2004 and 9.7 and 0.5 points since 2001. In Veneto, however, as in the remaining Italian regions, the population is continuing to age. Since 2001 the number of elderly per 100 youths increased by nearly 3 percentage points, increasing the social and economic imbalance between the elderly and the young, active components of the population. (Figure 14.10) |
|
|
Mortality rate
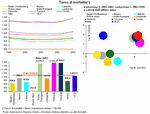
The mortality rate provides only very rough information about a population's deaths. For a deeper analysis of the phenomenon a study of causes of deaths of a population by age is preferable.In this way it would be possible to see that the highest share of deaths are due to cardio-vascular illness and tumours, which reflects the progressively ageing population in most of the more developed European regions. The recent, though moderate, increase in the mortality rate is in part due to the progressive ageing of the population not being completely compensated by new births. This is true above all for Italy, which in 2005 was the nation with the highest proportion of elderly to young people: According to Eurostat's regional data, Italian regions have the highest mortality rates. Piemonte, Toscana and Emilia Romagna in particular have figures above the national average, with almost 1,200 deaths per 100,000 inhabitants. The rate in Veneto is slightly lower (942 deaths per 100,000 inhabitants), thus in the same order of magnitude as Lombardia, Catalonia and the German regions. The lowest rate is that of Rhône-Alpes (812.5), which on the other hand also has the highest birth rate, indicating a population which is structurally younger than the other European regions analysed. (Figure 14.11) |
|
|
Infant mortality rate
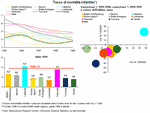
Indicators regarding children's health are key to assessing the condition of the entire population, so much so that in 2005 the World Health Organization dedicated World Health Day to healthy mothers and children. Infant mortality is an indicator that can also be linked to health and socio-economic conditions of a territory, and is thus often used to portray not only health but also well-being in developing countries. On a national level European data is available for 2004, but for comparison between regions it is less recent, dating to 1999. The European average in 2004 was over 5 child deaths per 1,000 born. Italy, Spain, France and Germany are below average, with infant mortality rates of about 4. When comparing regions with data from 1999, Veneto ranks very high, with an infant mortality rate of 3.8, higher only than Lombardia and more than a point less than the Italian average. Catalonia and Piemonte are the regions with the highest rates. It is worth noting that current rates are probably even lower, considering the reduction of the phenomenon in the medium-long term for most European regions. Compared to five years ago, all the territories studied, except for Catalonia, have recorded a reduction of infant mortality. (Figure 14.12) |
|
|
GDP per capita
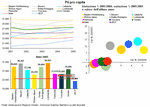
In the European context, Veneto has kept its good status as regards GDP per capita in Purchasing Power Standards. In 2005, last year for which comparison with other European regions is possible, GDP per capita in Veneto was 27,691 euros, 18% above the national average.In 2005 the regions with a GDP per capita above 30,000 euros were Bavaria and Lombardia. In terms of annual growth, Veneto's GDP per capita increased by 1.2% in 2005, 0.5 percentage points less than the national average. The other Italian regions did not do particularly well either: +1.5% in Toscana, -0.5% in Lombardia, 0.7% in Piemonte and -1.6% in Emilia Romagna, which confirms that 2005 was a year of zero growth for Italy. If we look at a longer timespan from 2001 to 2005, the highest increase in GDP per capita was in Cataluña, +15.6%, the only region of those studied that recorded a growth above average of the 27 European states (+13.6%). (Figure 14.14) |
|
|
Added value from services as percentage of total added value
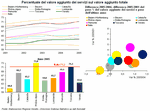
Analysis of the dynamics of added value confirms that the most industrialised countries are still in the process of tertiarising their economies: the manufacturing sector is becoming less important and the service sector is on the rise.Of all the regions selected, Rhône-Alpes has the highest share of added value from services. In 2005 the added value from the service sector in Rhône-Alpes was equivalent to 73% of the entire wealth generated by the French region, growing even more from 69.5% in 2000. In 2005 the Italian regions with the greatest contribution from the service sector to total added value were Toscana with 71.3%, and Piemonte with 68.7%. Veneto, which is still well known for its manufacturing vocation, ranks last of the Italian regions with services contributing 63.6% to total added value. As for changes in the weight of services in the last five years, measured in terms of difference between the share in 2005 and that in 2001, the following regions have performed well: Piemonte (+4.4), Toscana (+3.1), Rhône-Alpes (+2.9), Veneto and Cataluña (+1.9). (Figure 14.15) |
|
|
Employment rate for 15-64 year-olds
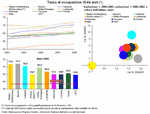
The Lisbon strategy, in the hope of creating new and better jobs for qualitative and quantitative growth of the economy and standard of living defines some objectives for the European Union, including employment levels of 70% by 2010. The Italian regions compared are all well above the Italian employment average, and also above the EU average. In 2006, the employment rate in Veneto was 65.5%, thus the region ranks third of all Italian regions considered, after Lombardia (66.6%) and Emilia Romagna (69.4%). Emilia Romagna reached the EU objective in 2007, with 70.3%. The employment situation of most foreign regions compared is generally very positive. In German regions and Catalonia, the European target has been surpassed, in some cases for a few years now. Employment levels in Rhône-Alpes however are similar to those of the Italian regions it is compared with, that is with an employment rate which has not changed since last year, or indeed four years previously. All the remaining Italian and European regions report an increase in employed persons as a percentage of the population of working-age both in the last year and compared to 2002. Bavaria has increased its employment rate in the last year slightly more than the other European regions, while Catalonia has performed well for the middle period, with the relative employment rate having increased by over 9% between 2002 and 2006. (Figure 14.17) |
|
|
Employment rate for 15-64 year-old women
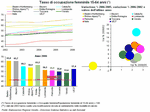
The continuous decrease in the active population and the increasingly critical imbalance between young and old highlights the need to attract and keep a higher number of persons in the labour market through appropriate policies. Greater efforts will thus have to be made to reconcile professional life with private and family life, and the gender gap in terms of pay will have to be addressed if women's potential is to be drawn on.Despite the higher participation of Italian women in the labour market in recent years, Italy is still some way from the Lisbon objective set in 2000, which envisages an average female employment rate of at least 60% by 2010. The European average is closer to the target than Italy. In 2006 the European Union there were 57 women employed per 100, compared to the Italian figure of 46. The German regions met the European target a few years ago, recording an index of 66% in 2006. In the same year Catalonia also reached the target and Rhône-Alpes came close. Of the Italian regions compared, only Emilia Romagna has reached a female employment rate which is in line with the objective, 61.5%. Veneto ranks last among the regions compared here: There are less than 54 women aged 15-64 who worked in 2006. (Figure 14.18) |
|
|
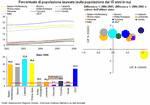
Population with degree (as percentage of population over 15)
The European Union recognises the fundamental role played by education and training in assuring greater benefits for people in the new knowledge society and offering opportunities to improve the quality of work and of life. Educational attainment has generally increased in recent years: In 2006, 17.5% of Europe's population aged at least 15 had a university degree.The percentage of the population with a university degree is particularly high in all the foreign regions considered, with about a fifth of the population. Though it is stable or has slightly decreased since 2005, the share of graduates in Baden-Württemberg, Bavaria and Catalonia has increate by over 2 percentage points since 2002. Though in Spain and other European countries policies which allow young people to leave school earlier than Italians, Italy is still far from European standards: Only 9.7% of the Italian population over 15 had a university degree in 2006 and the other Italian regions are not far from the national average. The fruits of the Italian University reform are only just beginning to show. The share of graduates is indeed increasing in all the Italian regions considered and since 2002 has increased by over 2 percentage points, as in Veneto (+2.2) and in Emilia Romagna (+2.1). Toscana reports the highest growth (+3.2%) of all the regions considered, Italian and non-Italian. (Figure 14.19) |
|
|
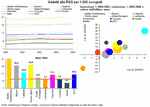
R&D employees per 1,000 employed
An increase of personnel in the R&D sector together with an increase in expenditure are believed to be essential for development based on knowledge. This is the only way forward for European countries in a globalised world, where they can no longer compete counting on the cost of labour, raw materials or advantageous exchange rates. Of the European regions considered, it is the French and German ones that rank highest in terms of the number of people employed in R&D: 21.3 for every 1,000 employed people in Baden-Württemberg, 16.9 in Rhône-Alpes and 16.5 in Bavaria. Italy ranks lowest of countries that are advanced in terms of investment and employment in the field of research: In 2004 there were 7.3 for every 1,000 employed people in the R&D sector, against the 10.5 average for the EU27. On a regional level, only Piemonte is over the threshold of 10 for every 1,000. The most significant growth, of nearly 30 percentage points, was in Cataluña, which counted 11.8 employees in R&D per 1,000 employed persons in 2004. Despite the consistent growth of employees in this sector, +15.2% in the last 5 years, the value in Veneto is still low: Only 4.7 employees per 1,000 employed persons. (Figure 14.20) |
|
|
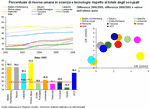
Human resources in science and technology as percentage of total employed
The fast economic change and increasing attention to a knowledge-based economy have led to greater interest in the role and assessment of skills. High skills can favour innovation, optimize the production process, qualify products/services and thus improve the social, environmental and economic well-being of the population. Data on human resources in science and technology (HRST) can increase understanding of demand and supply of specialised personnel in science and technology. Human resources in science and technology are defined as people who have successfully completed higher education, or are not so highly qualified but hold a job in the science and technology sector where a university degree is usually a requirement. If we compare competitor regions on the basis of personnel in science and technology as a percentage of the total number of employed persons, Rhône Alpes ranks top, 53.5%, followed by the German regions and Catalonia. Despite the strong growth in the last five years, the average for Italian regions is under 40%. Only Lombardia exceeds this, with 41%. Economic progress has been good above all for Rhône Alpes, Piemonte and Emilia Romagna. (Figure 14.21) |
|
|
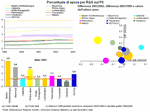
Percentage of GDP expenditure on R&D
Territories that intend to play an important role in the international chessboard of the future have to develop innovation in order to be key players in the advanced sectors. Increase in innovation is certainly supported by greater investment in Research and Development activities. Although the European Community favours development of innovative capacity through the institutions of ad hoc funds, Europe is still far from the Lisbon objective set in 2000 of 3% of expenditure of GDP by 2010. The 2.5% parameter set for Italy is equally distant. The last year for which there is comparable data is 2003, when the percentage of GDP spent on R&D was 1.88 for the EU27, and 1.14 for Italy. Though Veneto has increased the share of expenditure, is still critically low in spending on research: In 2003 expenditure on R&D amounted to 0.72% of regional GDP. Baden-Württemberg and Bavaria have already met the Lisbon objective with 3.9% and 3% of GDP spent on R&D. Rhône-Alpes (2.6%) is very close to the 3% objective, while all the other regions selected are lower than the European average. If we look at the dynamics from 1999 to 2003, the regions with the greatest growth compared to the other competitors are Rhône-Alpes and Emilia Romagna. (Figure 14.22) |
|
|
Tourist density rate
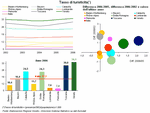
Monitoring the territory's tourist appeal is fundamental for a correct evaluation of policies adopted and future planning, particularly if we are to compare our region with its competitors.The tourist density rate is an indicator of the effective weight of tourism with regard to the size of the area. In other words it provides information which is useful to reply to the demands of the tourist load. The ratio of nights spent - divided by the days for the reference period, which in our case is one year - to the resident population in the tourist area, multiplied by 1,000. This simply indicates the average nights spent every day in the territory per 1,000 inhabitants. Veneto's tourist density rate is 34.1 nights spent a day per 1,000 inhabitants in 2006, which is well above that of the other regions considered and twice that of Italy. This indicates a high concentration of tourists in relation to the population of the host territory. It highlights the importance of the tourism sector in Veneto from an economic point of view. In the last five years the indicator has shown slight variations for all the regions considered. (Figure 14.23) |
|
|
Transport and infrastructure
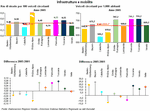
Despite the European efforts for a re-balancing of means of transport, roads still carry 44% of freight traffic and almost 80% of passengers. These percentages are even higher in regions like Veneto and Lombardia which are subject both to local traffic and also to through-traffic due to their geographic location at the centre of the corridor V Barcellona-Kiev and corridor 1, Brennero. If we look at the km of roads per 100 vehicles in circulation, we can see how these two are the most congested of the nine regions considered, with 0.24 and 0.35 km per 100 vehicles respectively. These values are actually lower than the Italian average which in 2005 was 0.45, but also lower than the German regions. Another issue related to the potential congestion of the roads is that of vehicles in circulation compared to the population, and here of all the foreign regions, only Bayern compares to Italy. Veneto has gone from 658 circulating vehicles per 1,000 inhabitants in 2001 to 669 in 2005 (+11.5 vehicles per 1,000 inhabitants). Rhône Alpes is the only foreign region which has seen a reduction for the indicator in the five years considered: From 623 in 2001, it has gone down by nearly 13 points. Of Italian regions, Piemonte has seen a reduction from 718 in 2001 to 709 in 2005. (Figure 14.24) |
Data elaborated by the Statistics office of the Veneto region are collective property; reproduction of this material is authorised for non-commercial purposes only, provided the source "Regione Veneto - Regional Statistics System Management" is acknowledged.


 Index
Index  Home
Home 