|
Feeling, being and doing well 11.1 - Our health
(Note 1) Many factors contribute to our state of health: from genetics, to lifestyle, to the physical and social environment in which we live. The quality of health services available in the area in which we live also plays a role, although to a slightly lesser extent.
The complex and multi-faceted nature of health is the motivation behind the plan of promotion entitled "Health in All Policies" which is being carried out at a European level. This plan involves a strategic approach based on shared ideas such as forming a universal concept of health, ensuring access to medicine and care, solidarity and equality. These are all strategies intended to reduce inequality in terms of health. Some essential factors include creating full awareness on the citizens' part of the need to take care of their mental and physical health, and also scientific research which serves as a basis for the implementation of certain policies. Health, stated the plan set up last year by the Ministry of Health, is the greatest wealth an individual and a society can possess, furthermore, a healthy population provides the basis for economic productivity and prosperity. The index showing the number of years a person has lived in good health becomes more and more relevant when comparing European countries, as a population's healthy life expectancy, as opposed to simply the length of a person's life, also provides a good indication of factors linked to a country's economic growth. In this respect, Italy is a country to look up to, as its results for many health-related factors are particularly favourable. It is sufficient to mention two factors for which our country is famous for all over the world; our tradition as regards food and nutrition, and urban distribution, because even today a large share of the population live in smaller urban centres. Beside traditional indicators used to analyse the population's state of health, e.g. life expectancy, we will also look at people's own perception. The growing importance given to a person's subjective idea of their own state of health is linked to the idea that each individual can constitute an important source of information which is not available elsewhere and which can be used to complete a nosological picture of the patient normally only created in the clinic. Life expectancy at birth
(Note 2) The increase in life expectancy that has been seen in recent years can be put down to improvements in the population's life, hygiene and health conditions, as well as to constant progress in the field of medicine. Women in Veneto have an average life expectancy of 84.6 years, this is longer than for men who live for 78.9 years on average. The increase in average length of life also reflects a decrease in mortality even in older people, as can be seen from the data on how many more years over-65 year olds are likely to live for: for men in Veneto this figure increased from around 15 years in 1994 to more than 17 years in 2004, for women this number increased from 20 to 22 years. The evolving trend in health from 1991 to 2007 both in Veneto and in Italy has been consistently positive, both for males and females: average life expectancy has grown by around five years in fifteen years, that equals around four months a year. At the beginning of this period the difference in life expectancy between men and women was around 7 years, this was reduced to 6 years by 2007. (Figure 11.1.1) Veneto came out slightly better both for males and females in the comparison with Italy for the whole period, which proves that the Veneto population is in better health than the average Italian population. Healthy life expectancy
(Note 3) Besides looking at the length of life, it is also important to see how long one lives in good health and with a good quality of life. Good health policies aim to lengthen the population's life expectancy, but it is also important to be able to guarantee that the extra years are spent in good health. This message comes through in the WHO slogan "Add years to life, add life to years". The situation in Veneto is very similar to that in Italy overall, both for males and for females. From 2000 to 2005 healthy life expectancy increased by around 4 years, this is much more of an improvement than for overall life expectancy (1.3 years for males, 0.9 for females). (Figure 11.1.2) Two consistent differences emerge from the comparison between overall life expectancy and healthy life expectancy: men spend an average of almost 25 years of their lives in bad health, women 8 more than that as they spend almost 33 years of their lives with health problems. (Table 11.1.1) Disability-free life expectancy
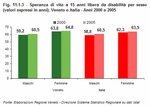
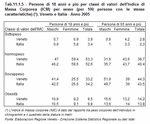
(Note 4) Not all of our expected years of life are spent without disabilities. There is little difference between figures for Veneto and for Italy in 2005 for the disability-free life expectancy at the age of 15 indicator: 60.5 years and 60.8 for males, 64.8 and 63.5 for females for Veneto and Italy respectively.The trend is positive: from 2000 to 2005, for men in Veneto the figure increased by approximately 3 months per year, for Italian men it increased by almost 4 months; for Veneto women 2.4 months and for Italian women almost 3 months a year. (Figure 11.1.3) It is also interesting in this case to be able to compare overall life expectancy at the age of 15 with the corresponding disability-free life expectancy, as this enables us to make an estimate of the average length of life a person aged 15 in the community in question will spend with a disability. From this comparison it emerges that females spend a longer average number of years with a disability than males. Veneto males have a longer period with a disability than Italian males in general. (Table 11.1.2) Avoidable mortality
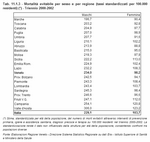
This is defined as the part of overall mortality which could be effectively avoided through primary preventive measures, hygiene and health care, early diagnosis and therapy. Without any kind of intervention from the health services, mortality would be determined exclusively by genetic, environmental and social factors: the health services can intervene in order to reduce the influence of certain risk factors with the aim of lowering mortality. It is an interesting indicator as it allows us to measure and compare the periods of life lost for preventable causes, and it can provide useful data for use in planning public health measures. It is clear that in order to limit this phenomenon, prevention and specific research must be carried out, errors need to be identified and reduced, health education needs to be provided, treatment times and methods in health organisations and provision of care must be optimised. In some cases, the numbers of deaths which could have been avoided can indicate problems with the functioning of one or more areas of the health system. The figures are presented as standardised rates so that data is not influenced by the age structure of the population (Note 5). The most recent research in this field, carried out by a research institute (Note 6) on behalf of the Istituto Superiore di Sanità (the Higher Institute of Health) and the Ministry of Health, considers deaths up to the age of 74 for the 2000-2002 period. In 2002 there were 107,000 avoidable deaths in Italy, 1 out of 4 male deaths and 1 out of 8 in females. This corresponds to a loss of life expectancy of 4.5 years for males and 2.5 years for females. The trend in avoidable mortality is positive, as it is for life expectancy. The 2000-02 annual indicators are very similar for Veneto and for Italy as a whole: the situation is slightly more positive for females in Veneto and for males in Italy. Valle d'Aosta has the highest avoidable mortality rate, Veneto is ranked somewhere in the middle of all the Italian regions. The lowest figures, both in males and females, can be found in the Marche region. (Table 11.1.3)
In the World Health Organisation's constitution act (1946), health is defined as a state of complete physical, mental and social well-being and not merely the absence of disease or infirmity.
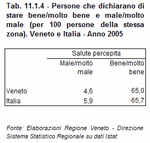
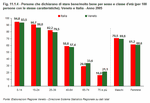
With this in mind, questions regarding people's subjective self-assessment of their own psychological and physical condition in their day-to-day and working lives become more relevant, alongside the more traditional means of measuring health. Indeed, in order to gain a global idea of a person's health it is not enough to look at their physical condition or the presence of illnesses, importance should also be given to the person's subjective perception of their own health. This is a means of gathering information which cannot easily be measured through indicators such as morbidity and mortality. This multi-dimensional side to the subjective evaluation of a person's state of health has become more and more important in recent years, which is proven by the growing number of surveys designed to identify and study the different features that make up one's perception of one's health and quality of life in general. If at first it may seem that someone "feeling unwell" is less relevant than that person "objectively being unwell" as far as analysing their health is concerned, it must not be forgotten that it was this person's assessment of their own state of health that brought them into contact with the health system in the first place. In 2005, 65% (about 3,024,000 people) in Veneto declared that they were in good or very good health (Note 7). Italy's percentage was very similar at 65.7% (about 38 million people). This self-assessment is testimony to the effective state of an individual's mental and physical health, however it is filtered by certain subjective factors which may be affected by different methods and tolerance levels when coping with an illness or malaise. In comparison with the previous survey in 2000, this percentage had increased by about five percentage points in Italy and in Veneto. In Veneto, 4.6% (215,000) of the people declared their health to be bad, in Italy this figure was 5.9% (3.4 million). There were no real differences within the different areas of the Veneto region itself. The number of people who felt that their health was bad was slightly higher in the capitals (5.1%) than in the remainder of the municipalities (4.5%). (Table 11.1.4) In Veneto, men are in better health than women, with an advantage of 9 percentage points, however it must be remembered that Veneto women are also older on average. There is, therefore, a higher percentage of women in bad health than men: 5.8% and 3.4% respectively in Veneto; 7.3% and 4.4% respectively in Italy. As can be expected, the percentage of people in good health decreases as age increases, in Veneto as well as in Italy: the youngest age groups have a minimal share of people in bad health as good health prevails (93.5% in the 0-14 age group in Veneto); in the 75 years and over age group on the other hand, bad health dominates and the percentage of those in good health drops to 21.1%. (Figure 11.1.4) The relationship between health and educational qualification makes for interesting research. As before, the influence on the results of the differences in age of the people possessing the educational qualifications in question should be borne in mind. Of the people who possess a degree, the percentage who declare themselves to be in good health is high (76.1% in Veneto and 76.4% in Italy). This percentage is much lower for people with no educational qualification or a primary school diploma (49.1% and 48.4% respectively for Veneto and for Italy). In keeping with the figures on good health, there are very few graduates who seem to be in bad health, this is followed by those with a lower or upper secondary school diploma (2.6%) and then those with no qualification or with a primary school diploma (10.2%). This last group is mostly made up of elderly people. Qualifications also appear to be linked to an individual's social and economic status: higher qualifications generally correspond to a higher quality of life, also in terms of health. Attention to hygiene, access to healthcare and the economic means with which to spend money on treatment are often higher in these individuals than in people with lower qualifications. Physical condition
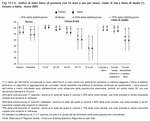
In order to look at different aspects of the population's perception of their health, Istat provides concise individual indicators (Note 8) which focus on physical condition, psychological condition and vitality (Note 9). Physical condition can be measured through an international standardised indicator (Note 10). Very low figures for the indicator on perceived physical condition correspond to situations in which the person is limited in the care they take of themselves and in their ability to take part in physical and social activities. Such persons experience strong physical pain and frequent tiredness, leading to their health being labelled as poor. Very high figures on the other hand are reached by people who are in excellent health, meaning that they have no physical limitations or disabilities. Veneto people on average are in fairly good physical condition, the indicator for this equals 50.2 on average, lower than the Italian figure of 50.4, but there is a slightly wider range here than in Italy. Age and gender make a significant difference. The physical condition index is lower for women and worsens with age. It must be remembered, however, that women do tend to live longer than men, therefore the average age is older, and they tend to be in worse health. Indeed, the index in Veneto is 51.2 for males and 49.3 for females. The figures for Italy differ only by a few decimal points showing Veneto is in line with the national average. As can be expected, with increasing age the physical condition index decreases: in Veneto, the figure goes down from 54.7 points for the 14-24 age group to 38.1 points for the 75 and over age group. These figures are in line with the national ones. Analysis by educational qualification can demonstrate how the population's perception of their health can be related to their social and economic condition (which is often linked to level of education). This variable is strictly correlated to age as it is usually the older age group who have lower levels of educational qualifications (Note 11): the averages of the concise individual indexes for the first two types of educational qualification, i.e. university degree and lower or upper secondary school diploma, differ by only one percentage point at 53.2 and 52.2 in Veneto respectively, while this figure is significantly lower at 44.6 points for people with no educational qualification or with a primary school qualification. (Figure 11.1.5) Psychological condition
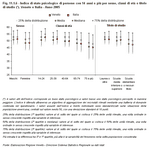
"Mens sana in corpore sano", said the Ancient Romans (Note 12). In addition to physical wellbeing, people believe they are healthy when they achieve a psychological balance that enables them to live in harmony both with themselves and with others. The population's perceived mental health is studied through the psychological condition indicator (Note 13). Very low values indicate frequent psychological malaise and/or serious social and personal disability caused by emotional problems, leading to health being labelled as poor; very high values on the other hand are linked to excellent health, good mental and physical condition, no psychological malaise or limitations in the social and personal domains. People in Veneto do not seem to have major psychological malaise. This indicator is equal to 49.5, a figure which is very similar to the national one. There are no real differences between index values within the territory, however between genders the differences are marked. Psychological condition varies between genders in the same manner as physical condition. Women declare to suffer more psychological malaise, with an index value in Veneto of 48.3, compared to 50.8 for men. This is in line with national figures. The situation amongst women is also less homogeneous than amongst men. The distribution of psychological condition indicator values by age group also shows a similar pattern to that seen for physical condition: average values decrease steadily with a corresponding increase in variability with age. Young people aged 14 to 24 seem to be in average psychological condition whereas this figure goes down for older age groups. For Italy the figures are slightly higher in the earlier age groups and a little lower in the more elderly ones. Psychological condition is not greatly influenced by level of education, as physical condition on the other hand was. (Figure 11.1.6) Vitality
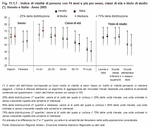
Feeling fit and full of vitality also contributes to a person's perceived overall state of health. The vitality index (Note 14) used to measure this shows lower values when the person often feels tired and drained, and higher values when the person always feels energetic and full of life.The Veneto and Italian population are in good condition in terms of vitality, in Veneto this figure is 62.9 points and the national figure slightly higher. Variability for this index is much more evident than for the physical and psychological condition indices and the situation in our region is much more heterogeneous than in Italy as a whole. Compared to young people and adults who are at their peak as far as energy levels are concerned, elderly people prove to be less sprightly and lively, although elderly people in Veneto seem to be in better condition than in Italy as a whole. (Figure 11.1.7)
Of the factors which determine health, besides genetics and the environment, people's lifestyles play a vital role. This includes personal habits and risk factors such as diet, physical activity, obesity, smoking, alcohol, drugs, medicines and prevention.
Diet
Dietary habits are fundamentally important if we are to become and stay healthy. Our diet must be rational so that it enables our body to stay healthy and efficient, most importantly it must ensure we have enough energy to fulfil our daily needs. Energy needs are determined by clearly defined factors, such as age, gender, size, weight, and how much exercise we do; these factors condition how much energy our body expends.Quantity aside, the quality of our daily diet also plays a significant role. It is neither healthy nor correct to satisfy our energy requirements with just any type of food or by limiting or being repetitive in our nutrition choices. Quite the opposite in fact: it is important to take into consideration the nutritional values of the food which makes up our diet, and make sure it is as varied and balanced as possible and that it includes all the different food categories in order to ensure our bodies receive all the nutritional elements they require. For a correct and healthy diet, the main piece of advice that can be given is to keep weight within a reasonable level by watching the calories and doing a good amount of physical activity. This can contribute to a longer and better life. Excessive weight is often linked to a higher risk of certain serious illnesses: coronary heart disease, diabetes, hypertension, arteriosclerosis, etc. Following these considerations, of the various aspects of diet which have an influence on health, we will now look in particular at those regarding the consumption of vegetables, a decent breakfast and the consumption of fish. Regarding the consumption of vegetables, the percentage of people aged three years and over who eat them at least once a day in Veneto is almost seven percentage points higher than the national average and consistently higher in each age group. (Figure 11.1.8) The share of the population who say they have an adequate breakfast is higher in Veneto than in Italy beginning from 35 years. (Figure 11.1.9) Nutritionists advise us to eat fish at least twice a week due to the low quantities of calories and saturated fats it contains compared to meat products, and because it contains polyunsaturated fats. However, the statistics show that average national consumption of this food product is almost 10 percentage points higher than in Veneto (54.5% in Italy compared to 49.4% in Veneto) throughout the age groups. Physical activity
Physical inactivity is one of the main risk factors for numerous chronic illnesses, and a sedentary lifestyle may be one of the joint causes of cardiovascular illness, diabetes, cancer, and muscular and bone problems.Looking at data on sports, it turns out that the Veneto population has a fairly good lifestyle compared to Italians in general: 39% do no physical activity or sports at all, this is about 10 percentage points lower than the Italian average. (Figure 11.1.10) However the number of physically inactive people is fairly substantial, touching around 1,740,000 people in Veneto and 27,808,000 Italians: gender, age and educational qualification play an important role here. In Veneto, the share of males who do no physical activity at all is 35.4% (Italian figure: 44.4%), and the female share is 41.6% (Italian figure: 53.9%). Inactivity clearly increases as people grow older: in Veneto this share goes from 20.6% of 3-14 year olds to 59.6% of 74 year olds and over, the highest age group. The number of graduates who do not do any physical activity is proportionally half the number of those with no educational qualification or with an primary school diploma who do none: 22.8% and 44.5% respectively (in Italy 33.7% compared to 56.6%), showing that people with a higher educational qualification tend to pay more attention to their health and to be more aware of the necessity to keep in good health also through physical activity. In the large municipalities - the capitals and those with more than 50,000 inhabitants - where there is probably better access to sports facilities and there is more of a culture of physical exercise, the share of physically inactive persons is lower than in other municipalities: 32% and 40% respectively. As regards sports on the other hand, which require a certain amount of physical effort, the average number of days a week dedicated to this activity is practically the same for Veneto and Italy. In our region however, more time is dedicated to this on a daily basis. Obesity and excess weight
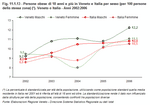
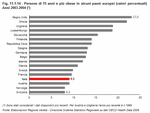
Excess weight and, on a larger scale, obesity can be counted among the risk factors for the development of chronic degenerative diseases and can be held responsible for large shares of mortality and disability.In order to evaluate and classify people using criteria to identify weight class, Istat uses the WHO classification, based on body mass index (BMI), calculated from the ratio: body weight in kilograms to height squared in metres (established by Quetelet in 1868). The index defines BMI values under 18.5 as "underweight", 18.5-24.9 as "normal", 25-29.9 as "overweight" and 30 and above as "obese". The application of this index to the Veneto population shows that more than half are within normal weight limits, 53% to be precise. Quite a large share of Veneto people, more than a third in fact, are overweight. The remaining share is divided fairly evenly between the obese and the underweight, the latter being slightly more common. (Table 11.1.5) With regards age, 10.5% of young people (18-24 year olds) in Veneto are overweight (Italian figure: 13.1%), this figure reaches 46.2% for the 65-74 age group (Italian figure: 46.1%) and then falls slightly to 42.1% in the oldest age group, 75 years old and over (Italian figure: 40.3%). When divided by educational qualification, the shares of overweight people in Veneto are as follows; 25.4% of graduates; 29.9% of people possessing a lower or upper secondary school diploma; 43.7% of people with no educational qualification or possessing a primary school qualification. This probably confirms what has already been said before; that people with a higher educational qualification tend to be more aware of risk factors to their health and also tend to take better care of themselves. (Figure 11.1.11) and (Figure 11.1.12) The number of obese people in Veneto stands at around 370,000, 15.7% of whom can be found in the 65-74 age group. In this case too, educational qualifications make a significant difference: 3.4% of people possessing a university degree are obese (Italian figure: 4.7%), 7.8% (Italian figure: 7.9%) of people with a lower or upper secondary school diploma, this share then rises to 15.7% of people with the lowest level of education (Italian figure:15.8), most of these are probably elderly people. Looking at the evolution of this phenomenon through time, it can be seen that obesity has risen constantly in the last 5 years both in Veneto and in Italy, and both in men and in women. We need not say the same for the number of overweight people as these figures have remained fairly stable since 2002. Figures are given as standardised percentages so that the data are not influenced by the age structure of the population (Note 15). (Figure 11.1.13) Compared to the trend in obesity in the rest of the world, even if it is growing, obesity in Italy stands up to comparison with the other European countries as it is placed amongst the countries with the lowest rate. It compares especially well to the United States where over 30% of over-15 year olds are obese. (Figure 11.1.14) Smoking
WHO defines smoking tobacco as the most serious threat to health in Europe. Deaths caused by smoking tobacco (estimated at around 80,000 per year in Italy alone) exceed those caused by alcohol, AIDS, drugs, road accidents, homicides and suicides put together.Smokers who start young and continue regularly throughout their lives have a 50% chance of dying because of tobacco. Passive smoking also causes diseases and deaths in non smokers: around 500 deaths a year from lung cancer and over 2,000 from ischemic heart disease, according to estimates by the Ministry of Health. As far as smoking habits are concerned, in Veneto the situation is more restrained than the national one in each indicator considered: the percentage of regular smokers, both males and females, out of the population aged 14 and over in our region stands at around 19.7%, 2 percentage points lower than the Italian figure. (Table 11.1.6) Furthermore, the number of "heavy smokers" (Note 16) is lower in Veneto (27.8% of smokers) than on a national scale (38%). The average number of cigarettes per day for smokers aged 14 and over in Veneto equals 13 (Italian figure: 15); the average age for starting smoking is 18.5 years old (Italian figure: 18.3); the average length of time people smoke for is 23 years; the percentage of smokers who started before their 14th birthdays is 5.2% (Italian figure: 5.9%). (Figure 11.1.15) In Veneto it is the 25-39 year olds who constitute the biggest group of smokers at 25.3% (Italian figure: 27.8%). This percentage lowers gradually throughout the other age groups, until the over-75 age group where it drops drastically to 5%. The 40-64 year olds are the biggest smokers: in Veneto 7.1% of them say they smoke over 20 cigarettes a day, in Italy this figure is 10.4%. Smoking is also linked to educational qualification: the biggest group of smokers, 23.4%, are the 15 year olds and over in possession of a lower secondary school diploma (Italian figure: 25.3%). Next in line are people with a degree, 19.7% of whom smoke in our region, this figure reaches 20.2% on a national level. The highest percentage of heavy smokers can also be found within the group of people with a lower or upper secondary school diploma. (Figure 11.1.16) Between 2000 and 2006, smoking habits improved slightly in Veneto, above all as far as heavy smokers are concerned. The percentage of smokers who attempt to quit during the year is higher in Veneto than in the rest of the country: 27.2% in Veneto, 21.9% in Italy. (Figure 11.1.17) Out of those who try to give up, 91.2% do so without any kind of help and only 4.5% turn to pharmaceutical aids. Very few people indeed make use of self-help groups when trying to quit (1.3%). In 2005, 20.2% of the population over 14 years of age in Veneto quit smoking, with some difference between the genders: 32.5% of men and 17.5% of women. A typical profile of an ex-smoker in Veneto would be a person who smoked around 16 cigarettes a day, started smoking at the age of 18 and continued smoking for 20 years, giving up therefore around the age of 38, and who claims not to have smoked for more than 14 years now. Of these ex-smokers, 39% were heavy smokers before they gave up. The Italian ex-smokers were in a slightly worse situation as they smoked on average 18 cigarettes a day, they stopped smoking two years later than their Veneto counterparts, and almost half of them smoked more than 20 cigarettes a day. Although smoking in Veneto is less serious than in the rest of Italy, it is still a large-scale phenomenon. In 2005 there were around 800,000 smokers, of whom 100,000 were aged between 15 and 24 years old, and a good 40,000 of them had started smoking before their 14th birthdays. They smoke around 13 cigarettes a day for 23 years on average and 200,000 of them are heavy smokers. In addition, there are more than 900,000 ex-smokers who started at the age of 18 and were exposed to the accompanying health risks for around 20 years. 360,000 of the ex-smokers were heavy smokers and 64,000 started smoking before they reached adulthood. Alcohol
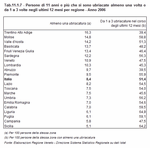
Alcohol consumption during meals is a strong Italian tradition but an excessive use can become an health hazard. Alcohol is third on the list of 26 risk factors for health drawn up by the European Union. It is responsible for a wide range of causes of death from road accidents to other types of accidents, homicides, suicides, cirrhosis of the liver, neuropsychiatric illnesses, depression and cancer. In Europe, alcohol takes the blame for 12% of premature deaths and disability in males, which increases to 25% in young males, 2% in females (10% in young females). Excessive use of alcohol also leads to a wide range of social problems which can affect each single individual, their families, young people and the social environment in general, problems such as abuse, violence and homicides (Note 17).Veneto ranks quite highly for alcohol consumption with 32.1% of over-11 year olds consuming alcoholic drinks on a daily basis. In 2007 around 1,350,000 people aged over-11 declared they have at least one alcoholic drink a day, 430,000 of these were female. The share of women who drink, at 20%, is less than half that of men, at 45%. The corresponding Italian figures are 16% and 43% respectively. (Figure 11.1.18) The percentage of drinkers increases as age does: the 65-74 year olds drink the most, 48% in Veneto and 42% in Italy. Young drinkers (11-24 years old) make up 5.5% in Veneto and 7% in Italy. The number of drinkers also increases as level of schooling lowers: from 29% of Veneto graduates up to 38% of people with an elementary school qualification. This difference is less marked in Italy as a whole with graduates at 28% and people in possession of an elementary school diploma at 32%. The over-11 year olds who admitted to having got drunk at least once in the last 12 months equals 10.9% in Veneto, this is 2.5 percentage points higher than the Italian average but lower than our neighbours Trentino-Alto Adige and Friuli Venezia-Giulia. The closest values to Veneto can be found in Lombardia. (Table 11.1.7) The average number of getting drunks declared from people who admitted to having got drunk at least once during the year in question is equal to 4.3 times in Veneto, this is slightly higher than the Italian average of 4.1 times. This figure is the same in Lombardia and reaches 5.6 times in Trentino and 5.3 in Friuli and Bolzano. Alcohol risk in Veneto needs to be taken seriously: 1,350,000 daily consumers of alcoholic drinks, of whom 450,000 get drunk at least once a year, getting drunk an average of 4.3 times a year, constitutes a potentially serious problem and would necessitate some kind of preventative measures. Drugs
Drug taking, especially amongst young people, is one of the risk factors creating considerable concern throughout Europe.Using data from the ESPAD (Note 18) survey, estimates were made of the percentage of people aged 15 to 19 years old who take illegal substances of some type in our region and in Italy. The highest percentage of drug taking amongst young people refers to the use of cannabis and its derivatives with 32% of males in Veneto and 23% in Italy, 25% of females in Veneto and 23% in Italy. The next largest group are cocaine users with 7% of Veneto males (Italian figure: 6.3%), which falls to 3.8% for Veneto females (Italian figure: 3.5%). Data provided by the Ministry of Health show that the number of people using public drug rehabilitation centres is increasing from 1991 to 2005, and the number of drug-related deaths has recently started to decrease. (Figure 11.1.19) A glance at the situation overall
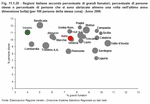
If we take an overall look at the three main health risks mentioned so far - smoking, alcohol and obesity - some key points come through.Firstly, none of the Italian regions have a level of obesity lower than 7%, Basilicata has the highest figure with 12%. There is more variety amongst the regions as far as smoking habits are concerned; smoking more than 20 cigarettes a day is a habit of people in the two islands, Campania, Calabria, Liguria and Valle d'Aosta in particular. In the latter of these regions, the number of people who got drunk at least once during the year in question is also one of the highest out of all the regions. Veneto is best off in terms of the number of big smokers, but the same cannot be said about obesity as the level here is higher than the national average. As far as alcohol is concerned, it can be seen that the Northern regions tend to have higher values than the Southern ones, apart from Sardegna and Molise. (Figure 11.1.20) Acute illnesses
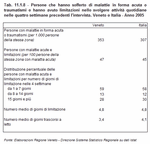
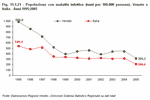
Together with mortality, morbidity - i.e. the frequency of illness within the population - is one of the most common and useful ways of measuring not only a population's level of health, but also the illnesses it is afflicted by. In Veneto in 2005, 35% of people claimed to have suffered from illness, ailments or traumatisms in the four weeks leading up to the interview, 47% of these people were physically limited by this for an average of almost 5 days, 3 of which they spent in bed. The situation in Italy was slightly better, 30% of people had suffered some kind of illness, 45% of whom complained of limitations in their ability to carry out their usual daily tasks (Note 19). (Table 11.1.8) Improvements in hygiene, prevention, public health measures and progress in finding cures have all contributed to drastically reducing the impact infectious diseases have on the population. This trend is constantly on the decrease: in 10 years the number of people in Veneto afflicted by infectious diseases went from 987 notified diseases for every 100,000 inhabitants to 309 per 100,000 inhabitants. The value in Veneto is still higher than the Italian figure, despite the much more drastic reduction seen over time in our region. (Figure 11.1.21) The discovery of new antibiotics, the production of ever more effective vaccinations and the spread of hygiene standards in public and private areas in industrialised countries from the second half of the twentieth century on means that infectious diseases have less of an impact on the population, where in the past they were considered a serious health threat. However, at this the beginning of the twenty-first century, infectious illnesses have once again become the object of attention as new epidemics have provided cause for concern in many developed countries, sparking national and international debates on the spread of new infectious diseases and on new regulations and monitoring systems. Nowadays, the most common infectious diseases are those related to childhood, starting with chicken pox with 211 cases per 100,000 people, followed by scarlet fever (45) and by non-typhoidal salmonellosis (17). The reduction in the spread of infectious diseases has contributed to lowering mortality in the population. Medical research is trying to control or in some cases to eradicate the types of diseases which still weigh upon mortality rates, such as chronic-degenerative diseases and neoplasia. Chronic illnesses
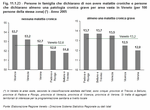
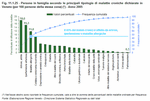
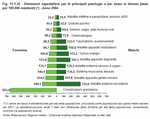
Medical achievements in the field of chronic illnesses have contributed to the increase in the number of people, especially elderly people, surviving them, this amounts to enormous progress even compared to only ten years ago. Chronic illnesses are one of the main challenges in the fields of medicine and public health today since their consequences in terms of expenditure on health and of disability and assistance requirements affect both the health and social spheres. Health planning cannot fail to take into account these matters: on the medical side the aim is to increase the population's length of life and make sure their years are spent in good health; the health service on the other hand requires personnel, structures and resources with which to provide assistance, and also concrete support for the families of the ill.In 2005 more than half the Veneto population claimed not to have any type of chronic illness, this equates to almost two and a half million people. The average Italian figure is slightly higher. These figures refer only to people who live at home and exclude those patients living in residential care structures. Of the people suffering from chronic illnesses and living at home, 13 out of 100 have at least one serious chronic illness (Note 20) and almost 14% have three or more (Note 21). In the last ten years the numbers of people suffering from chronic illnesses has decreased. (Figure 11.1.22) Analysis of this phenomenon must take into account those variables, both demographic and territorial, which describe the situation with regards chronic illnesses and help identify any correlated factors whereby interventions could be carried out, in order to encourage improvements in health checks and to gather new data on chronic and oncological illnesses. If we divide the Veneto region into five large areas (Note 22), and by types of municipalities, in order to calculate the territorial indexes on health, it can be seen that the distribution of healthy individuals is fairly even: for example, 51.8% of the population of the provinces of Belluno and Treviso area do not suffer from any chronic illnesses, nor do 53.7% of the population of Vicenza. There is more of a gap, however, if we look at the municipalities by demographic size: in the capital municipalities or those with more than 50,000 inhabitants, 47.7% of the population have no chronic illnesses, compared to 54.0% in other municipalities. (Figure 11.1.23) Women tend to be more affected by chronic illnesses, taking into consideration their longer life expectancy: in Veneto the share of females who do not suffer from chronic illnesses is around 9 points lower than the share of males (48.4% and 57% respectively), while in 2005 there were around 387,000 female sufferers of three or more chronic illnesses, which equals 16.4% of the female population, compared to 10.7% of the male population. Age, as can be expected, plays a large role in the number of chronic illnesses: these illnesses, especially the degenerative type, become more common and more serious as age increases. In the 0-14 age group 85.8% of the population do not suffer from chronic illnesses, this share decreases steadily as age increases until it reaches 11.4% for the over-75 age group. Along the same lines, the percentage of people complaining about one or more chronic illnesses reaches almost 50% in over-75 year olds. Chronic illness in elderly people is a question which is becoming more and more problematic, not only for the health care system, but also for the families of those afflicted. When an elderly person becomes ill and decides to continue living at home, their care requirements force the family to adjust their lifestyles too in order to make sure they are taken care of. Chronic illnesses are also linked to the level of education: people with a primary school diploma or no qualification at all are more likely to contract chronic illnesses than people with a higher level of education. The link between age and educational qualification must be remembered however: not counting children, it is mostly elderly people who have a lower level of education and who are obviously also more at risk of contracting chronic degenerative diseases. (Figure 11.1.24) Osteoarthritis is the most common chronic illness (18%), followed by hypertension (15.3%), by allergic illnesses (11.8%) and by headaches or hemicrania continua (8.7%). The above illnesses account for over half of the cases of chronic illness in people who live at home. (Figure 11.1.25) As far as acute problems requiring a stay in hospital are concerned (Note 23), in women the main causes in 2004 were complications experienced during pregnancy (Note 24), with about 650 hospitalisations per 10,000 inhabitants, and problems with the circulatory system. Hospitalisations in men were mainly for problems with the circulatory system, tumours and problems with the digestive system. (Figure 11.1.26)
Levels of disability and invalidity in a population can also serve to help describe the general state of health. These conditions not only affect the sufferers themselves but also their families who look after their needs on a daily basis and who have to deal with the difficulties created by living with a person who is not self-sufficient.
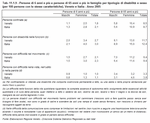
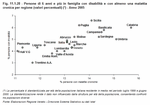
Disability is one of the most pressing concerns regarding public and private healthcare. When the person with a disability is an elderly person, if they decide to continue living at home it becomes necessary to take care of them and the family members take on the role of caregivers; when it is a young child, after working hard to make sure they are integrated into school and where possible also enter the labour market, there is also the worry of having to look after them through adulthood and old age. A disabled person (Note 25) is someone who has serious difficulty in carrying out certain functions, even taking into account the use of external aids (prostheses, walking sticks, glasses etc.). This does not include any temporary limitations. The number of disabled people who live at home as a percentage of the overall population is on the decrease. In Veneto this figure passed from 5.2% of the population aged 6 and over in 1994, to 4.3% in 2005, making a total of 182,000 individuals (Note 26). More females seem to be affected than males. It is not possible, however, to verify whether the decrease in the number of disabled people is really so or whether it is actually down to an increase in the use of specific residential care structures for differently-abled people. In line with the rest of Italy, but differently to other industrialised countries, Veneto has a family-based culture in which there is the tendency, where possible, to keep the family member in need of assistance at home. (Figure 11.1.27) and (Table 11.1.9) Disability is closely linked to chronic illnesses; in the Italian regions with a high number of chronic illnesses, there are also high levels of invalidity. To this regard, the situation in Veneto is very similar to the Italian average. (Figure 11.1.28) Invalidity (Note 27) is an impairment of a particular organ, it is not measured through an evaluation of a person's self-sufficiency. As in the case of illnesses, age has a large influence both on levels of disability and of invalidity: women are more affected by disabilities (5.1% compared to 3.2% of men), as are elderly people with the percentage reaching 17.5% of over-75 year olds in Veneto. In 2005, 6.7% of the population were invalids, with this figure reaching 21% of over-75 year olds. Mental invalidity is fairly contained in Veneto, as it is on a national level also: it must be remembered however that some of the people with mental illnesses, most likely those with higher degrees of illness, are looked after by the health service and so are not included in our data. Let us take a closer look at the situation as regards the elderly who are no longer self-sufficient: on a national scale, 32% of people with disabilities live alone and the average age of these individuals is 76 years old for men and 80 for women. Without constant assistance from a family member, this situation can become extremely difficult for the person in question. Family remains the main focus point for people with disabilities, most of the help they receive is actually from their relatives: according to figures from 2003, elderly people with disabilities can count on the help of their children who in 89% of cases live nearby and who in 87% of cases go and visit them at least once a week. (Table 11.1.10) Checkups and screening
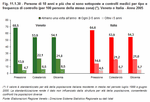
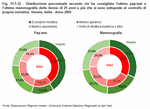
Periodical checkups for blood pressure, cholesterol levels and glycaemia are important preventative measures that need to be taken by the population. Regular checkups can help diagnose some common illnesses early on, such as diabetes, hypertension, hypercholesterolemia and cardiovascular illnesses; illnesses which play an important role with regards mortality rates. The over-65s in particular are exposed to health risks. The percentage of people in Veneto who have never been for checkups is lower than the Italian average: from 2 to 3 percentage points lower in all three checkup categories taken into consideration. The most common checkups are for blood pressure, both in the population overall and in elderly people. (Figure 11.1.29) Veneto is very similar to Italy overall in terms of checkup frequency. The Veneto population take care of their health. As a matter of fact, most people have a checkup once a year: for blood pressure 68.5%, for cholesterol levels 53.9% and for glycaemia 54.1%. 14% of 18 year olds and over have checkups for blood pressure slightly less frequently - every 2-5 years - for cholesterol levels and glycaemia this figure stands at 22%. (Figure 11.1.30) Vaccinations continue to provide an important preventive measure. In Veneto, more so than in the rest of Italy, a high percentage of children up to the age of 6 are given non-obligatory vaccinations. The main vaccination of this type is for whooping cough, in Veneto 88.3% of children are vaccinated against this as opposed to 82.6% of children in Italy. The lowest percentage of vaccinations is for rubella with 70.1% of children in Veneto being vaccinated against it and 67.6% of Italian children likewise. Children in Veneto are also vaccinated more often against measles and meningitis than children in Italy in general, which can be seen as an indication that the weakest age groups, such as children, are well taken care of in our region. Flu constitutes a serious issue for public health due to the fact that it is difficult to control the sources of infection and the ways in which the virus is transmitted. Provision of vaccinations for those at risk becomes a valuable means through which to contain the spread of the virus, as has been fully recognised by the Ministry of Health, which has asked for the anti-flu injection to be included in Regional Health Plans. The categories of people for whom this vaccination is strongly advised include health workers, elderly people and people already suffering from other illnesses. If we look at the concise data referring to the 12 month period leading up to the survey, around 20% of Veneto people had the anti-flu vaccine, this figure is the same for Italy. People who already suffer from some kind of illness make up one of the weakest population groups and are most at risk from catching the flu, for this reason particular attention must be paid to this group. The share of people in this group vaccinated against the flu ranges from 40% to 60%, this is very similar to the Italian figure. The share of the population aged 65 and over who have been vaccinated against flu is higher than in Italy as a whole (67% compared to 62%) showing that elderly people in Veneto are more aware of the issue and that the advertising campaign for the vaccination was more effective here. Another important way to look after one's health is to take part in initiatives aiming to diagnose certain illnesses early on. In this field, smear tests and mammograms for women are of particular importance. Breast tumours are one of the most common types of tumour and one of the main causes of death in women. In Italy, the use of smear tests and mammograms with the aim of preventing tumours is common and is down both to the initiative of the individual and also to campaigns organised at an institutional level. Between 2000 and 2005, the percentage of women between the ages of 25 and 64 who claimed to have had a smear test grew by 5 percentage points in Veneto (from 78.4% to 83.5%), and although this figure is slightly lower than the rest of the North-West (85.1%), it is much higher than the Italian average (70.9%). For the mammogram, the increase in use is even higher in Veneto: from 2000 to 2005 the percentage of women aged 50-69 who had a mammogram increased by 18 points (from 67.2% to 85.4%) to reach the same level as the whole North-West area, almost 15 points over the national average. (Figure 11.1.31) The percentage of women who have their first smear test once they reach adulthood is very high, this is in line with the national trend, however, in Veneto there is a slightly higher tendency to have the test at a younger age. For the mammogram too, the distribution of women in Veneto who had the test for the first time is similar to that on a national scale. The 35-44 age group has the highest frequency. Unlike the smear test, the mammogram should be done at a later age. The two screening programmes are aimed at two different areas of the population; the smear test in particular is suggested at an earlier age (from 25 to 64 years old), whereas the mammogram programme aims to test women from the ages of 50 to 69 every two years. Veneto women take particularly good care of their health. In Veneto, 41% of women decide to do the smear test of their own accord. 23.2% come to do the test because they have been invited to by the health service, this figure is higher than Italy's 18.9%. More than 1 out of 4 women do a mammogram after being invited to do so by the health service, this is higher than the national figure. Almost 1 out of 3 women take the test of their own accord. (Figure 11.1.32) Use of non-conventional medicines
Despite the fact that health services have developed both qualitatively and quantitatively, people still turn to non-conventional medicines (Note 28) above all in the North of Italy, although there is actually a better relationship between the citizens and the National Health Service. This is partly down to the fact that these types of medicines have become fashionable in recent years, but also that the population is starting to pay more interest to remedies which are natural and which are linked to certain cultures or traditions. In Italy in 2005 13.6% of the population had taken at least one type of non-conventional medicine (Note 29), large differences can be seen between the regions in this respect: figures range from 28.1% in Trentino Alto-Adige to 4.8% in Campania and Basilicata. In Veneto, almost a quarter of the population (23.4%) have used at least one of the different types of non-conventional medicine available. However, this habit seems to be decreasing: as a matter of fact, 27.1% of the population in 2000 used non-conventional medicines, for Italy this figure stood at 15.5%. (Figure 11.1.33) and (Figure 11.1.34) The most popular types of non-conventional medicine are homeopathy, manual treatments and herbalism. The use made of homeopathic products, herbal medicines and pharmaceutical products seems to be similar in Italy and in Veneto, in people who had used these products in the 12 months leading up to the survey. Most of the people questioned did not stop using pharmaceutical products even if they were also using non-conventional products: the most common approach was to use pharmaceutical products, combined with homeopathic and herbal medicines (around 45% of people who use non-conventional medicine). 13.6% used only non-conventional medicines (Italian figure: 17%).
The population's opinions on the quality of health services in their home areas are being taken ever more seriously.
In our region, people are slightly more satisfied with the public health service's opening times than people in Italy in general are. Satisfaction tends to increase with age; in Veneto, the percentages of people from many of the age groups who are satisfied with opening times are higher than on a national scale, this proves that our public health system has an above average level of efficiency. (Figure 11.1.35) Satisfaction levels in Veneto users of hospital services - medical care, nursing care and washrooms - are higher than the national average. In Veneto, satisfaction in terms of nursing care increased greatly between 2000 and 2005 (+11 percentage points), satisfaction with washrooms also rose (+12 percentage points), while in the meantime that expressed for medical care decreased slightly. (Figure 11.1.36) In general, the Veneto population has a positive opinion of the National Health Service (Note 30): less than 15% are dissatisfied with the service, whereas almost 8 out of 10 people judge it to be satisfactory or better than good. The population's faith in professional medical figures when it comes to important decisions regarding health problems can provide further information on satisfaction levels as far as the health system is concerned. Veneto people put most faith in their family doctor, as a matter of fact, almost 2/3 of the population turn to him or her for their important decisions. These are followed by private medical specialists. A higher share of people in Veneto express faith in hospital doctors than on a national scale. (Figure 11.1.37)
In 2007 CENSIS provided a synthetic health indicator (Note 31), which enables a comparison between regions to be made. The overall picture reflects the differences between the North and the South; health seems to deteriorate the further South we move. The overall indicator, which includes perceived health and objective measurable health, is clearly affected by the different lifestyles found in the different Italian regions and by a different approach to preventive measures. Social and economical conditions also have an influence: the regions which come in first in the ranking also prove to be at more of a disadvantage in terms of their social and economical background, with regards level of education and income for example.
The synthetic indicator highlights the better situation to be found in the North-Eastern regions, to which we can also add Lombardia, followed by Emilia Romagna. Marche, Molise, Toscana and Piemonte all stand in the middle of the ranking, directly above Campania and the remaining regions of the Centre of Italy. The regions which reveal the most health problems can all be found in the South, with the exception of Liguria. (Figure 11.1.38)
|
|
Data elaborated by the Statistics office of the Veneto region are collective property; reproduction of this material is authorised for non-commercial purposes only, provided the source "Regione Veneto - Regional Statistics System Management" is acknowledged.


 Index
Index  Home
Home 


