|
7 - Public Administration at the service of the community
Public institutions play a key role in promoting local development. To respond to local development needs, the Public Administration must employ bespoke and effective measures that support economic and social policy, and thus guarantee that users are provided with increasingly better services based on research, simplification and information.
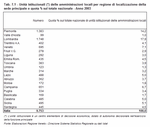
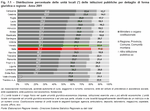
In 2003 Italy's Public Administration was organised into 9,976 institutional units, which included 9,753 local administrations; the remaining 223 were central administration bodies or national welfare and social-security bodies. Around one third of Italy's local institutional apparatus is based in Lombardia and Piemonte: 17.9% and 14.2% respectively, providing a service for a local population that comprises 16% and 7.4% respectively of the national population. It must be underlined that the local administration in Piemonte is rather fragmented. The situation in Veneto, however, is more balanced as its local administrations comprise 7% of the national total, providing a service for a local population that is about 8% of the national total.
The organisational entities, in which the Public Administration is subdivided, referred to as local units in statistics, comprise the majority of head offices at regional level, whereas most of the single institutional offices in Italy's regions are occupied by central government bodies. This figure is about 50% in Veneto, where 3,485 of the almost 7,000 public offices in the region are central, ranking it between Campania with 64%, and two special statute regions, Valle d'Aosta and Trentino Alto Adige. (Table 7.1) and (Figure 7.1)
The Public Administration is being reorganised in order to achieve higher levels of efficiency; to simplify administration; to employ good practice in the use of innovation and new technologies; and also to introduce more user-friendly policies. Radical changes in user needs and local developments mean that the Public Administration has to introduce an increasingly wider range of services in order to guarantee a level of service quality that meets community expectations.
To achieve their objectives, public administrations are using quality logic to manage their activities and services. Two of the most prominent tools being used are Charters of Services and Quality Management Systems (QMS), which have spread to an increasing number of public administration units over the last few years. As previously mentioned, Italy's Public Administration is aiming to simplify and streamline the relations between administrations, citizens and enterprises, which can be achieved by ensuring that the administrative apparatus is user-oriented and by assessing service quality and user satisfaction. The quality of the work a public administration does for enterprises can be measured by its ability to support them and provide incentives. Centro Studi Formez conducted a survey on the application of legislation to introduce unified access points (SUAP (Note 1)) in 2003 and 2004. The study revealed that Veneto had greatly simplified administration for enterprises, which would suggest that the foundations have been laid for further developments in years to come. The quality of Veneto's SUAP has been evaluated as above the national average, which suggests that the introduction of unified access points in Veneto has lightened the bureaucratic burden for business.
Nowadays innovation plays a strategic role in the Public Administration, both in terms of its internal running and in terms of the provision of services to users.
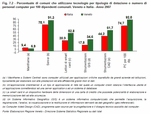
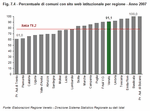
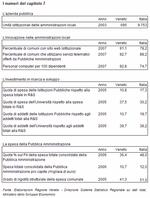
Management of Information and Communication Technology (ICT) is crucial. Public Administration has thus introduced a range of development policies and sector regulation, also in the wake of developments within national legislation, which led to the drawing up of a Digital Administration Code (Note 2). The latest technologies will enable the Public Administration to achieve new objectives and to be better equipped to meet user needs, improve management and organisational efficiency and ensure sustainable development. Local administrations, which are the main point of contact with citizens, have shown considerable interest in new technologies. In 2007, according to Istat, Italy's municipal administrations had 75 desktop personal computers or laptops per 100 employees, a figure which increased to 93 in Veneto. The most common technologies used by municipal administrations were client/server technologies, which were used by 78.1% of Italian municipalities and by 91.3% of Veneto ones. CAD systems, Geographic Information Systems (GIS) and smart card readers were also more frequently used in Veneto municipalities than in Italian ones; the use of mainframe information systems is rather limited nowadays. (Figure 7.2) The extent to which the Public Administration uses ICT is equally important. In Italy 88.2% of municipal administrations use the telematic services offered by other public administrations; the most commonly used services are those offered by ministries, welfare bodies, and other central administrations, followed by those offered by the regions. In Veneto 92.7% of municipalities use the telematic systems provided by central or peripheral public administrations. The National Centre for Informatics in the Public Administration (CNIPA) is involved in an initiative being joint-funded by the Alleanze Locali per l'Innovazione (ALI), which provide ICT and e-government services for small municipalities in order to support administrations with insufficient resources to keep up with innovation. (Figure 7.3) The objectives set to improve Public Administration quality aim to introduce new communication channels between public administrations and users, citizens and enterprises, as well as new methods for providing services. E-government with computerised documents and telematics enables costs to be reduced, procedures to be streamlined, and service quality to be improved. In 2007, 91.1% of Veneto municipalities had an institutional website, while the Italian average was 78.2%. Still low, however, is the number of municipal administrations offering telematic services on websites other than their institutional one, or telematic networks other than internet: 8.8% of Veneto municipalities provide additional public services, compared to 5.1% of Italian municipalities. (Figure 7.4)
The main purpose for installing innovative communication between the Public Administration and citizens is to bridge the digital divide (Note 3), an issue that politicians and experts are dealing with by setting up initiatives geared towards both public administrations and the sections of the population who have little knowledge about new technologies. In Veneto in 2006, 20.6% of the population over 14 years of age used Internet in their relations with the Public Administration, a figure that is slightly higher than the Italian average. In Veneto people use the internet mainly to access public libraries, to enrol in university or school courses, to pay taxes, to communicate with employment agencies, and to apply for a range of documents and certificates. The issue that mainly dissuades Veneto citizens from using Internet in their relations with the Public Administration is that they have no contact with an operator: 57.4% said they wanted to talk to a person and 10.1% said there was no immediate response to their request. Some (20.1%) refuse to go online for fear that their personal information is not safe, while others (16.1%) say that it is too complicated. However, Veneto citizens who did not use the internet in 2006 showed an encouraging interest in using it in their relations with the Public Administration: 44.8% said that they would be interested in a web-based relationship, which provides a ray of optimism for the participation of citizens in the development of e-government. (Figure 7.5) and (Figure 7.6)
Public administrations in Veneto study new technologies and use innovative tools to promote dialogue between the Public Administration and citizens, which suggests that they are keen to keep up with the times. In order to provide a clear and comprehensive insight into the Public Administration's commitment to innovation, we have also included an overview of investment in Research and Development.
In 2005, public institutions funded 17.3% of expenditure on R&D at national level, a figure that was 10.8% in Veneto. It is worth remembering that 50.2% of Veneto's expenditure on R&D comes from the business sector, a figure that is similar to the one at national level, which sees the business sector account for 50.4% of Italy's expenditure on R&D. In 2005, Veneto's public administration spent 6.6% less on R&D than it did in 2004, a figure that was fairly stable at national level. The figures published by Istat refer only to intramural research, namely research conducted with an actor's own employees and facilities (Note 4). The dynamics of the mid-term, however, highlight how Veneto's public administrations are attempting to raise expenditure in this sector: from 2000 to 2005 R&D expenditure by public administrations in Veneto increased by 26.7%, compared to an increase in national investment of 14.6%. University expenditure on R&D ranks in second place after investment by business: 30.2% of Italy's R&D expenditure comes from universities and this figure is 37.5% in Veneto. From 2000 to 2005, R&D expenditure increased by more than 20% both in Veneto and in Italy, although the latest figures available show a net decrease in these investments. A drop in university expenditure is actually due to a change in the way university expenditure is estimated, a procedure that has not yet been fully included in the Istat survey on R&D (Note 5). This reduction in expenditure by Veneto's public institutions is also mirrored in the number of R&D employees (Note 6): in 2005, human resources in this sector fell by 2.8% on 2004; however, the Public Administration in Veneto grew by 33% from 2000 to 2005. In 2005, Veneto universities, like those throughout Italy, increased the number of R&D employees on the previous year and indeed on five years previously. In 2005 Veneto universities accounted for almost 40% of the region's R&D employees, while just 10.7% of R&D employees work for public institutions. Overall, in 2005 75,759 euros were spent on R&D per sector employee in Veneto's public bodies and 82,645 euros in Italy's; university expenditure per R&D employee was 70,705 euros in Veneto and 70,349 euros in Italy. (Table 7.2) and (Table 7.3)
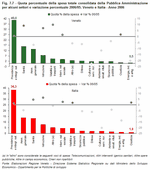
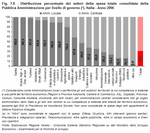
Recent organisational and management changes within public administrations are behind the market orientation of public bodies and the consequent rebalancing of public spending. The main change is the increase in local administration competences, as per the subsidiarity principle, and the second the need to contain expenditure, as required by the Internal Stability Pact. In 2006, Veneto's public finance framework, which is illustrated alongside levels of government, saw welfare and income support account for more than 40% of consolidated expenditure (Note 7); healthcare accounted for 15.9% and general administration, calculated from ordinary investment expenditure by administrative structures, 13.5%. The following sectors were under 10%: education (7.7%), roads and transport (4.4%), social issues (3.8%), and territorial defence (2.4%). The other expenditure areas do not exceed 2 percentage points of total public expenditure. It should be noted that health, tourism, environment management, trade, construction, labour, education and agriculture are the main sources of expenditure for local administrations. (Figure 7.7) and (Figure 7.8)
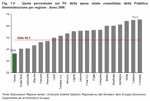
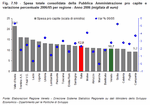
Veneto performed particularly well in the Italian rankings 2006 for total consolidated expenditure by the Public Administration as a percentage of GDP. Veneto's consolidated public expenditure was 36.4% of GDP, compared to an Italian average of 48%, ranking it the lowest of Italy's regions. Analysis of consolidated public expenditure per capita for 2006 revealed that Veneto is just below the national average: 10.7 thousand euros were spent per Veneto resident by the central and local Public Administration, while 12 thousand euros were spent per Italian citizen. The annual percentage variation for Veneto shows that expediture per capita increased by 2.8% in 2006, compared to a national increase of 2.3%. The regional rankings for public expenditure per capita revealed high figures for Valle d'Aosta, Trentino Alto Adige and Friuli Venezia Giulia, which are all regions with their own special statute. (Figure 7.9) and (Figure 7.10)
Municipal administrations manage the financial flows that affect citizens more directly.
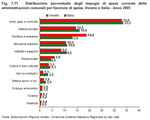
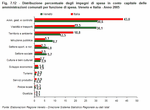
The composition of municipal expenditure for 2005 (Note 8) illustrates that on average Veneto municipalities devote a high proportion of current expenditure (16%) to the social sector, second only to expenditure on management and control administration, which accounts for 33.5% of total current expenditure. After these expenditure areas, Veneto municipalities spend most on territory and environment, public education, roads and transport, all areas that each account for more than 10% of expenditure. The distribution of the current expenditure of Veneto municipal administrations is more or less identical to the national average. The capital account expenditure functions that cut most heavily into municipality budgets are for management and control administration, which accounts for 43% of total national expenditure and 30% of Veneto expenditure; roads and transport account for 20% and 30% respectively. (Figure 7.11) and (Figure 7.12) The main priority of municipal administrations is to ensure their citizens enjoy a respectable quality of life, safety and social inclusion. A good administration should be able to provide optimum management of public expenditure and ensure an acceptable level of public welfare without having to declare a state of emergency. Nowadays it is clear that most municipalities do not have the tools to govern in a way that fully meets the needs of their citizens and improves quality of life without having to resort to extraordinary powers. One of the economic and structural indicators that can be used to analyse the economic and financial management of municipal administrations is a structural rigidity index for expenditure, which represents how personnel costs, plus loan and interest repayment, affect the total of current revenue; the higher the indicator, the less flexibility the body has to act upon current expenditure. In 2005 Italian municipalities had a structural rigidity of 51%, 9% of which was due to loan repayment and 32% to expenditure on personnel. Since 2003, this indicator has risen by almost 8 percentage points. Between 2002 and 2005, the structural rigidity for expenditure for Veneto's municipal administrations was consistently lower than the national average; in 2005 figures for Veneto were almost 10 percentage points below the Italian average. The lower structural rigidity of Veneto expenditure is not due to extraordinarily good revenue, as Veneto's current revenue is not particularly high, but rather to a containment of expenditure on personnel and loan repayment. (Figure 7.13)
|
|
Data elaborated by the Statistics office of the Veneto region are collective property; reproduction of this material is authorised for non-commercial purposes only, provided the source "Regione Veneto - Regional Statistics System Management" is acknowledged.


 Index
Index  Home
Home 