|
1 - From global to local: GDP and production sectors
The European Union is developing an index that will enable the measurement of environmental progress and also the use of an integrated accounting system, as well as other subsystems, in order to improve the decision-making process. A BETA version should be ready by 2009, but in order to afford an insight into the social and economic situation of the Veneto region, such crucial indicators (Note 1) such as GDP, consumption, investment, costs, trade, and inflation are already today taken in consideration for explaining economic progress, one of the most important factors for the prosperity of a region and an essential facet to the improvement of quality of life.
In 2007 the world economy showed signs that the cycle of expansion was slowing after at least a decade of growth. A sluggish American economy and the credit crisis had already cast a cloud over the situation, but worse was to come as a wave of turbulence swept over the raw materials markets, the dollar and financial markets in general. The upshot of these events was an erosion of purchasing power due to increasing energy and food prices, as well as families and companies tightening their belts in order to cope with an increasingly unstable economic situation.
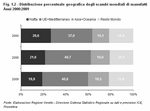
The world economy also suffered from increased speculation in the wake of America's subprime (Note 2) crisis; speculation was further fuelled by market jitters caused by slumps in bank profits and by hypotheses on subsequent US monetary policy. However, increasing raw materials prices and a weak dollar were not caused by speculation alone, but in conjunction with the imbalances in the current world situation: on one hand there is great demand for energy and food to fuel the development of emerging countries; on the other the structural instability of the United States, which first manifested itself in 2007 with the bursting of the real-estate bubble and the ensuing credit crisis. The recovery of US exports, boosted by a weak dollar, cannot hope to provide lasting support to the economy as foreign demand is a minor share of GDP. The unemployment rate is growing, a drop in profits is generally expected, and falling share prices have spread from financial sectors to business. According to the most recent official forecasts, the slowdown can be contained (the government may also intervene on fiscal policy to help stimulate the situation), but there is a risk that in the near future tighter financial conditions and greater uncertainty will lead families and businesses to cut their expenditure. (Figure 1.1) US turbulence did not slow the flow of foreign capital towards emerging economies, and although its effects had no impact on the euro area until the third quarter of 2007, they caused growth to slow in the first few months of 2008. (Table 1.1) In 2007, international trade was less dynamic than the exceptional growth of 2006, although its trends remained sprightly. (Figure 1.2) There was a sharp drop in US imports from industrialised nations, and the signs of a slowdown in the international economy that emerged at the end of 2007 are expected to continue through to early 2008, dealing a further blow to the manufacturing trade. Industrialised nations, however, should be able to more than compensate for this loss with the development of trade with other regions. Since the start of the decade, NAFTA countries (Note 3), and the United States in particular, have imported less, but industrialised nations have exported more to Asian countries; additional contributions have been made by commercial integration between European and Mediterranean countries due to the progressive expansion of the EU free-trade area and by an increase in Direct Foreign Investments by Western Europe in the outlying areas. The euro hit a new high against the dollar at 1.594, beating the previous high of 1.4874 on 27 November 2007. The dollar's exchange rate against six of the world's major currencies, the Dollar Index (Note 4), has seen the dollar drop to an all-time low of 70.74. The strength of both the euro and sterling was partly due to an improvement in the economic conditions and growth forecasts for EU countries. What also contributed was a contained demand for financial transactions in dollars due to lower interest rate differentials. However, there has been no change in the exchange between the dollar and the currencies of the countries with which the US has most of its deficit, mainly Japan, China and the oil-exporting countries. However, there has been no change in the exchange between the dollar and the currencies of the countries with which the US has most of its deficit, mainly Japan, China and the oil-exporting countries. (Figure 1.3) Raw materials
Over the last few months, the price of oil has been high. Indeed, in early 2008, it broke through the $100-a-barrel mark, which it had threatened to do in late 2007. It has since soared to more than $106 dollars a barrel. A combination of structural factors have kept prices high: supply issues included the low production margin available to meet fluctuation in demand, fears concerning output in Nigeria and Venezuela, and difficulty finding new deposits; demand issues included inflexible prices due to the persistent oil dependence of the world's major economies.In Europe, the impact of high oil prices has been softened by the appreciation of the euro, even though its effects have still been felt on the price of petrol and diesel. Over the last three years, the industrial price of petrol and diesel in Italy, net of tax, has been consistently higher than that in other euro-area countries. The differential in Italy, unlike in Germany, Spain, France and the United Kingdom, tends to increase when prices fall. According to the European Commission, from the start of January to mid-March 2007, the price of petrol at the pump (including tax and excise) rose from 1.20 to 1.39 €/litre, a hike of 15%. According to the most recent data, the price of petrol at the pump in Italy (1.389 €/litre) is the same as in the UK, lower than in Germany (1.414 €/litre), but higher than in France (1.371 €/litre). It is also higher than in Spain (1.124 €/litre), but this is due to a different tax regime. After dropping in late 2007, the prices of industrial raw materials started to climb again in the first few months of 2008, partly because of fears about lack of supply. Between January 2006 and February 2008, metals, in particular, underwent a major price hike, rising by 23%. After a drop, nickel, in particular, surged to a price index of almost 215% (Note 5) in May 2007 gaining 64%; lead jumped to 79.9% on February, up by 54% on January 2008; copper also rose to 34.2%, up by 28% in economic terms, clearly affected by inflation; aluminium however was stable throughout the period examined, increasing by 9% on January 2008. (Table 1.2) Europe
The economy of EU27 performed extremely well in 2007, growing by around 2.8%; it was only in the fourth quarter that development slowed in line with the general situation of the world economy. Generally, growth was driven by investment, mainly in the new Member States, which benefited from direct foreign investments and from the use of EU structural funds. Despite an improvement in labour market conditions, family consumption was by no means excellent as it was hit by a lack of confidence after an increase in the inflation rate. However, improved state finances did mean that there was positive news for the area as a whole: economic growth and tough policies reduced the deficit and national debt as a percentage of GDP.In the euro area, 2007 ended on a positive note with GDP rising by 2.6%, although it had slowed down a little on last year and indeed over the last few months. Growth slowed due to a combination of US turbulence, a strong euro, a drop in consumer purchasing power following a rise in energy and food prices, and the increasing difficulty families and businesses have accessing credit. In the fourth quarter 2007, private consumption did not contribute towards growth, which was supported by investments and exports. The labour market gave positive signs: at the end of 2007, the unemployment rate in the euro area had dropped to an all-time low of 7.2%, which was in line with the annual average of 7.4%. Growth in 2007 varied throughout the euro area: Spain closed 2007 with a 3.8% increase in GDP, a figure significantly higher than the EMU average; in 2007 average annual growth in Germany was 2.6%; while France and Italy were less dynamic with growth of 1.9% and 1.7% respectively. In the last few months of the year, growth slowed in all EU countries, apart from in Spain, due to private consumption grinding to a halt, while investments held. In 2007, the GDP of the United Kingdom, which does not belong to the euro area, grew by 3.1%, an increase on the previous year. This positive trend was promoted mainly by internal demand, which was sustained by an increase in disposable income. Over the last few months, the UK economy has nevertheless shown signs of slowing, in line with the euro area. (Table 1.3) The Italian economy
An overall assessment of the Italian economy for 2007 reveals an extremely varied and often contrasting range of factors: national finances improved; the incidence of primary current expenditure on GDP lowered; the fiscal burden increased again; public investments increased less than GDP after they had decreased in the previous two-year period; expenditure on interest rose sharply; the public sector borrowing requirement fell to its lowest since 2000; and the labour market developed positively. Overall, GDP grew by 1.5%, slightly lower than the previous year; but while 2006 was a year of recovery, 2007 recorded a slowdown that also partly compromised the dynamics for 2008. Domestic demand was sustained by family expenditure, rather than by investments. Sector by sector, services made the most important contribution with an annual increase of 1.8%; but two of its sub-sectors, monetary and financial brokerage, and commerce, developed most notably: 2.3% and 2% respectively. The construction sector also contributed, up 1.6%; industry in the strict sense made a modest contribution with an 0.8% increase, while the agricultural sector was stagnant.According to forecasts by the OECD and the International Monetary Fund, future trends based on the current international situation will probably mean a slowdown for the Italian economy: GDP is expected to slow considerably, dropping below its potential growth (already low in international terms) both this year and the next. The high price of oil and some food weigh upon family disposable income and have led to a fall in consumption. A combination of low productivity and a soaring euro makes the price of Italian goods less competitive, slows exports, and encourages the purchase of imported goods. Italy is still waiting for productivity to spring to life, and while it does so competitiveness and the purchasing power of workers and families suffer, and consequently so does consumption. Over the last ten years, per capita disposable income, net of inflation, has grown modestly, mainly due to stagnant production, regardless of an improvement in the labour market. Tax cuts, which were a major talking point in the recent electoral campaign, may have a positive effect on consumption and production, especially if they were aimed at lower-income families, who tend to consume more, even though much of these families' expenditure is spent on the most common imported goods. However only increased production efficiency will provide long-term support for development. (Table 1.4)
The Istituto di ricerca Prometeia estimates that GDP in Veneto will grow overall by 1.8% in 2007, with a prospect of 0.7% growth in 2008. The 2007 figure, which is better than the national one, is mainly due to the growth of services and to steady domestic demand.
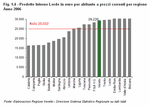
In 2006, the most recent year for which official data on local accounts is available, the economic recovery that started in summer continued and gradually consolidated, experiencing 2.5% growth, its highest in the last six years. This figure meant that Veneto stood alongside Friuli Venezia Giulia as Italy's top performing region. GDP in real terms, i.e. not counting the effect of price variation, grew more than the whole north-east area (2.4%), and more than the entire country (1.8%). In 2006, Veneto was once again the third leading regional contributor to Italy's GDP: the region contributed 9.5% to the national total, Lazio 10.8% and Lombardia 20.8%. This fine result was due to the development of the industrial sector, the growth of international trade, and the flexibility of the production system, which is benefiting from innovation in its production, organisation and distribution processes. Internal demand was supported by family expenditure, up 1.4%, although families were still prudent, mainly on account of financial market turbulance. In 2007, consumption trends still looked promising, but towards the end of the year family expenditure weakened due to rising inflation, rising debt service burden, i.e. interest payments and capital repayments, and fewer families taking up loans, which have become more costly. After an acceleration in 2005, total investments are slowing, although there will be a modest increase between 2007-2008, in line with all of Italy's other regions. (Figure 1.4) Added value per sector
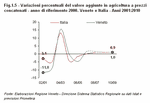
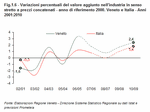
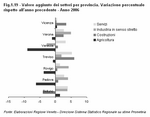
A major contribution to growth in added value was made by industry, which still accounts for 35.1% of the Veneto's entire regional wealth; in 2006 it recovered significantly, up 3.1%, after years of stagnancy. Both its sub-sectors improved: the construction sector did not do as well as the previous year, but it still increased by 2.4%; while industry in the strict sense grew by 3.3% after slowing down in 2005.The service sector makes up 62.2% of regional GDP and, though almost stagnant in 2005, grew by 2% in 2006 thanks to trade, which performed excellently, up 2.9%. Agriculture was the only sector to perform negatively in the production of added value and it has continued to fall since peaking in 2004. In 2007, the agricultural sector is expected to recover, the construction sector to stagnate and both industry and services to perform well. (Figure 1.5), (Figure 1.6), (Figure 1.7) and (Figure 1.8) Productivity
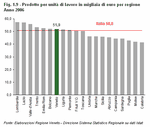
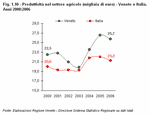
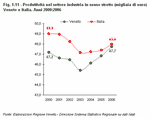
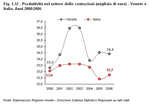
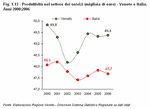
Labour productivity has always been a key element for measuring an area's competitiveness and appeal, but in businesses in it often considered an index of economic efficiency and thus the quality of an organisation, sector or area. An improvement in productivity, at stable labour intensity, could be brought about by the introduction of innovative processes into company organisation and/or technologies, which would certainly also lead to a rise in labour quality.In Veneto, labour productivity has recovered strongly since 2003: in 2006 wealth produced per labour unit was 51.9 thousand euros, one of the highest regional values, and its growth rate is higher than the national rate per labour unit. There is a net recovery in the industry in a strict sense sector, where despite increased employment, the gap has closed between regional and national productivity, which is traditionally higher. This is a sign that Veneto's traditional manufacturing sector is changing and that it is gearing its efforts towards producing increasingly high quality products with higher added value. In other sectors whose productivity levels are higher than national ones, there has been a fall in agriculture and a slight recovery in services, which have seen the gap with Italy widen since 2002. (Figure 1.9), (Figure 1.10), (Figure 1.11), (Figure 1.12) and (Figure 1.13) Investments
The most recent data and forecasts for the coming years show that investments will not be linear. Nationally, after years of ups and downs, there was an increase of 1.2% in 2007, though it did waver slightly in the fourth quarter and thus reduced the contribution to the growth of GDP. In 2007, construction and intangible assets were the sectors that grew most at national level; transport also rose, but more slowly, while company investments in machinery and in equipment were stagnant. Regarding the short- to mid-term outlook, the Bank of Italy and ISAE have expressed caution. In 2005, the most recent year for which figures are available, Veneto's growth of 2.2% was mainly driven by investments in services, up 3.9%, and especially in trade, up 11.6%. Investment in agriculture also rose, up 1%. Investments in industry in a strict sense were stable, while investments in construction fell by 11.1%, probably due to the saturation of residential building. A slowdown has been forecast at regional level for the coming years, but there will be no interruption in the cycle of expansion. In 2007 there may be a rise in construction investments thanks to the support provided by tax breaks for residential building and by funds for public investment, and also on account of the effects of higher interests rates. (Figure 1.14) Consumption
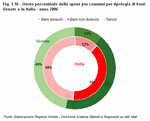
In real terms, the growth rate of national consumption is around 1.4%. Since the beginning of the third quarter 2007, family consumption is the component of internal demand that has grown the least. In 2008, the fall in family expenditure was due to an acceleration of inflation, increasing debt service burden and fewer families taking up loans, as they have become more costly. A more accommodating fiscal policy will enable consumption to recover modestly, although it will still be limited by a need for families to cope with mortgage repayments and by uncertainty about pension income. In Veneto in 2006 expenditure on final consumption was up by around 1.4% in line with the Italian rate. Demand has increased the most for durable goods, which constitute 12.1% of total expenditure; non-durable goods increased by 0.3%, and services, which make up 49% of expenditure, rose by 2.1%. When compared to the national average, distribution of expenditure type does not vary greatly, except that consumption in Veneto tends to be mostly geared towards durable goods. Since 2000, family expenditure has shifted from transport, clothes and footwear, furniture and electrical appliances, recreation, culture and alcohol towards the home and communications, a trend that mirrors general economic analysis. In 2007, family expenditure benefited from good employment rates and disposable income, increasing throughout the north-east. The forecast for Veneto is a 1.4% increase. In 2008, however, expenditure is expected to slow by 0.5%. (Figure 1.15), (Figure 1.16) and (Figure 1.17)
Inflation is an obstacle to the general spread of economic well-being: it weakens the purchasing power of fixed-income families, redistributes wealth blindly, discourages investment, and widens the gap between prices and salaries.
The inflation rate was 2.9% in the euro area in the fourth quarter of 2007, a net acceleration on the 1.9% average for the previous quarter. Despite the rise in the euro-dollar exchange rate, which reduced import input prices in euro, inflation soared because of energy and food prices. In 2007, these two categories caused a rise of more than 3% in the cost of the basket of consumer goods, which verged on 30%. The prices of these two primary inputs were driven by the impetuous increase in the demand of households and businesses in emerging countries, however the rising use of some agricultural products in the bio-fuels industry also contributed. This year, the average inflation rate in the euro area is expected to be 2.5%, well above Eurosystem's benchmark for price stability. Inflation is expected to fall back in line with this value in 2009. At national level, the annual growth rate of prices was stable at about 1.6% (1.7% in the first three quarters of 2007), but accelerated unexpectedly to 2.6% in December. On average in 2007, the consumer price index for the whole nation increased by 1.9%. Price increases in Veneto and in Italy
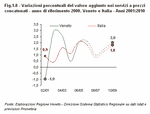
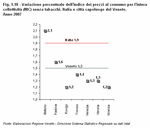
In February 2008, Italy's inflation rate (NIC) was 2.9% on an annual basis, down slightly on January's 3% rate. The steady pace of inflation was again affected by the rising price of energy and food. Italian inflation was, however, lower than that in the other euro-area countries. According to the Harmonised Index of Consumer Prices (HICP) (Note 6), Italy's consumer prices rose by 3.1% in February, stable on January, while prices increased by 3.3% within the Monetary Union after rising by 3.2% the previous month. This month has also seen notable increases, especially for consumer packaged goods such as liquid fuels and fuel in general, bread, pasta, flour and butter. Just as notable were reductions in the price of hi-tech goods, telephone services and holiday packages. In 2007, inflation in Veneto was slightly lower than the national average, 1.5%, although it was 2.1% in the town of Belluno. Both in Veneto and a national level, the prices that contributed the most to the rise in inflation were those for food, energy consumption, the home, and hotels and public shops. (Figure 1.18)
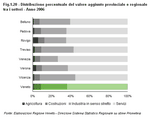
Only estimates are available for the creation of wealth at provincial level for 2006. The biggest contribution to regional growth was made by the provinces of Treviso, Belluno and Verona. Padova grew by 2.8%, while Venezia, Rovigo and Vicenza increased their wealth at a rate that was slightly lower than the regional one.
The agricultural sector experienced a sharp drop across all provinces except for in Belluno and Vicenza. The construction sector developed well in Treviso, Vicenza and Verona, but recorded a drop in Belluno. The provinces that performed best in the industrial sector were Verona, Rovigo and Belluno. There were considerable improvements in the service sector in Treviso, Belluno and Vicenza. Growth is forecast in all of the provinces for 2007 and is expected to continue in 2008. (Table 1.5) and (Figure 1.19) and (Figure 1.20)
National agricultural productivity did not take off as hoped, according to the Italian confederation of farmers. Production dropped by 0.5% on 2006, a drop of 0.2% in added value in real terms. Producers' income also fell, dropping by 1%, and as did employment within the sector, down 4%. Italian agriculture is not expected to recover in 2007; in fact the situation may worsen.
Rising oil and feed prices triggered an increase of more than 6% in the production costs of businesses, creating a further obstacle to investment, which rose by only 0.6%. Consumption of agro-food also fell. Plant breeding and livestock
Plant breeding plummeted 3.4%, continuing the fall of the previous year. The production of soya and sunflowers dropped furthest (down 20% and 16.5% respectively) mainly due to a reduction in farmland allotted to them. Cereals, however, remained fairly stable (up 0.8%) due to the steady growth of durum wheat and bread wheat (both up 1.7%), which compensated for the drop in barley (down 4.7%).The production of the most important permanent crops (apples, pears, kiwis and citrus) also fell. Vines were especially affected: not only were grapes harvested earlier than in recent years, but the wine sector suffered low yield in almost all of the regions, with volume dropping sharply on last year (down 12%). Olive oil production is also expected to fall by 17% Vegetables, particularly industrial tomatoes, fared better, however. Bucking the trend of previous years, the animal husbandry sector increased by 2.9 %, a figure mainly due to the recovery of the poultry market, which had suffered a major crisis in the wake of bird flu hysteria. The pig sector suffered greatly however and breeders saw their prices plummet and their production costs rise. Both the beef and buffalo meat sector, as well as milk production, remained substantially stable. In general, the 0.9% fall in national agricultural production was determined by a 3.4% drop in the plant sector and a 2.9% increase in the animal husbandry sector. Although in 2007 Italy did not show any comforting signs of a recovery, Veneto went against the trend. According to INEA forecasts, gross production will increase by 10% on the previous year (an increase of about 2% at constant prices) and this is expected for the following sectors: horticultural and permanent crops, plus livestock. (Table 1.6) In addition to the evaluation at current prices, growth in real terms has also been confirmed for all three sectors. Analysis of the performance of each sector reveals that horticultural crops will increase by about 1% at constant prices after last year's drop, an achievement mainly due to corn, wheat, beetroot and tobacco. Soya and sunflowers, however, fell due to the poor weather conditions and to a resizing of farmland respectively. The vegetable market also fell. The real production of permanent crops is expected to rise by about 3%, with the growth of vines being especially good. Although the harvest throughout Italy occurred earlier than usual, production increased by about 5%. Turnover is also expected to increase by more than 20% on 2006. Veneto confirmed that it is Italy's leading region for the production of DOC wines and for overall production. (Table 1.7) The animal husbandry sector saw the poultry sector in clear recovery: The bird flu crisis seems long-forgotten, and the poultry and egg sectors are now leading production growth within this industry; other types of livestock have suffered from different problems with an ensuing loss in productivity: the cattle sector has been affected by rising feed prices and falling consumption; while the pig sector has become less attractive to the market and suffered a fall in price. The latest official figures for the number and type of farm dates back to 2005, when the structure and production of farms was portrayed in a national survey. The 143,024 farms in Veneto had fallen by 19.2% on the 2000 census: this figure was in line with the Italian average where the drop since the census was 19.7%. The UAA had also fallen since the census, although much less than the fall in the number of farms: UAA in Veneto dropped by 6.2% and in Italy by 2.7%. The consequence of this phenomenon was an increase in the average agricultural area per farm. See the chapter on farming for further details.
In 2007, Italian businesses confirmed that the national production system was still undergoing a major transformation. Internationalisation processes are causing great upheaval in production companies and markets all over the world.
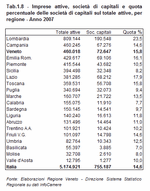
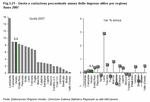
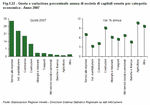
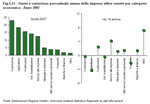
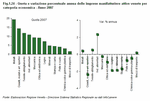
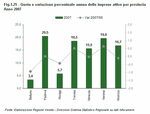
In 2007 the number of Italy's active enterprises grew by 0,1%, net of the contribution of the agricultural sector, (up by 0.3% including farms) its lowest increase of the last few years. The positive figures for new enterprises, the best result in the last decade, was offset by the consistent number of enterprises closing, a figure that has grown progressively in recent years; last year it reached its highest value of the last 15 years. (Table 1.8) Two main factors help explain the growth of new enterprises: one is the consistent increase of joint-stock companies and the good performance of the construction and business services sectors; the other is the reorganisation process, manifesting itself in the closure of small enterprises, that mainly affects manufacturing enterprises and farms. Analysis of legal status reveals that individual concerns continued to fall, down 0.8% in the last year, as did partnerships, while joint-stock companies rose by 6.3%. The picture in the economic sectors varies: the increase in active enterprises was stable with above average increases in construction, business services and hotels and restaurants: up 3.4%, 3.6% and 1.8% respectively. The number of active enterprises in agriculture fell by 2.6%, in transport by 2.1%, and in manufacturing by 1.2%. (Figure 1.21) Central Italy was the driving force behind the overall growth in the national enterprise system. The number of active enterprises increased in Lazio by 2.9%, in the Marche by 0.8%, and in Toscana by 0.6%. However, there was a negative trend for some southern regions: Molise down 1.3% and Calabria by 0.8%; while in the north Friuli Venezia Giulia fell by 1.3%. In 2007 Veneto had more than 460 thousand active enterprises and the growth rate was up on the previous year; excluding agriculture it increased by 1.2% (up 0.1% including farms). As at national level, Veneto experienced high rates of revenue, 7,7%, and of expenditure, 7,9%. Over the last few years, competitive pressure introduced by delocalisation mainly affected small, low-capital enterprises that were not able to innovate, thus being pushed out of the market because of low income prospects. (Figure 1.22) Analysis of legal status reveals that the annual development rate of active enterprises is affected by two main phenomena, both in Veneto and across Italy: on one hand the rising number of joint-stock companies, a confirmed long-term trend, on the other the constant drop in individual concerns. Joint-stock companies recorded annual growth of 5.8%. Individual concerns, however, experienced a slight drop of 1.4%, which was almost in line with the national average, down 0.8%. Analysis of individual sectors for 2007 reveals that Veneto had more than 72 thousand active enterprises in the construction sector, an increase of 2.5%. However, this is the lowest growth rate of recent years: the financial crisis and increasing interest rates appear to be the main causes behind the slowdown in the real-estate market. Furthermore, the construction sector is characterised by its high number of small enterprises, more than 72% are individual concerns, which are more exposed to any turbulance in the financial markets. (Figure 1.23) The most consistent increase in active enterprises was in the business services sector, up 2,350 units on 2006, a rise of 4.2%. In 2007, the active enterprises in this sector reached almost 58 thousand units, confirming the long-tern trend that production sector employees were moving towards services. The number of active enterprises in the commercial sector is almost unchanged, down 0.2%, which reflects the modest growth of retail enterprises, up 0.2%, but also a partial drop in wholesale commerce, down 0.5%. The manufacturing industry in Veneto, which numbered 65,833 active enterprises in 2007, recorded a slight annual drop of 0.4%. As mentioned above, the reorganisation of the manufacturing industry is due to a process of selection at the production base caused by the inability of smaller companies to retain market competitiveness. The long-term downward trend that has affected manufacturing, which is part of the general change sweeping through the industrial sector, is not therefore a contradiction of the positive signals coming from other sector indicators, such as turnover and export. (Figure 1.24) The number of active enterprises in the foodstuff industry has risen by 2.4% on 2006, in the textile and clothing industry by 0.5%, and in metals by 0.4%. The following, however, have seen their number of active enterprises fall: furniture - jewellery - sports items, down 2.3%; wood down 1.9%; paper down 1.7%; and optics-electronics down 0.9%. The number of active enterprises in the mechanical and transport industries was almost unchanged, up 0.2%. At provincial level, active enterprise dynamics sector by sector were fairly consistent across each province. These dynamics were in line with regional figures and ranged from +0.6% in the province of Verona to -0.9% in Belluno. (Figure 1.25) The number of active enterprises in the handicraft sector was mainly stationary with a slight increase of 0.3% on 2006. At national level, there was also very little by way of growth in the handicraft sector, which was up 0.7%. Handicrafts continue to comprise a major part of the regional economy: in 2007 Veneto's 147,332 handicraft enterprises comprised 32% of the active enterprises in the region. the industry's economic importance is not limited to sheer numbers as it also makes a major contribution to competence variety and production flexibility, as well as playing a leading role in the specialisation of product supply chains and in the sub-supply cycles. The sectors that contain the largest number of active handicraft enterprises are construction with 82.8% of the regional total; personal services with 74.2%; manufacturing with 69.3%; and transport with 68.4%. (Table 1.9) Production handicrafts has maintained a positive trend, but its growth rate has been the slowest in recent years. This is a consequence of positive dynamics within the construction industry, although it is lower than recent years, and of a reduction in the number of manufacturing handicraft enterprises at a similar rate to 2006. Additional drops came in services, especially in transport and repairs, confirming a trend that has become structural. There is an exception in the tertiary handicraft industry where personal services are still growing somewhat, in line with previous years.
In 2007 Veneto had its best year for tourism in a decade. Arrivals increased by 5.3% and nights spent by 3.7% on the previous year, reaching 14 million tourists and 61 million nights spent; these figures have increased by 36.7% and by 18.2% respectively since 1997. (Table 1.10) and (Figure 1.26)
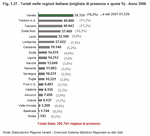
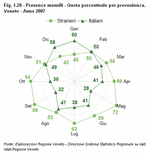
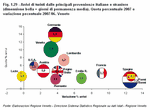
Veneto is Italy's leading region for tourism as over the last few years it has registered the most nights spent; in 2006 (Note 7) this figure was 16.2% of the national total. Veneto's position has been made possible by the influx of international tourists, who account for more than 34 million nights spent, a figure that sets Veneto apart from other regions. In addition, Italian tourists accounted for more than 25 million nights spents, placing the region in second place behind Emilia Romagna. (Figure 1.27) Veneto is the only area in the world where tourists can travel from lakes to mountains in a few hours, relax on more than 100 km of beach, and visit stunning natural parks, first-rate spa resorts, and unique cities. There is also plenty of opportunity for entertainment: Gardaland theme park is Italy's third most popular tourist destination after the Vatican Museums and the Coliseum; and there are also many night clubs and water parks. These destinations are made all the more attractive by the high standard of local food and drink. Veneto is also made much safer by one of Europe's best health systems and environmental quality certificates. Tourism in Veneto is based on international visitors: in 2007 the flow of international tourists constituted 58.7% of the overall nights spent, and over the whole year the flow of Italian tourists surpassed this figure only in the quieter months of January and December. (Figure 1.28) International tourism has recovered since 2004, after a period of uncertainty linked to fear of terrorism between 2002?2003, and today figures for international visitors are higher than those for Italian visitors (+5.4% and +1.3% respectively). The countries of origin table reveals an increase in the nights spent by nationalities who have been the main visitors for many years: Germans (+2%), Austrians (+3.8%), English (+5.6%) and Hollander (+6.8%), not to mention Americans (+2.4%), French (+9.2%) and Spanish (+16.5%); figures for Russian visitors (+31.8%) continue to soar, reaching 14th place last year, as did those for Irish visitors (+18.9%) who reached 17th place. The table of Italian visitors remained largely unchanged with a 10% difference between the number of visitors resident in Veneto and those resident in Lombardia; after which came Lazio, Emilia Romagna, Piemonte, Trentino and Alto Adige. (Figure 1.29) Most popular destinations
The unique nature, variety and quality of tourism in Veneto are the keys to the undisputed success of this sector. All needs can be catered for: tourists can visit some of the world's most beautiful and famous historic cities; spend the summer in one of the many beach and lake resorts; enjoy the largest and best equipped spa basin in Europe; or soak up the beautiful scenery of the mountains.Veneto's seaside resorts, which alone account for more than 40% of the nights spent in the entire region, are becoming increasingly popular (+2.9%) with both Italian and international visitors. The historic cities owe their excellent result for 2007 (up 8.4%) mainly to international visitors; there was a notable increase in French visitors (up 14.4%) who overtook the English to claim second place behind the Americans; the number of German visitors increased by 10.9% and Spanish ones by 19%. The largest increase in visitors to lake resorts came from Austria (up 23.4%), which took 4th place behind Germany, the Netherlands and Great Britain. The downturn in the number of visitors to Veneto's mountain region is mainly due to the peak of nights spent in 2006 in the resorts of Altopiano di Asiago during the national reunion of Italy's Alpine troops, which did not take place in Veneto in 2007. In the Dolomites, however, the number of nights spent did increase, though only slightly (+0.6% in the area of Cortina and +0.5% in the area of Belluno). Although the flow of visitors to Veneto's spa towns did not record any major changes on the previous year, it did reveal that international visitors, especially Germans and Austrians, were being slowly replaced by Italian visitors, including ones from Lombardia, Veneto and Emilia Romagna. A quick look at the provinces reveals the popularity of Venezia, which accounted for more than 33 million nights spent. This figure is more than half (54.5%) of regional flow and is due to the increasing popularity of beach resorts and the unique beauty of Venice. For several years, Venice has experienced an annual growth rate of more than 7% and in 2007 the number of nights spent reached 9 million. The province of Treviso recorded the most consistent increase (up 6%), which gave it 2.8% of the total nights spent in the region. The province of Verona continues to attract a high percentage of the region's total visitors (21.2%). This increase was mainly due to international visitors both in the municipalities of Lake Garda (up 4.8%) and in Verona and its surrounding municipalities (up 11.9%). The province of Padova had an increase in visitors to its main city, Padua, and to its surrounding municipalities (up 13.5%) rather than to its spa towns. The popularity of the province of Belluno stayed almost unchanged (up 0.5%), whereas the provinces of Vicenza and Rovigo suffered slight losses. (Figure 1.30) The economic value of tourism
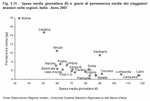
Tourism is a major part of the economy and it can drive many other areas that are based in the tertiary sector. Forecasts for the economic value of incoming tourism have been provided by a survey by the Bank of Italy (Note 8). In 2007, revenue from spending by international tourists alone topped 25 billion euros and grew by 4.5% on the previous year. Consequently tourism can be quite rightly defined as an excellent resource. Tourism is an industry that generates economic wealth from a cultural and natural patrimony of inestimable value. In 2006, Italy was the world's fourth leading country in terms of tourist spending after the USA, Spain and France. Closer territorial analysis of 2007 reveals that spending (Note 9) by international visitors to Veneto was 4.3 billion euro-16.9% of spending by international visitors in Italy-a figure that makes Veneto Italy's second region after Lazio. This remarkable achievement is due to the huge number of international visitors that come to Veneto, a share which makes Veneto Italy's leading region with about 19.3% of the total of international visitors coming to Italy. This constant flow of arrivals is combined with an equally impressive performance in terms of nights spent (17.5% of Italy's total). For about 80% of international tourists, the main reason for visiting Veneto is for a holiday; about 15% come for work; while the remaining 5% come for other personal reasons such as study, visiting friends and relatives, treatment, etc.. However, figures are lower for the average expenditure of tourists during their holiday: in Veneto expenditure per capita stands at around €425 compared with an Italian average of €486. This figure is linked to the length of stay, which is one of the shortest when compared to other Italian regions (4.9 days compared with a national average of 5.4). International tourists spent an average daily amount per capita of €87.20, which puts Veneto in 6th place among Italy's regions. The graph reveals that in comparison with Italian regions Veneto stands out for its low number of nights spent and high average daily spending, alongside regions such as Lombardia and Piemonte, which are characterised by high flows of business tourism. (Figure 1.31) If we look at spending abroad, people from Veneto spent 1,495 million euros, which ranks Veneto in 3rd place with 9.3% of the national total after Lombardia and Lazio. The high revenues of incoming tourism and the more contained spending of outgoing tourism make Veneto Italy's leading region in terms of payment balance: 2,779 million euros in 2007. If the spending of international tourism (revenue), that of Italians holidaying abroad (expenditure) and the tourist balance are taken as a percentage of GDP, we notice that Veneto's balance is much higher than Italy's. This is not so much due to expenditure, which is similar, as to revenue, which has much more of an influence on Veneto's economy than on Italy's revenue in this sector. (Figure 1.32) Added value within the hotel and restaurant sector should also be considered in order to highlight the overall economic importance of this sector, which is not simply bound to international tourism. This figure, which is only an approximate forecast of the added value for the entire tourism sector (Note 10), was more than 5.5 billion euros in Veneto in 2005. It is 11.4% of the national total, a share that is second only to Lombardia. The importance of added value within the hotel and restaurant sector for Veneto's entire economy is higher than the national level (4.6% compared with 3.8%). Its success is sustained by the promotion and the communication strategies that Regione Veneto has adopted to raise awareness and penetration in both the domestic and international markets. Communication and promotional events are carefully geared towards enhancing the image of Veneto all over the world. One example is the region's participation in international events, including Italy's B.I.T. and other international tourism exhibitions, which are held both to attract the attention of new markets, such as Russia, Japan, China and Ireland, and to keep faith with its traditional ones such as Germany, Austria, United Kingdom, Holland, France, Switzerland and Spain.
|
|
Data elaborated by the Statistics office of the Veneto region are collective property; reproduction of this material is authorised for non-commercial purposes only, provided the source "Regione Veneto - Regional Statistics System Management" is acknowledged.


 Index
Index  Home
Home 

